Ocultar código
library(glue)
library(ggtext)
library(showtext)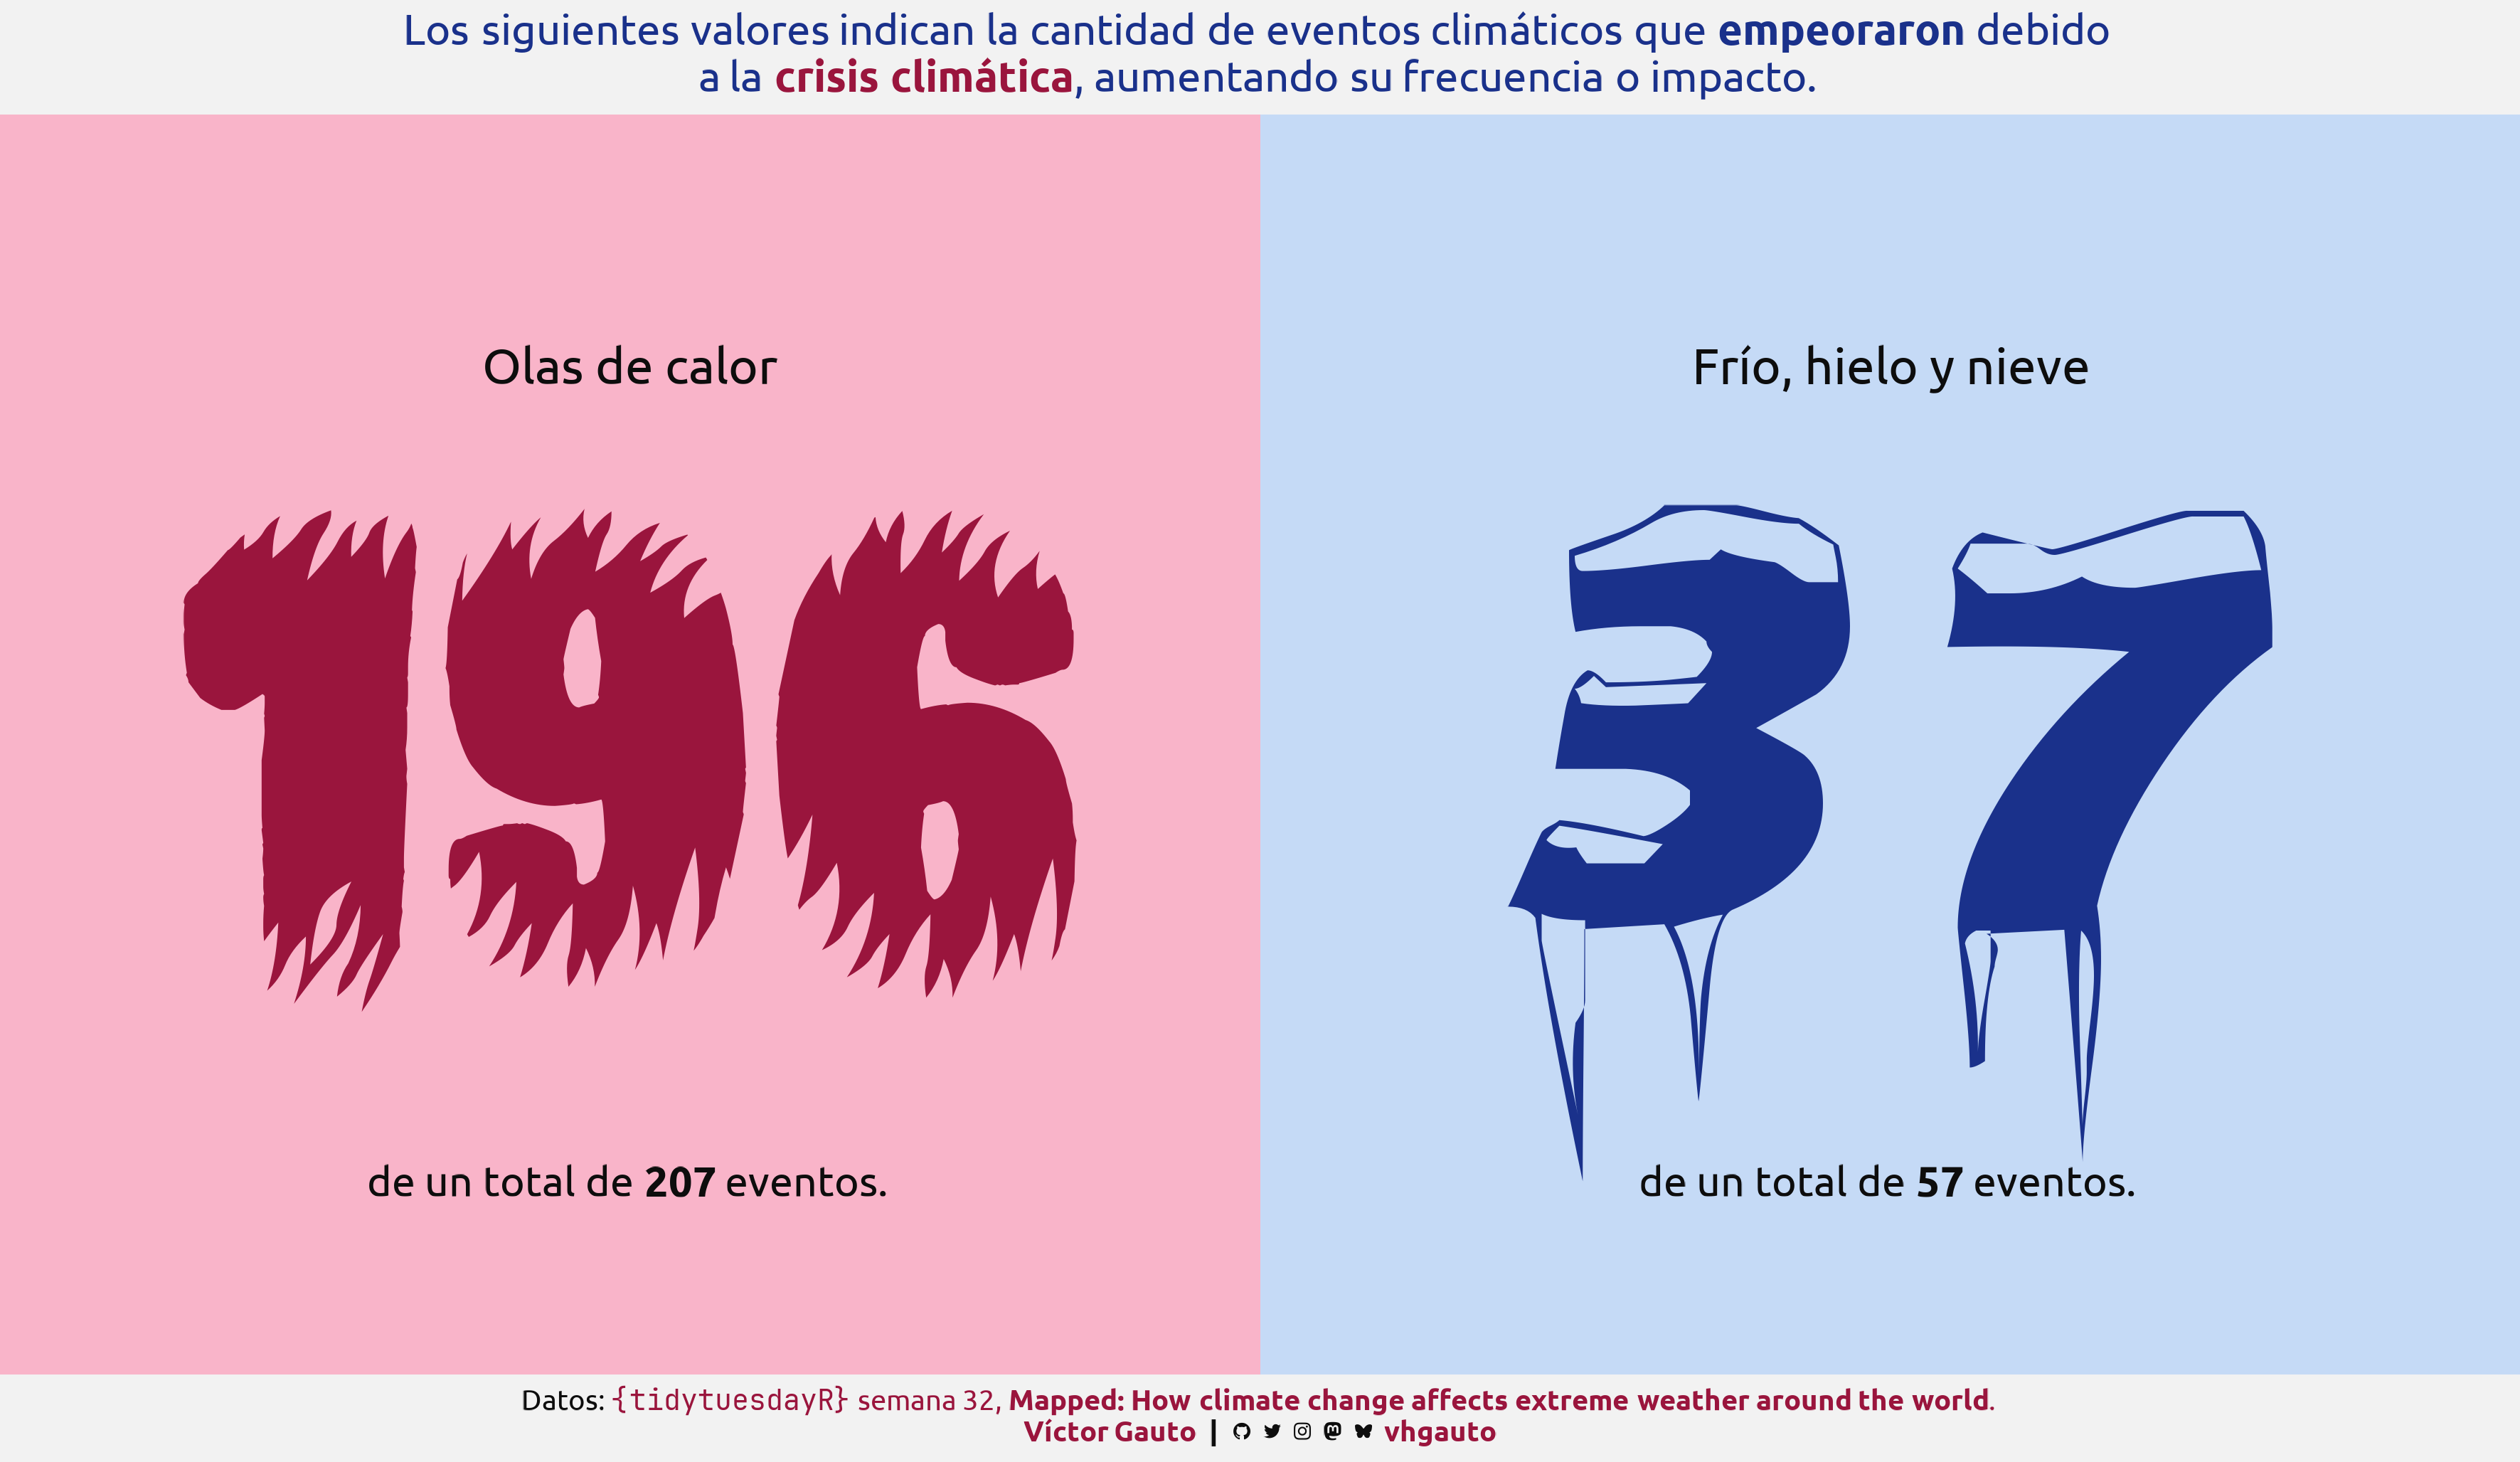
library(tidyverse)Cantidad de eventos que empeoraron dada la crisis climática, para olas de calor y frío/hielo/nieve.
library(glue)
library(ggtext)
library(showtext)
library(tidyverse)Colores.
c1 <- "#9A153D"
c2 <- "#F9B4C9"
c3 <- "#1A318B"
c4 <- "#C5DAF6"
c5 <- "grey95"
c6 <- "grey5"
Fuentes: Ubuntu y JetBrains Mono.
font_add(
  family = "ubuntu",
  regular = "././fuente/Ubuntu-Regular.ttf",
  bold = "././fuente/Ubuntu-Bold.ttf",
  italic = "././fuente/Ubuntu-Italic.ttf"
)

font_add(
  family = "jet",
  regular = "././fuente/JetBrainsMonoNLNerdFontMono-Regular.ttf"
)

font_add(
  family = "flame",
  regular = "fuente/Inner Mounting Flame.ttf"
)

font_add(
  family = "ice",
  regular = "fuente/IceCaps.ttf"
)

showtext_auto()
showtext_opts(dpi = 300)fuente <- glue(
"Datos: <span style='color:{c1};'><span style='font-family:jet;'>",
"{{<b>tidytuesdayR</b>}}</span> semana 32, ",
"<b>Mapped: How climate change affects extreme weather around the world</b>.</span>"
)
autor <- glue("<span style='color:{c1};'>**Víctor Gauto**</span>")
icon_twitter <- glue("<span style='font-family:jet;'></span>")
icon_instagram <- glue("<span style='font-family:jet;'></span>")
icon_github <- glue("<span style='font-family:jet;'></span>")
icon_mastodon <- glue("<span style='font-family:jet;'>󰫑</span>")
icon_bsky <- glue("<span style='font-family:jet;'></span>")
usuario <- glue("<span style='color:{c1};'>**vhgauto**</span>")
sep <- glue("**|**")
mi_caption <- glue(
"{fuente}<br>{autor} {sep} {icon_github} {icon_twitter} {icon_instagram} ",
"{icon_mastodon} {icon_bsky} {usuario}"
)tuesdata <- tidytuesdayR::tt_load(2025, 32)
attribution_studies <- tuesdata$attribution_studies
attribution_studies_raw <- tuesdata$attribution_studies_rawMe interesa la cantidad de eventos que empeoraron debido la crisis climática, específicamente, olas de calor y frío.
Ordeno las clasificaciones, obtengo todos los eventos para calor y frío, y la cantidad de cada uno que empeoraron.
orden_clasificacion <- c(
  "More severe or more likely to occur",
  "No discernible human influence",
  "Decrease, less severe or less likely to occur",
  "Insufficient data/inconclusive"
)

eventos <- attribution_studies |>
  filter(event_type %in% c("Heat", "Cold, snow & ice")) |>
  count(event_type) |>
  arrange(desc(n)) |>
  pull(n)

n <- attribution_studies |>
  filter(event_type %in% c("Heat", "Cold, snow & ice")) |>
  count(event_type, classification) |>
  slice_max(order_by = n, n = 1, by = event_type) |>
  arrange(desc(n)) |>
pull(n)Tamaño de números principales y título. La fuente para las olas de calor es Inner mounting flame y para frío, hielo y nieve es Ice caps.
tamaño <- 5

mi_titulo <- glue(
  "Los siguientes valores indican la cantidad de eventos climáticos que
  **empeoraron** debido<br>
  a la <b style='color: {c1};'>crisis climática</b>, aumentando su
  frecuencia o impacto."
)
Figura.
g <- ggplot() +
  annotate(
    geom = "rect",
    xmin = c(0, 1),
    xmax = c(1, 2),
    ymin = 0,
    ymax = 1,
    fill = c(c2, c4)
  ) +
  annotate(
    geom = "text",
    x = c(.5, 1.5),
    y = c(.5, .48),
    label = n,
    family = c("flame", "ice"),
    size = c(tamaño, tamaño * 1.9),
    size.unit = "cm",
    color = c(c1, c3)
  ) +
  annotate(
    geom = "text",
    x = c(.5, 1.5),
    y = .8,
    label = c(
      glue("Olas de calor"),
      glue("Frío, hielo y nieve")
    ),
    color = c6,
    family = "ubuntu",
    size = .6,
    size.unit = "cm",
  ) +
  annotate(
    geom = "richtext",
    x = c(.5, 1.5),
    y = .15,
    label = glue("de un total de **{eventos}** eventos."),
    color = c6,
    family = "ubuntu",
    fill = NA,
    label.color = NA,
    size = 5
  ) +
  labs(
    title = mi_titulo,
    caption = mi_caption
  ) +
  coord_equal(xlim = c(0, 2), ylim = c(0, 1), expand = FALSE) +
  theme_void(base_family = "ubuntu", base_size = 12) +
  theme(
    plot.background = element_rect(fill = c5, color = NA),
    plot.title = element_markdown(
      color = c3,
      lineheight = 1.1,
      hjust = .5,
      margin = margin(b = 5, t = 5)
    ),
    plot.caption = element_markdown(
      color = c6,
      margin = margin(b = 5, t = 5),
      lineheight = 1.1,
      hjust = .5
    )
  )
Guardo.
ggsave(
  plot = g,
  filename = "tidytuesday/2025/semana_32.png",
  width = 30,
  height = 17.4,
  units = "cm"
)