Ocultar código
library(glue)
library(ggtext)
library(showtext)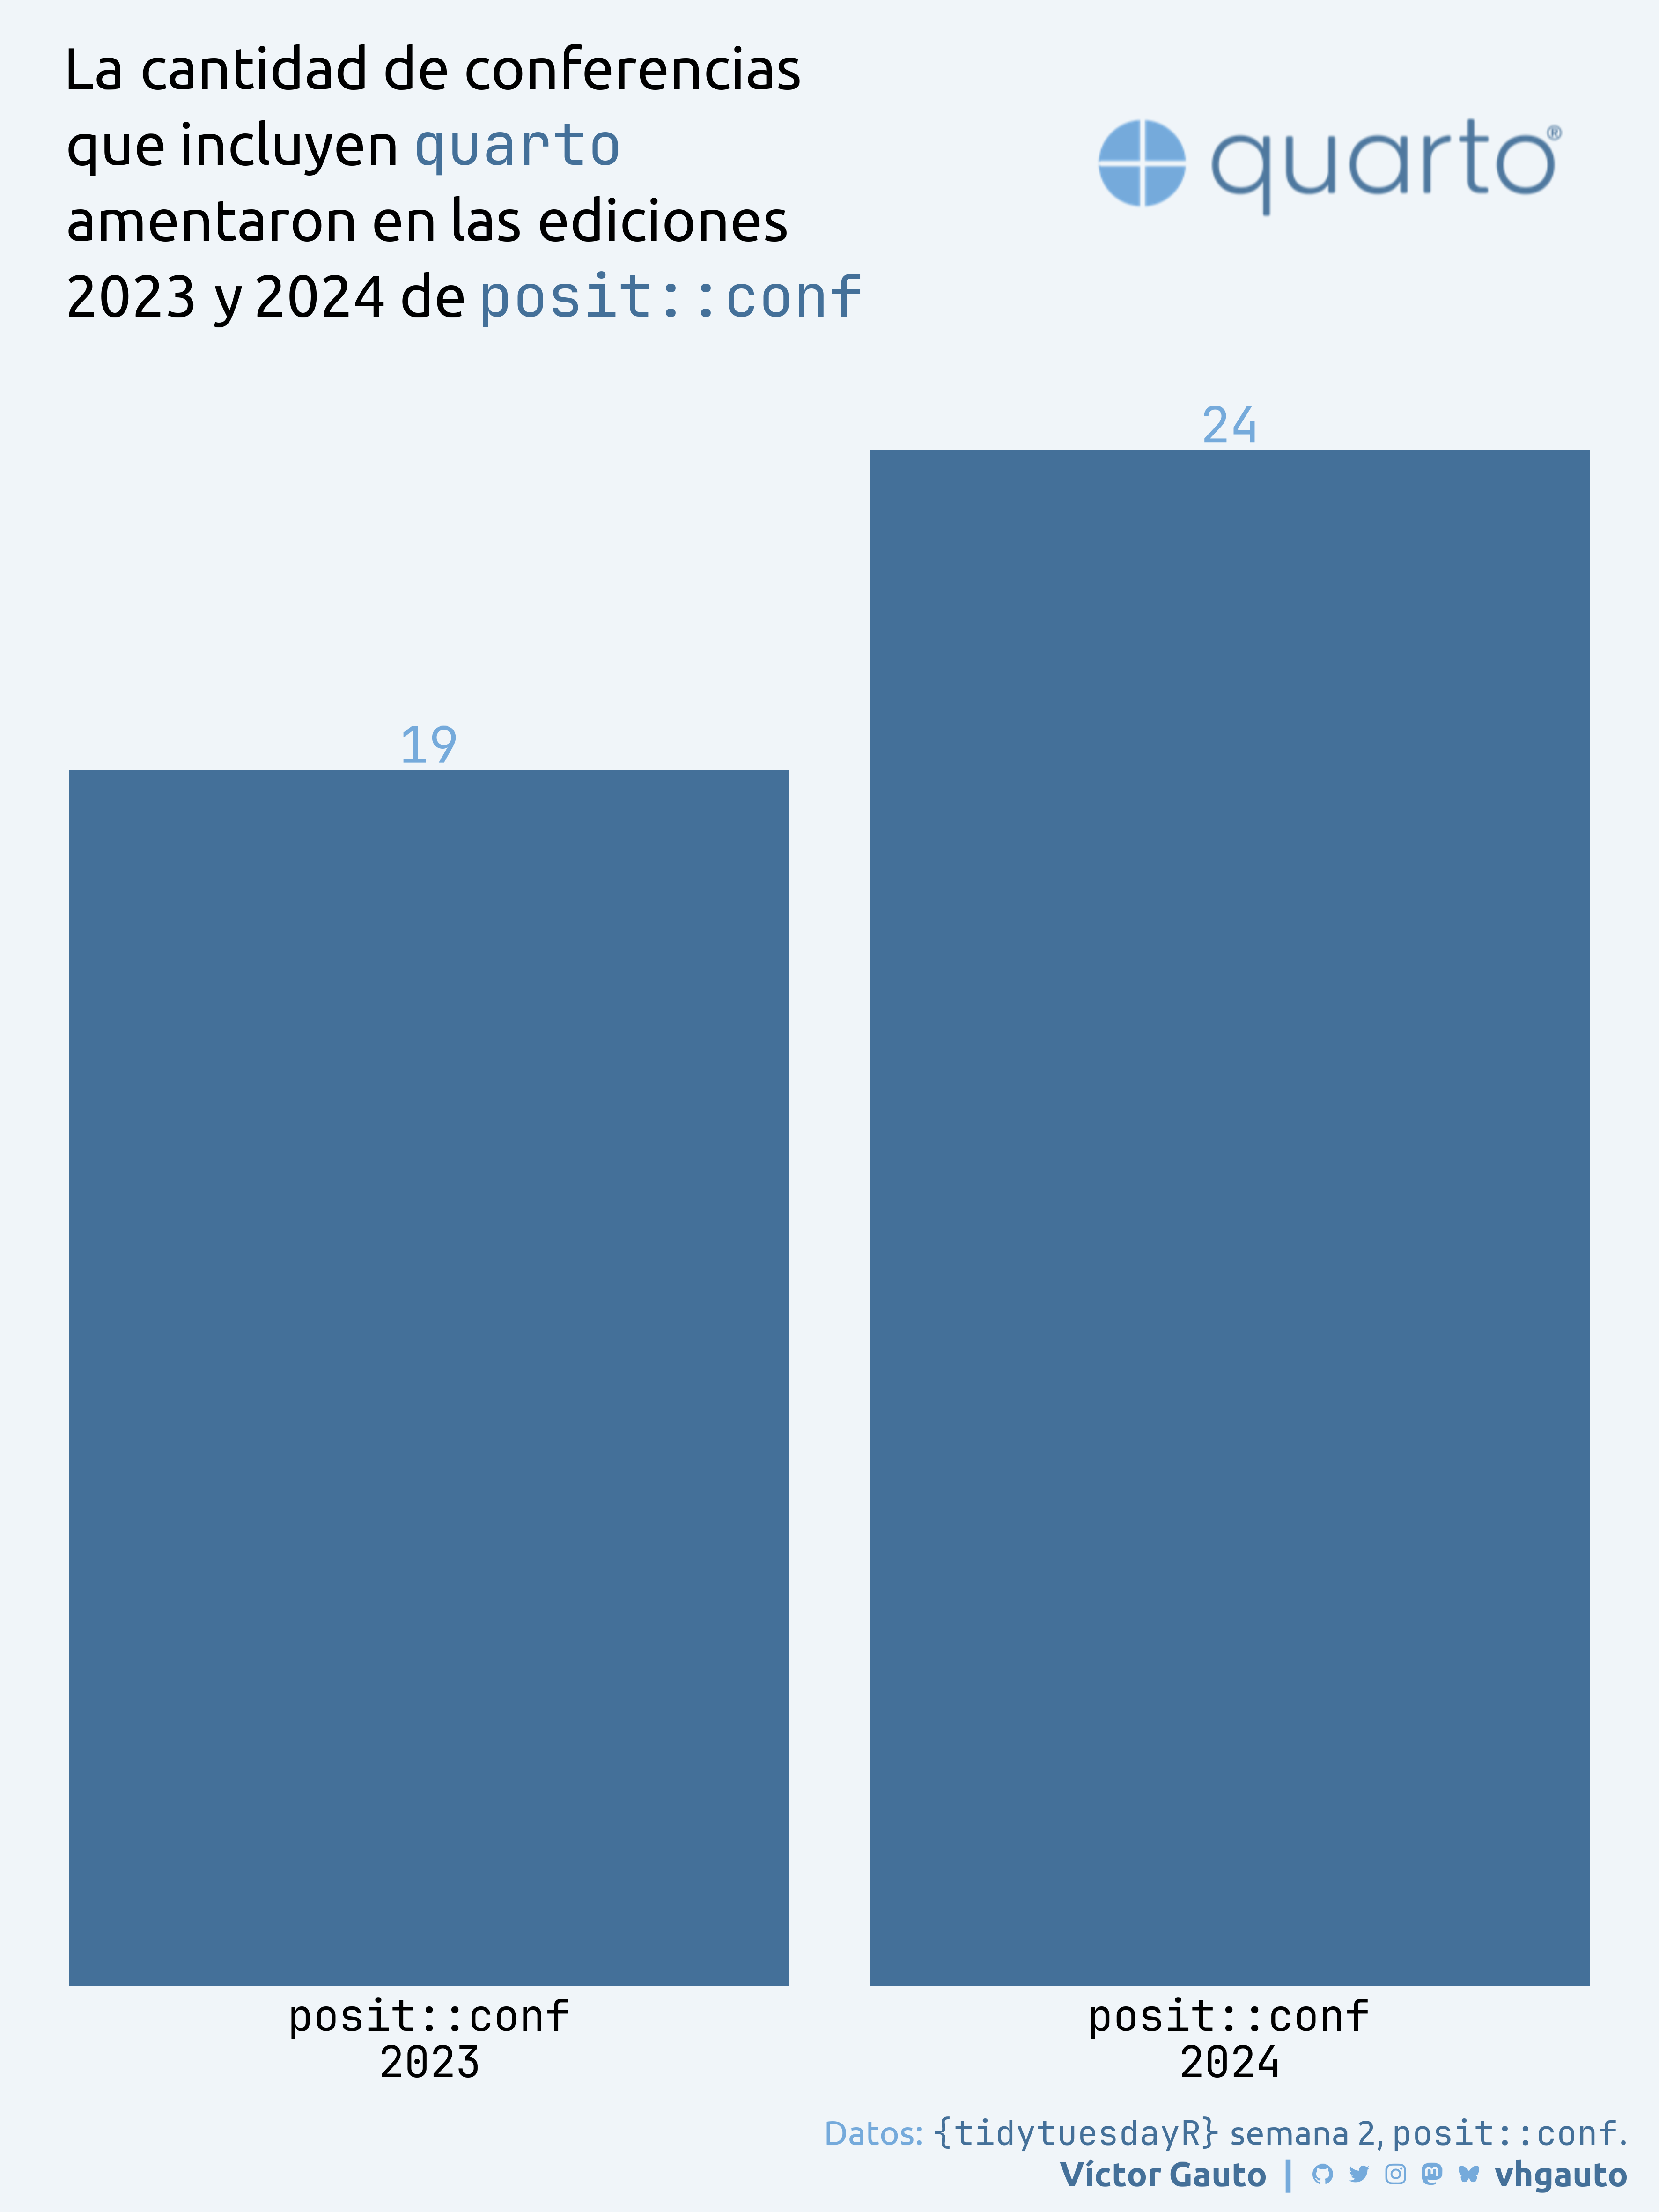
library(tidyverse)Conferencias asociadas a quarto en posit::conf entre 2023 y 2024.
library(glue)
library(ggtext)
library(showtext)
library(tidyverse)Colores
c1 <- "#447099"
c2 <- "#75AADB"
c3 <- "#F0F5F9"
c4 <- "black"
Fuentes: Ubuntu y JetBrains Mono
font_add(
  family = "ubuntu",
  regular = "././fuente/Ubuntu-Regular.ttf",
  bold = "././fuente/Ubuntu-Bold.ttf",
  italic = "././fuente/Ubuntu-Italic.ttf"
)

font_add(
  family = "jet",
  regular = "././fuente/JetBrainsMonoNLNerdFontMono-Regular.ttf"
)

showtext_auto()
showtext_opts(dpi = 300)fuente <- glue(
"Datos: <span style='color:{c1};'><span style='font-family:jet;'>",
"{{<b>tidytuesdayR</b>}}</span> semana 2, ",
"<b><span style='font-family:jet'>posit::conf</jet></b>.</span>"
)
autor <- glue("<span style='color:{c1};'>**Víctor Gauto**</span>")
icon_twitter <- glue("<span style='font-family:jet;'></span>")
icon_instagram <- glue("<span style='font-family:jet;'></span>")
icon_github <- glue("<span style='font-family:jet;'></span>")
icon_mastodon <- glue("<span style='font-family:jet;'>󰫑</span>")
icon_bsky <- glue("<span style='font-family:jet;'></span>")
usuario <- glue("<span style='color:{c1};'>**vhgauto**</span>")
sep <- glue("**|**")
mi_caption <- glue(
"{fuente}<br>{autor} {sep} {icon_github} {icon_twitter} {icon_instagram} ",
"{icon_mastodon} {icon_bsky} {usuario}"
)tuesdata <- tidytuesdayR::tt_load(2025, 2)
conf2023 <- tuesdata$conf2023
conf2024 <- tuesdata$conf2024Me interesa la cantidad de conferencias que hablan de QUARTO entre 2023 y 2024
n2023 <- conf2023 |>
  mutate(quarto = str_detect(session_abstract, "quarto|Quarto")) |>
  dplyr::filter(quarto) |>
  nrow()

n2024 <- conf2024 |>
  mutate(quarto = str_detect(description, "quarto|Quarto")) |>
  dplyr::filter(quarto) |>
  nrow()

d <- tibble(
  año = c(2023, 2024),
  n = c(n2023, n2024)
) |>
  mutate(
    año = paste0("posit::conf\n", año)
)Logo y subtítulo
logo <- "https://quarto.org/quarto.png"
logo_img <- glue(
  "<img src='{logo}' width=250 />"
)

mi_subitulo <- glue(
  "La cantidad de conferencias<br>que incluyen
  <span style='font-family:jet; color:{c1}'>quarto</span> <br>
  amentaron en las ediciones<br>
  2023 y 2024 de <span style='font-family:jet; color:{c1}'>posit::conf</span>"
)
Figura
g <- ggplot(d, aes(año, n, label = n)) +
  geom_col(fill = c1) +
  geom_text(vjust = -.2, family = "jet", size = 9, color = c2) +
  annotate(
    geom = "richtext", x = 2.12, y = 25, label = logo_img, fill = NA,
    vjust = -1.2, label.color = NA
  ) +
  scale_y_continuous(limits = c(0, 25)) +
  coord_cartesian(expand = FALSE, xlim = c(.5, 2.5), clip = "off") +
  labs(caption = mi_caption, subtitle = mi_subitulo) +
  theme_void(base_size = 22, base_family = "ubuntu") +
  theme(
    aspect.ratio = 1,
    plot.margin = margin(25, 5, 5, 5),
    plot.background = element_rect(fill = c3, color = NA),
    plot.subtitle = element_markdown(
      color = c4, size = 30, lineheight = 1.3, margin = margin(b = 30, l = 20)
    ),
    plot.caption = element_markdown(
      color = c2, lineheight = 1.2, margin = margin(b = 5, t = 20)
    ),
    axis.text.x = element_text(margin = margin(t = 5), family = "jet"),
  )
Guardo
ggsave(
  plot = g,
  filename = "tidytuesday/2025/semana_02.png",
  width = 30,
  height = 40,
  units = "cm"
)