# paquetes ----------------------------------------------------------------
library(glue)
library(ggtext)
library(showtext)
library(ggfx)
library(tidyverse)
# fuente ------------------------------------------------------------------
# colores
colores <- MetBrewer::met.brewer(name = "Redon", n = 10) |>
as.character()
c1 <- colores[1]
c2 <- colores[10]
c3 <- "black"
c4 <- "grey95"
c5 <- "grey30"
# fuente: Ubuntu
font_add(
family = "ubuntu",
regular = "fuente/Ubuntu-Regular.ttf",
bold = "fuente/Ubuntu-Bold.ttf",
italic = "fuente/Ubuntu-Italic.ttf")
# fuente: Victor
font_add(
family = "victor",
regular = "fuente/VictorMono-ExtraLight.ttf",
bold = "fuente/VictorMono-VariableFont_wght.ttf",
italic = "fuente/VictorMono-ExtraLightItalic.ttf")
# fuente: Bebas Neue
font_add(
family = "bebas",
regular = "fuente/BebasNeue-Regular.ttf")
# íconos
font_add("fa-brands", "icon/Font Awesome 6 Brands-Regular-400.otf")
showtext_auto()
showtext_opts(dpi = 300)
# caption
fuente <- glue(
"Datos: <span style='color:{c1};'><span style='font-family:mono;'>",
"{{<b>tidytuesdayR</b>}}</span> semana {10}, ",
"**Mr. Trash Wheel Baltimore Healthy Harbor**</span>")
autor <- glue("<span style='color:{c1};'>**Víctor Gauto**</span>")
icon_twitter <- glue("<span style='font-family:fa-brands;'></span>")
icon_instagram <- glue("<span style='font-family:fa-brands;'></span>")
icon_github <- glue("<span style='font-family:fa-brands;'></span>")
icon_mastodon <- glue("<span style='font-family:fa-brands;'></span>")
usuario <- glue("<span style='color:{c1};'>**vhgauto**</span>")
sep <- glue("**|**")
mi_caption <- glue(
"{fuente}<br>{autor} {sep} {icon_github} {icon_twitter} {icon_instagram} ",
"{icon_mastodon} {usuario}")
# datos -------------------------------------------------------------------
tuesdata <- tidytuesdayR::tt_load(2024, 10)
trashwheel <- tuesdata$trashwheel
# me interesa ver las tendencias de cantidad de toneladas mensuales, por año
d <- trashwheel |>
mutate(Date = mdy(Date)) |>
select(peso = Weight, fecha = Date) |>
mutate(mes = month(fecha)) |>
mutate(año = year(fecha)) |>
drop_na() |>
mutate(año = factor(año))
# figura ------------------------------------------------------------------
# iniciales de los meses, eje horizontal
x_meses <- ymd(glue("2024-{1:12}-01")) |>
format("%B") |>
str_to_upper() |>
str_sub(start = 0, end = 1) |>
fct_inorder()
# rectángulo para los paneles
x_i <- .5
x_f <- 12.5
y_i <- 1.5
y_f <- 4
rect_tbl <- tibble(
xmin = x_i,
xmax = x_f,
ymin = y_i,
ymax = y_f,
año = unique(d$año)
)
# meses en eje horizontal, en todos los paneles
meses_lst <- tibble(
x = 1:12,
y = y_i,
label = x_meses
) |> list()
meses_tbl <- tibble(
año = unique(d$año),
data = meses_lst
) |>
unnest(data)
# años, en cada panel
año_tbl <- tibble(
x = 6.5, y = 4, año = factor(2014:2023)
)
# pesos sobre las horizontales
peso_tbl <- tibble(
x = rep(.7, 4),
y = rep(2:3, 2),
label = rep(glue("{2:3}tn"), 2),
año = fct(c("2014", "2014", "2019", "2019"))
)
# logo de Mr. Trash Wheel
logo <- "<img src='2024/s10/logo.png' width='70'></img>"
# título
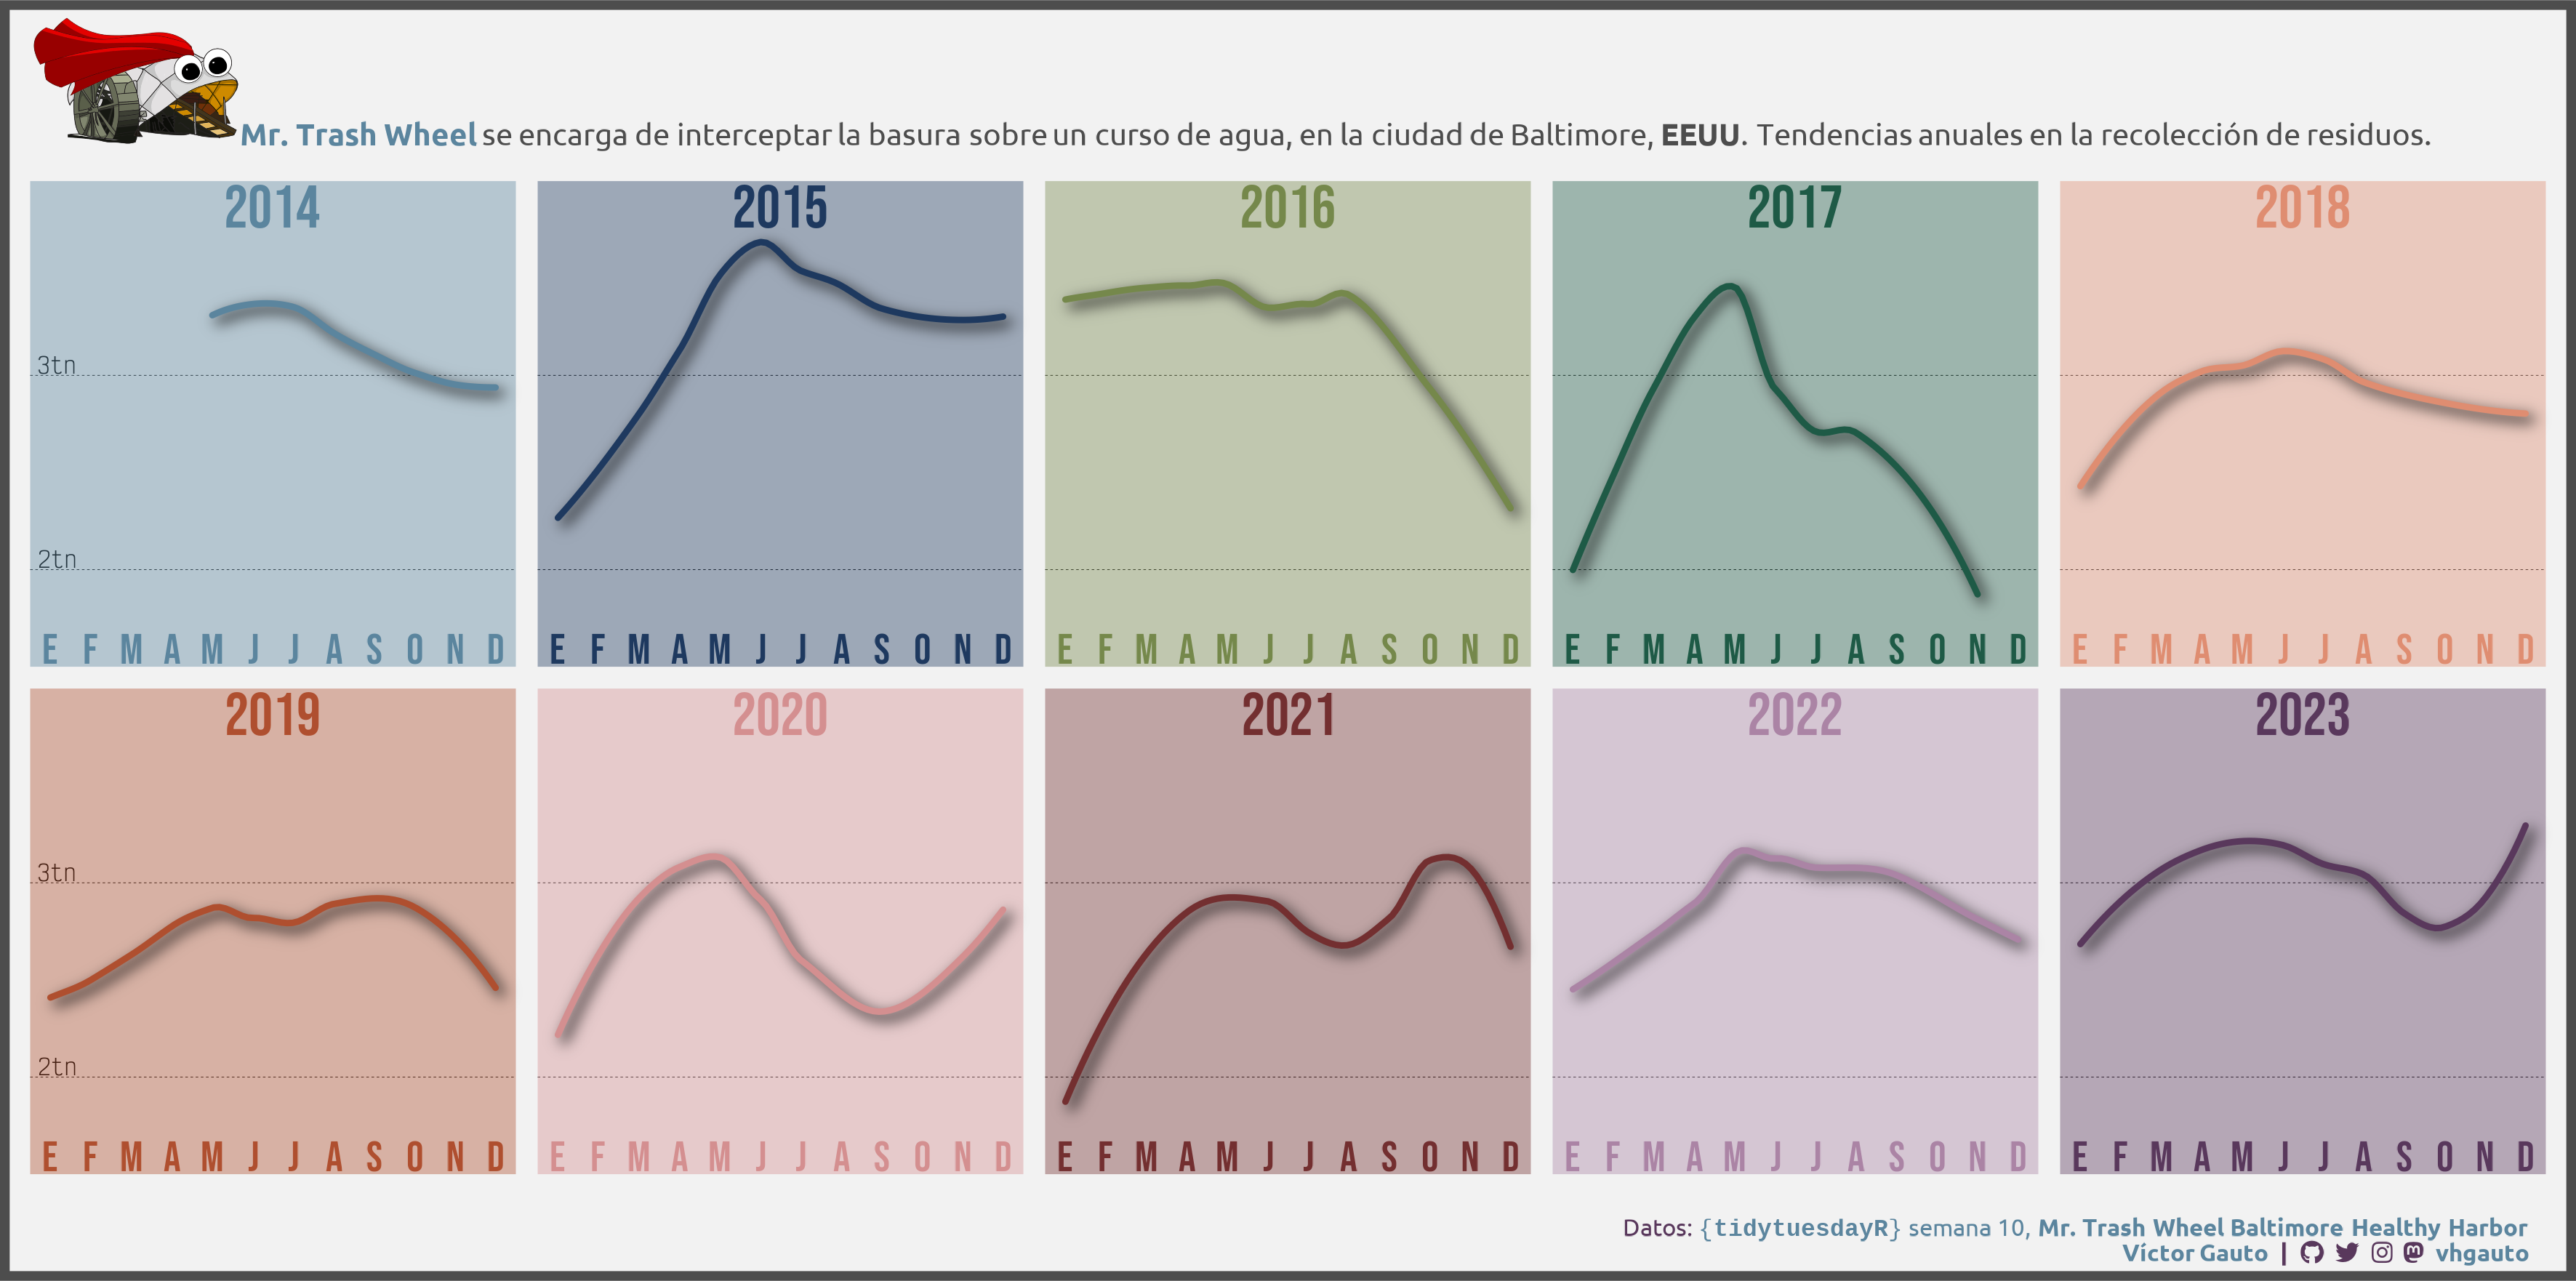
mi_title <- glue(
"{logo} <b style='color:{c1}'>Mr. Trash Wheel</b> se ",
"encarga de interceptar la basura sobre un curso de agua, ",
"en la ciudad de Baltimore, <b>EEUU</b>. Tendencias anuales ",
"en la recolección de residuos."
)
# figura
g <- ggplot(d, aes(mes, peso, color = año)) +
# horizontales
geom_hline(
yintercept = c(2, 3), linetype = 2, linewidth = .1
) +
# pesos
geom_text(
data = peso_tbl, aes(x, y, label = label), hjust = 0, vjust = -.1,
family = "victor", size = 2.5, color = c3
) +
# paneles
geom_rect(
data = rect_tbl,
aes(xmin = xmin, xmax = xmax, ymin = ymin, ymax = ymax, fill = año),
inherit.aes = FALSE, show.legend = FALSE) +
# tendencias, con sombra
with_shadow(
geom_smooth(
method = loess, formula = y ~ x, se = FALSE, show.legend = FALSE,
lineend = "round"),
sigma = 10, x_offset = 8, y_offset = 8
) +
# meses
geom_text(
data = meses_tbl, aes(x, y, label = label, color = año),
size = 5, family = "bebas", vjust = -.1, show.legend = FALSE
) +
# año
geom_text(
data = año_tbl, aes(x, y, label = año, color = año), show.legend = FALSE,
family = "bebas", size = 7, vjust = 1.1
) +
facet_wrap(vars(año), nrow = 2, scales = "free") +
scale_x_continuous(
breaks = 1:12, labels = x_meses
) +
scale_y_continuous(
breaks = seq(.5, 6, .5)
) +
scale_color_manual(
values = colores
) +
scale_fill_manual(
values = alpha(colores, .4)
) +
labs(title = mi_title, caption = mi_caption) +
coord_cartesian(
ylim = c(1.5, 4), xlim = c(.5, 12.5), expand = FALSE, clip = "off") +
theme_void() +
theme(
aspect.ratio = 1,
plot.margin = margin(r = 10, l = 10),
plot.background = element_rect(fill = c4, color = c5, linewidth = 3),
plot.title = element_markdown(
color = c5, family = "ubuntu", size = 10,
margin = margin(b = 10, t = 5)),
plot.caption = element_markdown(
color = c2, family = "ubuntu", margin = margin(t = 15, b = 5, r = 5),
size = 8),
strip.text = element_blank(),
panel.spacing = unit(.5, "line")
)
# guardo
ggsave(
plot = g,
filename = "2024/s10/viz.png",
width = 30,
height = 14.922,
units = "cm")
# abro
browseURL("2024/s10/viz.png")