Ocultar código
library(glue)
library(ggtext)
library(showtext)
library(tidyverse)Categoría racial y género de jueces federales de EE.UU.
library(glue)
library(ggtext)
library(showtext)
library(tidyverse)Colores.
MoMAColors::moma.colors(palette_name = "Palermo")
c1 <- "#0C3C5F"
c2 <- "#E24346"
c3 <- "#894143"
c4 <- "#196C9D"
c5 <- "#FCFBFD"
Fuentes: Ubuntu y JetBrains Mono.
font_add(
  family = "ubuntu",
  regular = "././fuente/Ubuntu-Regular.ttf",
  bold = "././fuente/Ubuntu-Bold.ttf",
  italic = "././fuente/Ubuntu-Italic.ttf"
)

font_add(
  family = "jet",
  regular = "././fuente/JetBrainsMonoNLNerdFontMono-Regular.ttf"
)

showtext_auto()
showtext_opts(dpi = 300)fuente <- glue(
"Datos: <span style='color:{c1};'><span style='font-family:jet;'>",
"{{<b>tidytuesdayR</b>}}</span> semana 23, ",
"<b>{{historydata}}</b>.</span>"
)
autor <- glue("<span style='color:{c1};'>**Víctor Gauto**</span>")
icon_twitter <- glue("<span style='font-family:jet;'></span>")
icon_instagram <- glue("<span style='font-family:jet;'></span>")
icon_github <- glue("<span style='font-family:jet;'></span>")
icon_mastodon <- glue("<span style='font-family:jet;'>󰫑</span>")
icon_bsky <- glue("<span style='font-family:jet;'></span>")
usuario <- glue("<span style='color:{c1};'>**vhgauto**</span>")
sep <- glue("**|**")
mi_caption <- glue(
"{fuente}<br>{autor} {sep} {icon_github} {icon_twitter} {icon_instagram} ",
"{icon_mastodon} {icon_bsky} {usuario}"
)tuesdata <- tidytuesdayR::tt_load(2025, 23)
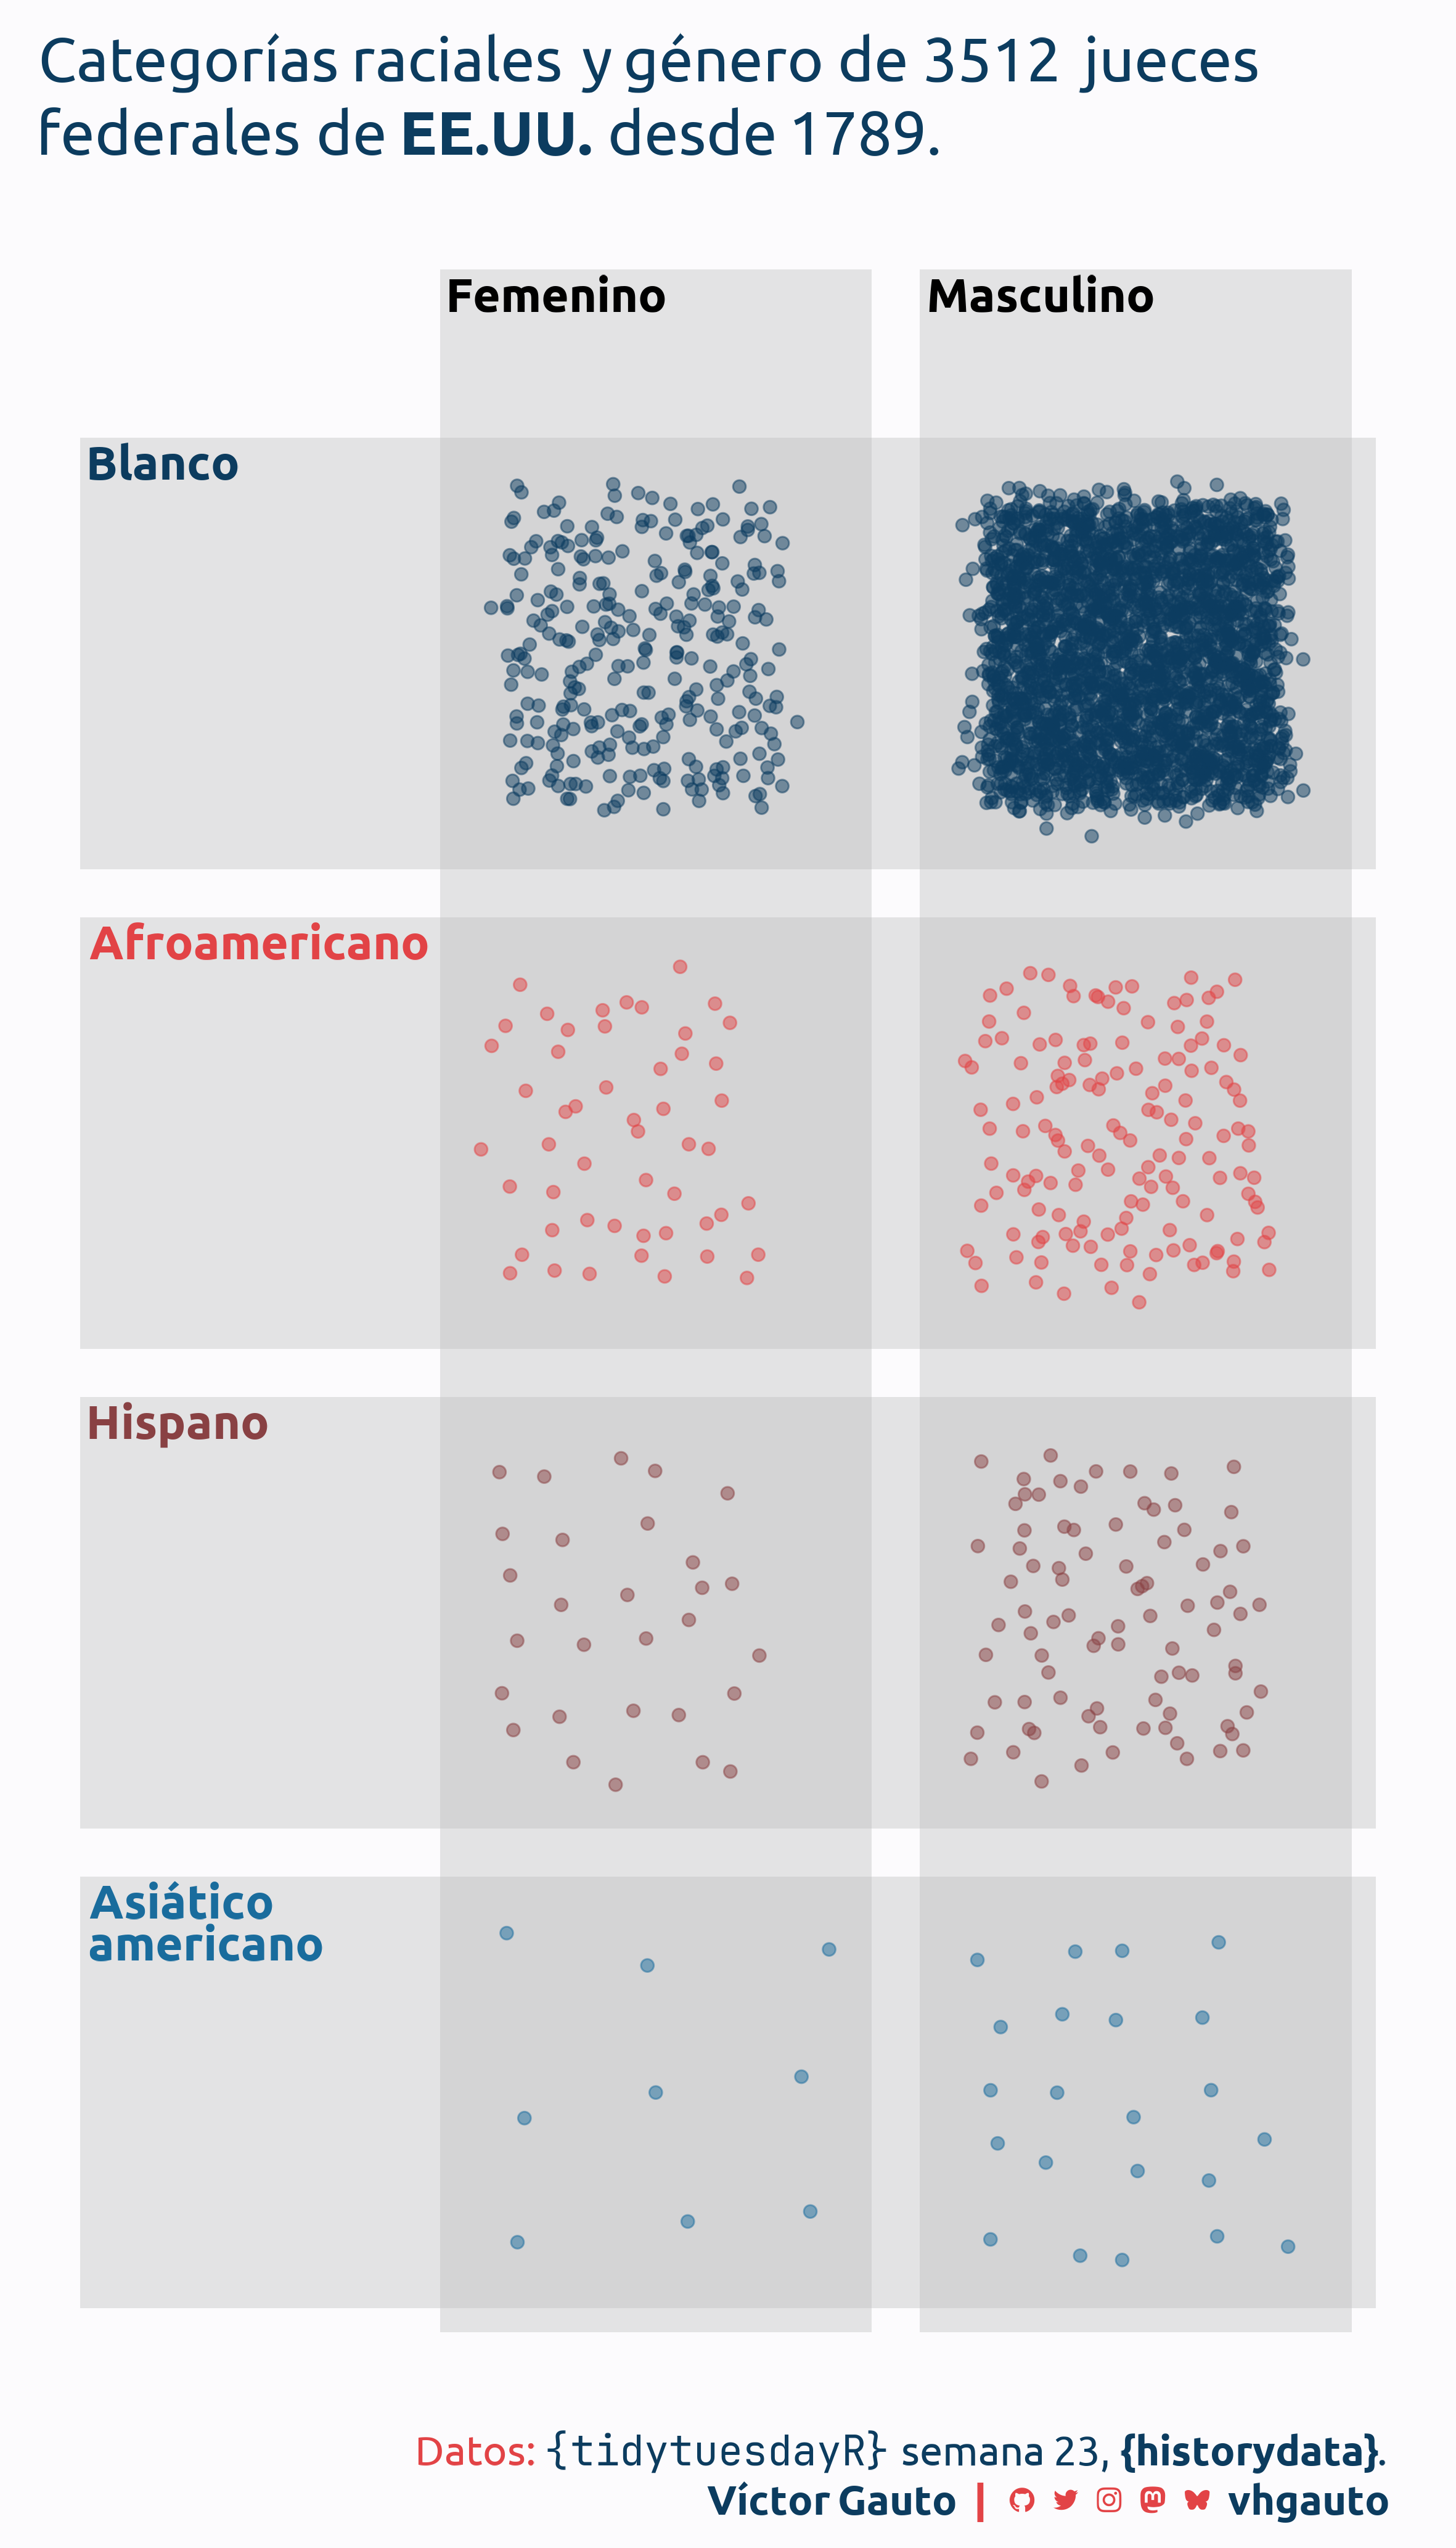
judges_people <- tuesdata$judges_peopleMe interesa la cantidad de jueces masculinos y femeninos, según su categoría racial.
Selecciono las más frecuentes, agrego sus traducciones y asigno colores.
race_v <- c("Asian American", "Hispanic", "African American", "White")
race_trad <- c("Asiático\namericano", "Hispano", "Afroamericano", "Blanco")

race_trad <- glue(
  "<b style='color: {c(c4, c3, c2, c1)}'>
  {race_trad}
  </b>"
)

race_trad <- set_names(race_trad, race_v)
Creo función para generar una grilla con puntos aleatorios
set.seed(2025)
f_puntos <- function(n, fila, columna) {
  lado <- ceiling(sqrt(n))
  expand_grid(
    x = seq(fila+.2, fila+.8, length.out = lado),
    y = seq(columna+.2, columna+.8, length.out = lado)
  ) |>
    mutate(
      x = x+rnorm(lado^2)*.025,
      y = y+rnorm(lado^2)*.025
    ) |>
    slice_head(n = n)
}
Cuento la cantidad de jueces por categoría racial y género. Genero los puntos a partir de las cantidades y posiciones.
d <- judges_people |>
  count(race, gender, sort = TRUE) |>
  drop_na() |>
  filter(n >= 9) |>
  mutate(tipo = race_trad[race]) |>
  mutate(tipo = fct_reorder(tipo, n)) |>
  mutate(tipo = fct_rev(tipo)) |>
  arrange(desc(race), gender) |>
  mutate(
    columna = map_dbl(tipo, ~which(.x == race_trad)),
    fila = if_else(gender == "F", 1, 2)
  )

l <- pmap(
  .l = list(d$n, d$fila, d$columna),
  .f = f_puntos
)Defino los rectángulos alrededor de las categorías raciales y del género.
filas_tbl <- tibble(
  xmin = .3,
  xmax = 3,
  ymin = 1:4+.05,
  ymax = 2:5-.05
)

columnas_tbl <- tibble(
  xmin = c(1, 2)+.05,
  xmax = c(2, 3)-.05,
  ymin = 1,
  ymax = 5.3
)
Título y figura.
mi_titulo <- glue(
  "Categorías raciales y género de {sum(d$n)} jueces<br>federales de **EE.UU.**
  desde 1789."
)

g <- d |>
  mutate(p = l) |>
  unnest(p) |>
  ggplot(aes(x, y, color = tipo)) +
  geom_rect(
    data = filas_tbl,
    aes(xmin = xmin, xmax = xmax, ymin = ymin, ymax = ymax),
    fill = alpha("grey", .4), linetype = 1, linewidth = 1, color = NA,
    inherit.aes = FALSE
  ) +
  geom_rect(
    data = columnas_tbl,
    aes(xmin = xmin, xmax = xmax, ymin = ymin, ymax = ymax),
    fill = alpha("grey", .4), linetype = 1, linewidth = 1, color = NA,
    inherit.aes = FALSE
  ) +
  geom_point(alpha = .5, size = 2, show.legend = FALSE) +
  annotate(
    geom = "richtext",
    x = filas_tbl$xmin,
    y = filas_tbl$ymax,
    hjust = 0,
    vjust = 1,
    fill = NA,
    label = race_trad,
    label.color = NA,
    size = 6.5,
    family = "ubuntu"
  ) +
  annotate(
    geom = "richtext",
    x = columnas_tbl$xmin,
    y = columnas_tbl$ymax,
    hjust = 0,
    vjust = 1,
    fill = NA,
    label = c("Femenino", "Masculino"),
    label.color = NA,
    size = 6.5,
    family = "ubuntu",
    fontface = "bold"
  ) +
  labs(title = mi_titulo, caption = mi_caption) +
  coord_equal() +
  scale_color_manual(
    values = c(c1, c2, c3, c4)
  ) +
  theme_void(base_size = 20, base_family = "ubuntu") +
  theme(
    plot.background = element_rect(fill = c5, color = NA),
    plot.margin = margin(5, 5, 10, 5),
    plot.title = element_markdown(
      color = c1, lineheight = 1.2, margin = margin(l = 10, t = 10)
    ),
    plot.caption = element_markdown(
      color = c2, lineheight = 1.2, margin = margin(r = 20)
    )
  )
Guardo.
ggsave(
  plot = g,
  filename = "tidytuesday/2025/semana_23.png",
  width = 20,
  height = 35,
  units = "cm"
)