Ocultar código
library(glue)
library(ggtext)
library(showtext)
library(marquee)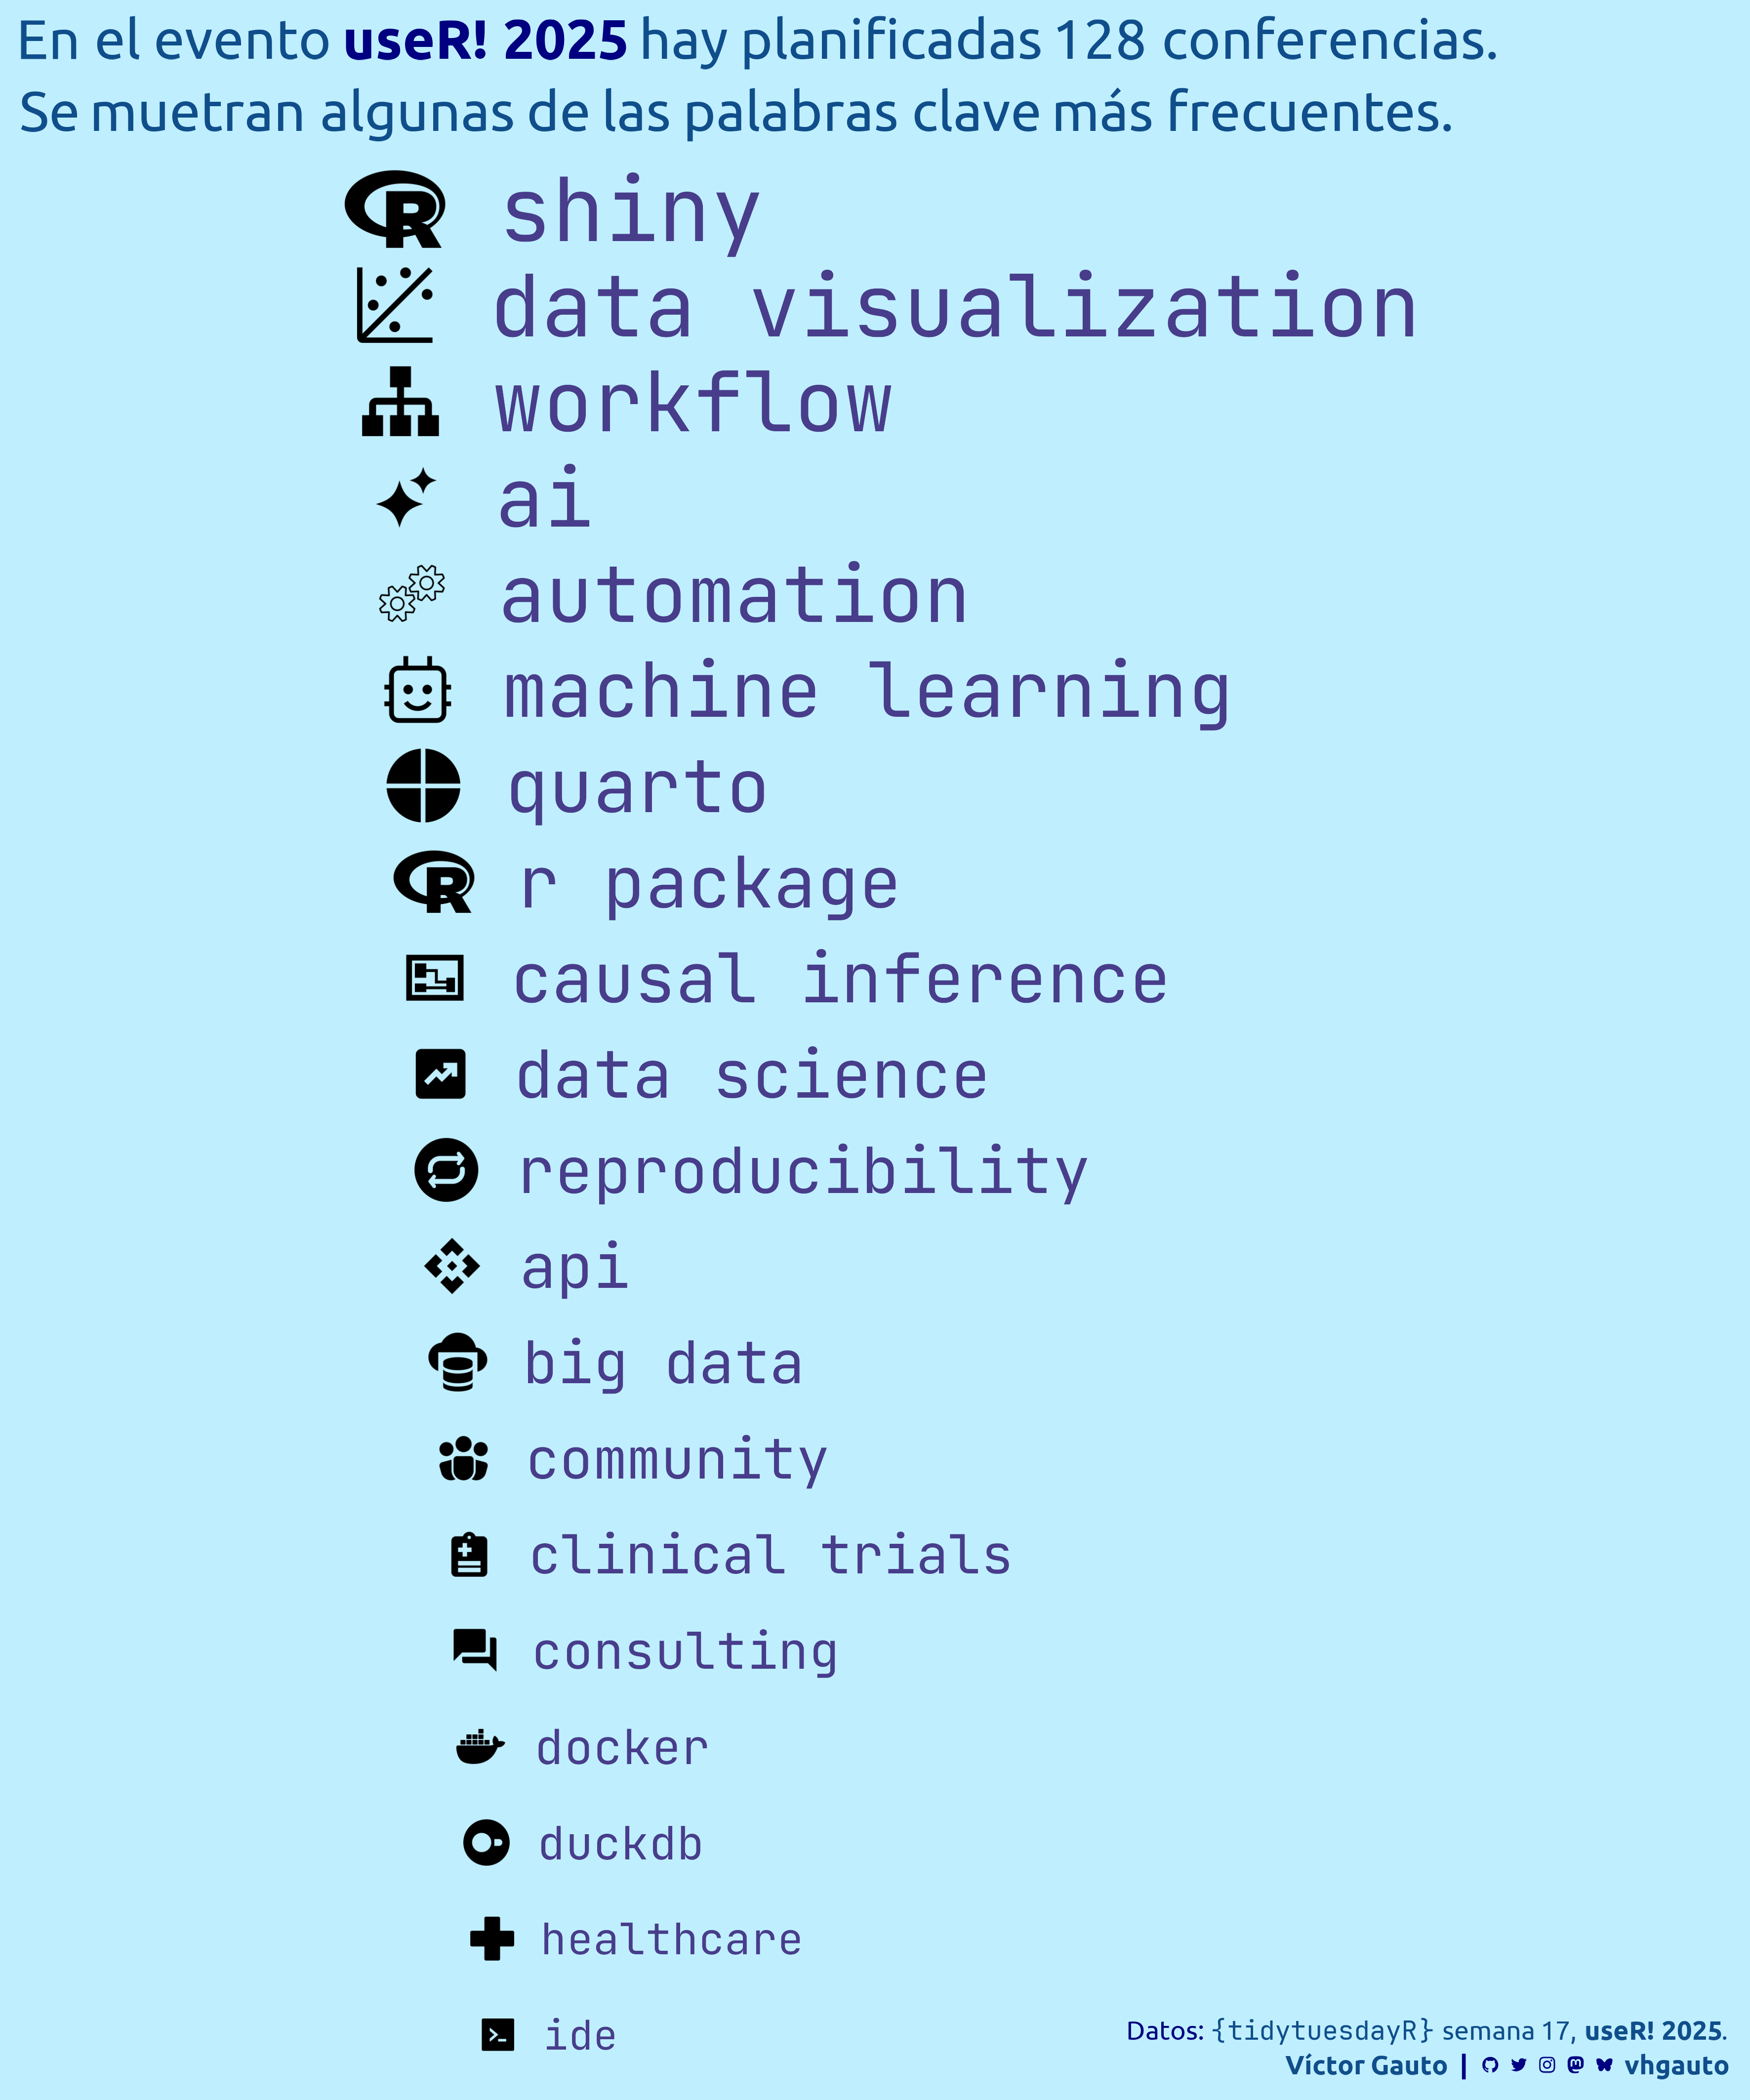
library(tidyverse)Palabras clave de las conferencias del evento userR! 2025.
library(glue)
library(ggtext)
library(showtext)
library(marquee)
library(tidyverse)Colores.
c1 <- "dodgerblue4"
c2 <- "lightblue1"
c3 <- "navyblue"
c4 <- "darkslateblue"
Fuentes: Ubuntu y JetBrains Mono.
font_add(
  family = "ubuntu",
  regular = "././fuente/Ubuntu-Regular.ttf",
  bold = "././fuente/Ubuntu-Bold.ttf",
  italic = "././fuente/Ubuntu-Italic.ttf"
)

font_add(
  family = "jet",
  regular = "././fuente/JetBrainsMonoNLNerdFontMono-Regular.ttf"
)

showtext_auto()
showtext_opts(dpi = 300)fuente <- glue(
"Datos: <span style='color:{c1};'><span style='font-family:jet;'>",
"{{<b>tidytuesdayR</b>}}</span> semana 17, ",
"<b>useR! 2025</b>.</span>"
)
autor <- glue("<span style='color:{c1};'>**Víctor Gauto**</span>")
icon_twitter <- glue("<span style='font-family:jet;'></span>")
icon_instagram <- glue("<span style='font-family:jet;'></span>")
icon_github <- glue("<span style='font-family:jet;'></span>")
icon_mastodon <- glue("<span style='font-family:jet;'>󰫑</span>")
icon_bsky <- glue("<span style='font-family:jet;'></span>")
usuario <- glue("<span style='color:{c1};'>**vhgauto**</span>")
sep <- glue("**|**")
mi_caption <- glue(
"{fuente}<br>{autor} {sep} {icon_github} {icon_twitter} {icon_instagram} ",
"{icon_mastodon} {icon_bsky} {usuario}"
)tuesdata <- tidytuesdayR::tt_load(2025, 17)
user2025 <- tuesdata$user2025Me interesan los temas principales (keywords) más frecuentes entre todas las conferencias.
Agrego a cada keywords un ícono obtenido de Iconify
d <- user2025 |>
separate_longer_delim(
cols = keywords,
delim = ", "
) |>
mutate(
keywords = if_else(
keywords == "data visualisation",
"data visualization",
keywords
)
) |>
count(keywords, sort = TRUE) |>
slice_max(order_by = n, n = 20, with_ties = FALSE) |>
mutate(
y = -row_number()
) |>
mutate(
icon = case_match(
keywords,
"shiny" ~ "fa6-brands:r-project",
"workflow" ~ "mdi:workflow",
"ai" ~ "healthicons:artificial-intelligence",
"automation" ~ "arcticons:automation",
"machine learning" ~ "carbon:machine-learning",
"data visualization" ~ "carbon:qq-plot",
"quarto" ~ "simple-icons:quarto",
"r package" ~ "fa6-brands:r-project",
"causal inference" ~ "ix:logic-diagram",
"data science" ~ "material-symbols:chart-data",
"reproducibility" ~ "pepicons-pop:repeat-circle-filled",
"api" ~ "material-symbols:api",
"big data" ~ "eos-icons:big-data",
"community" ~ "fluent:people-community-28-filled",
"clinical trials" ~ "healthicons:clinical-f-24px",
"consulting" ~ "mdi:dialogue",
"docker" ~ "simple-icons:docker",
"duckdb" ~ "devicon-plain:duckdb",
"healthcare" ~ "streamline:medical-cross-sign-healthcare-solid",
"ide" ~ "ant-design:code-filled"
)
) |>
separate_wider_delim(
cols = icon, delim = ":", names = c("prefix", "name")
) |>
mutate(
svg = paste0(
"https://api.iconify.design/", prefix, "/", name, ".svg"
)
) |>
mutate(
label = paste0(" ", keywords)
) |>
mutate(
tamaño = seq(15, 7, length.out = 20)
) |>
mutate(
x = seq(0, 1, length.out = 20)
)Creo un estilo personalizado, con fuente y color.
label_style <- modify_style(
  classic_style(),
  "body",
  family = "JetBrains Mono",
  color = c4
)
Subtítulo y figura.
mi_subtitulo <- glue(
  "En el evento <b style='color: {c3}'>useR! 2025</b> hay planificadas
  {nrow(user2025)} conferencias.<br>
  Se muetran algunas de las palabras clave más frecuentes."
)

g <- ggplot(d, aes(x, y, label = label, size = tamaño)) +
  geom_marquee(style = label_style, hjust = 0) +
  scale_size_identity() +
  coord_cartesian(xlim = c(-2, 10), ylim = c(-19, -2), clip = "off") +
  labs(
    subtitle = mi_subtitulo,
    caption = mi_caption
  ) +
  theme_void() +
  theme(
    plot.background = element_rect(fill = c2, color = NA),
    plot.subtitle = element_markdown(
      family = "ubuntu", color = c1, size = 27, lineheight = 1.3, hjust = 0,
      margin = margin(b = 40, t = 10, l = 10)
    ),
    plot.caption = element_markdown(
      family = "ubuntu", color = c3, size = 13, margin = margin(b = 10, r = 10),
      lineheight = 1.3
    )
  )
Guardo.
ggsave(
  plot = g,
  filename = "tidytuesday/2025/semana_17.png",
  width = 30,
  height = 36,
  units = "cm"
)