Ocultar código
library(glue)
library(ggtext)
library(showtext)
library(ggh4x)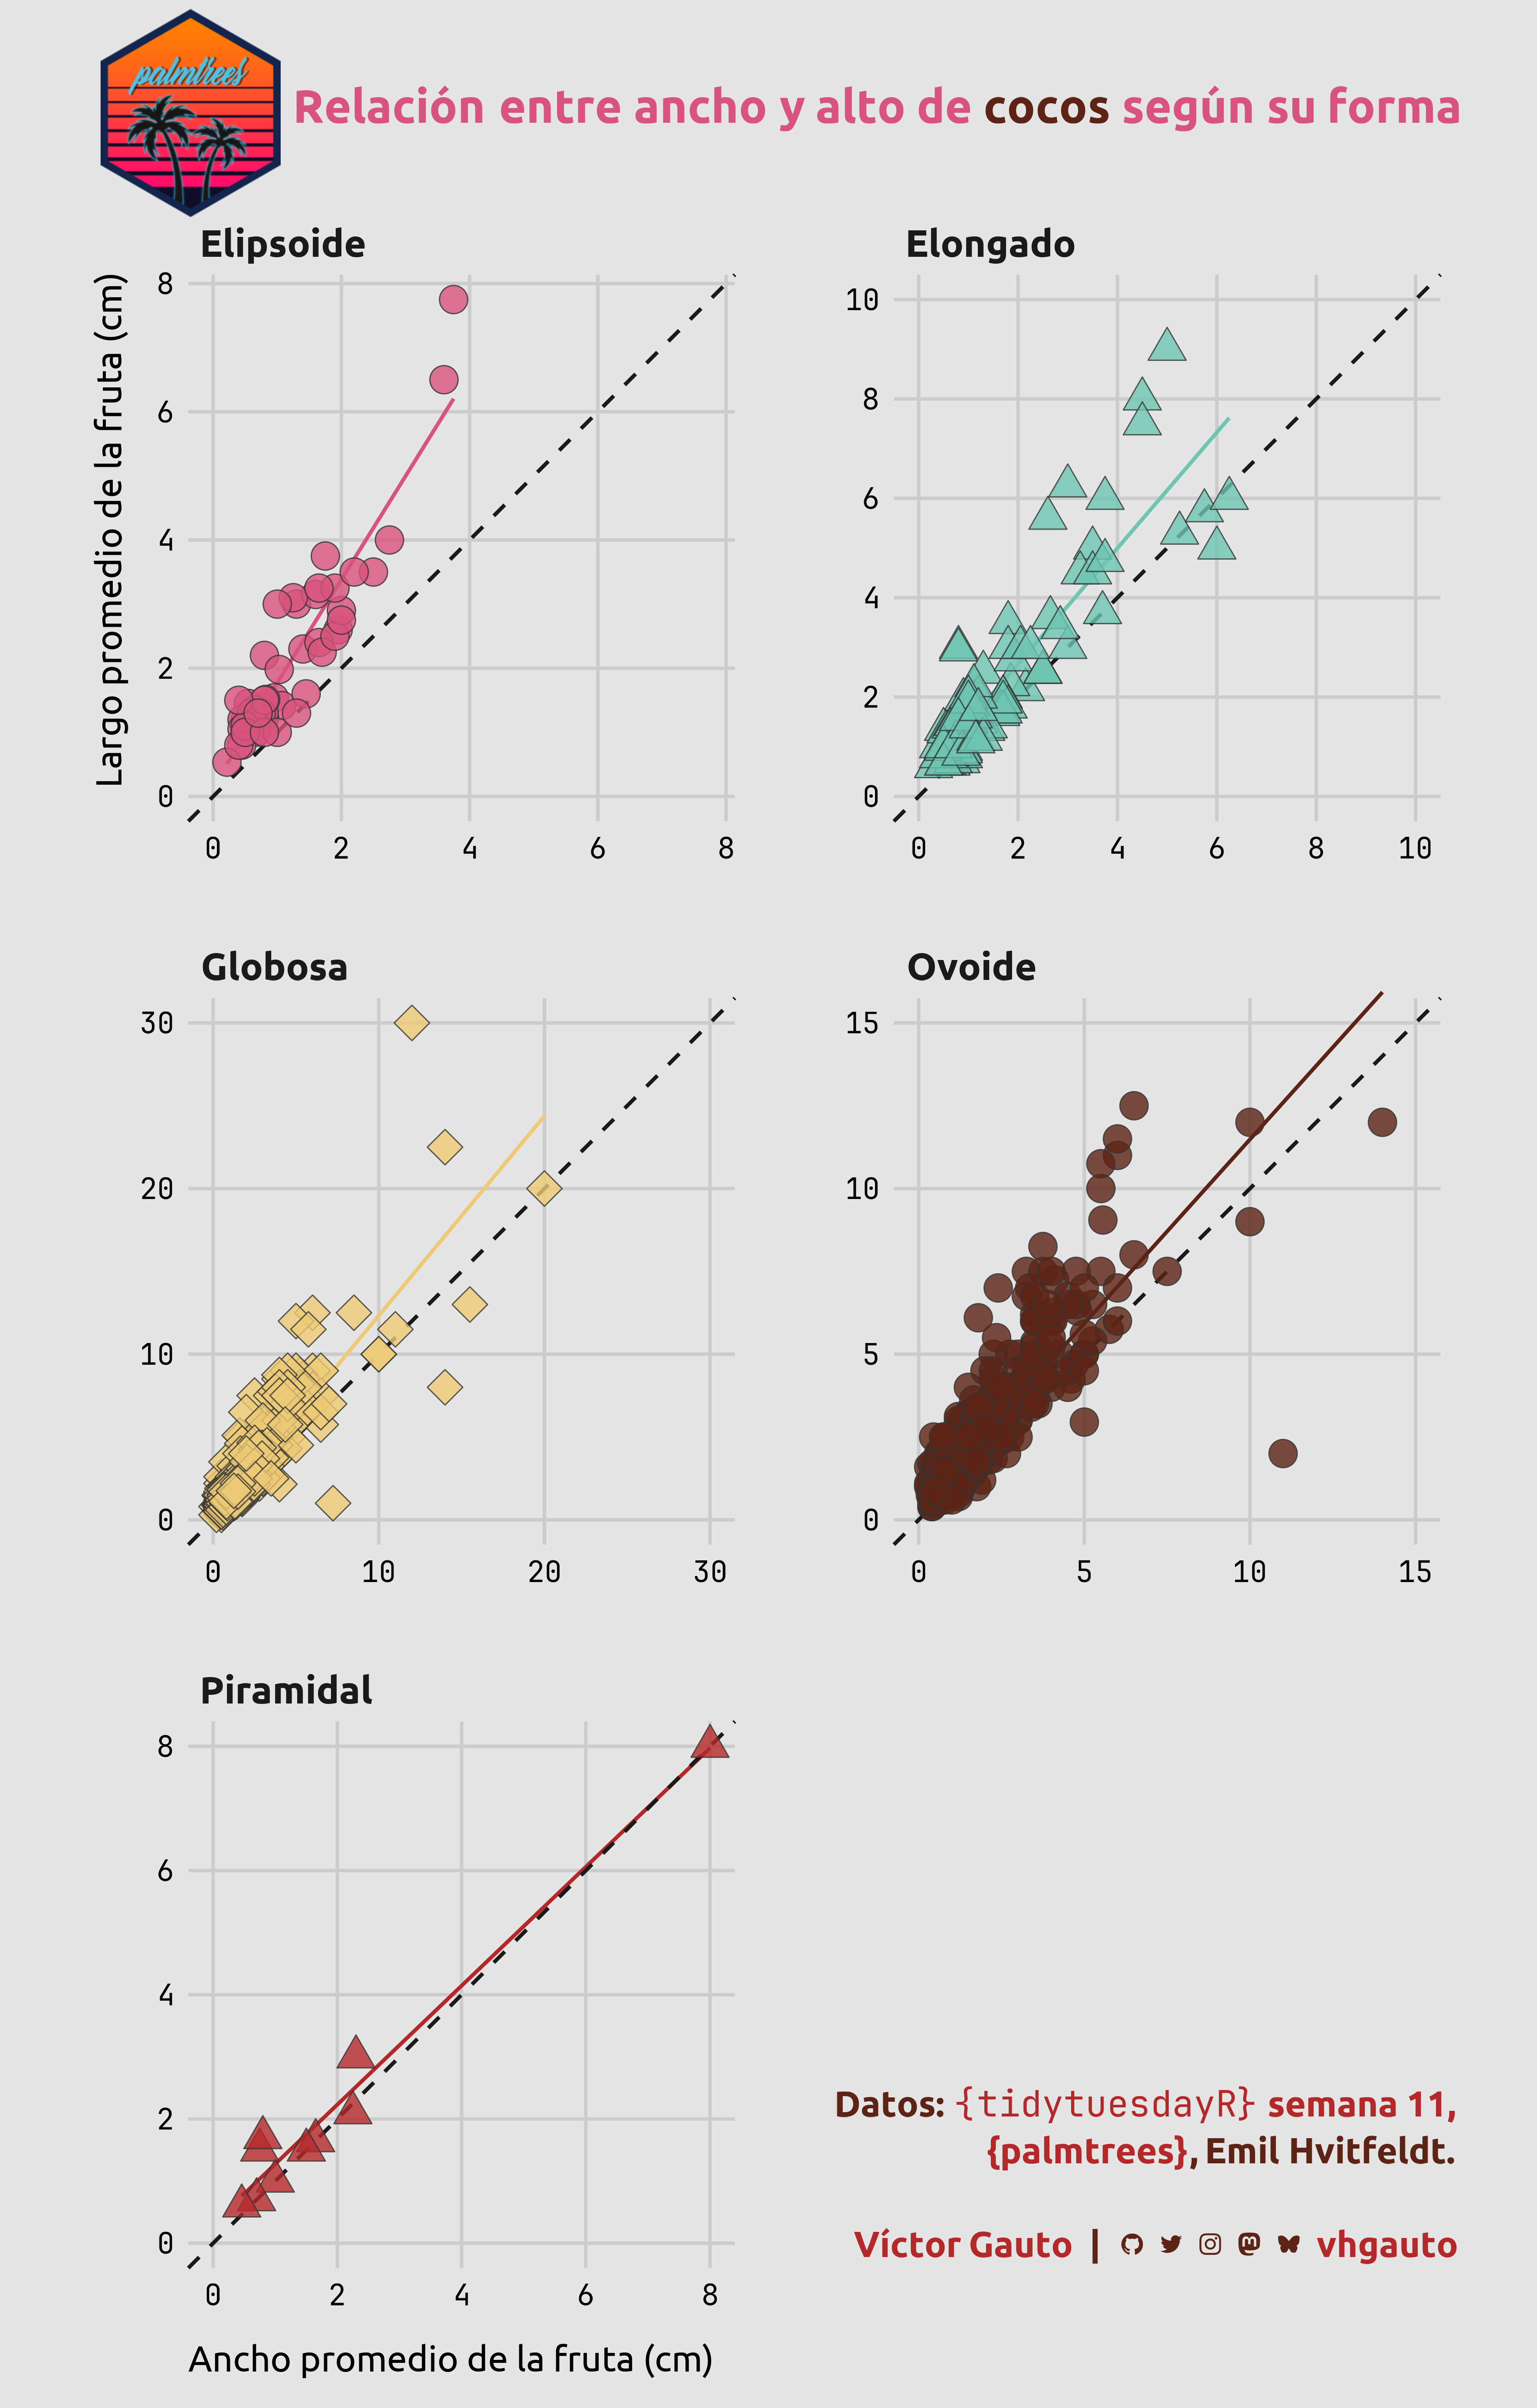
library(tidyverse)Relación entre el ancho y el alto de cocos, según su forma.
library(glue)
library(ggtext)
library(showtext)
library(ggh4x)
library(tidyverse)Colores.
col <- MoMAColors::moma.colors(palette_name = "Koons")Fuentes: Ubuntu y JetBrains Mono.
font_add(
  family = "ubuntu",
  regular = "././fuente/Ubuntu-Regular.ttf",
  bold = "././fuente/Ubuntu-Bold.ttf",
  italic = "././fuente/Ubuntu-Italic.ttf"
)

font_add(
  family = "jet",
  regular = "././fuente/JetBrainsMonoNLNerdFontMono-Regular.ttf"
)

showtext_auto()
showtext_opts(dpi = 300)fuente <- glue(
"Datos: <span style='color:{col[5]};'><span style='font-family:jet;'>",
"{{<b>tidytuesdayR</b>}}</span> semana 11,<br>",
"<b>{{palmtrees}}</b></span>, Emil Hvitfeldt."
)
autor <- glue("<span style='color:{col[5]};'>**Víctor Gauto**</span>")
icon_twitter <- glue("<span style='font-family:jet;'></span>")
icon_instagram <- glue("<span style='font-family:jet;'></span>")
icon_github <- glue("<span style='font-family:jet;'></span>")
icon_mastodon <- glue("<span style='font-family:jet;'>󰫑</span>")
icon_bsky <- glue("<span style='font-family:jet;'></span>")
usuario <- glue("<span style='color:{col[5]};'>**vhgauto**</span>")
sep <- glue("**|**")
mi_caption <- glue(
"{fuente}<br><br>{autor} {sep} {icon_github} {icon_twitter} {icon_instagram} ",
"{icon_mastodon} {icon_bsky} {usuario}"
)tuesdata <- tidytuesdayR::tt_load(2025, 11)
palmtrees <- tuesdata$palmtreesMe interesa la relación entre el ancho y el largo de los cocos según su forma.
Remuevo formas con poca cantidad de datos y obtengo el máximo valor entre largo y ancho.
d <- palmtrees |>
  drop_na(average_fruit_width_cm, average_fruit_length_cm, fruit_shape) |>
  filter(!fruit_shape %in% c("rounded", "fusiform"))

d_max <- d |>
  reframe(
    largo = max(average_fruit_length_cm),
    ancho = max(average_fruit_width_cm),
    .by = fruit_shape
  ) |>
  mutate(l = if_else(largo > ancho, largo, ancho)) |>
  arrange(fruit_shape) |>
  pull(l)
Modifico los límites convenientemente y genero los ejes (vertical y horizontal) de los paneles.
d_max[2] <- 10
d_max[4] <- 15

eje_y <- list(
  scale_y_continuous(
    limits = c(0, d_max[1])
  ),
  scale_y_continuous(
    limits = c(0, d_max[2]),
    breaks = seq(0, d_max[2], 2)
  ),
  scale_y_continuous(
    limits = c(0, d_max[3])
  ),
  scale_y_continuous(
    limits = c(0, d_max[4])
  ),
  scale_y_continuous(
    limits = c(0, d_max[5])
  )
)

eje_x <- list(
  scale_x_continuous(
    limits = c(0, d_max[1])
  ),
  scale_x_continuous(
    limits = c(0, d_max[2]),
    breaks = seq(0, d_max[2], 2)
  ),
  scale_x_continuous(
    limits = c(0, d_max[3])
  ),
  scale_x_continuous(
    limits = c(0, d_max[4])
  ),
  scale_x_continuous(
    limits = c(0, d_max[5])
  )
)
Agrego las traducciones de las formas
formas <- sort(unique(d$fruit_shape))
formas_trad <- c("Elipsoide", "Elongado", "Globosa", "Ovoide", "Piramidal")
formas_trad <- set_names(formas_trad, formas)Logo del paquete {palmtrees} y título.
link <- "https://raw.githubusercontent.com/EmilHvitfeldt/palmtrees/refs/heads/main/man/figures/logo.png"
logo <- glue("<img src='{link}' width=100 />")

mi_titulo <- glue(
  "Relación entre ancho y alto de <b style='color: {col[4]}'>cocos</b> según
  su forma"
)
Figura.
g <- ggplot(
  d, aes(
    average_fruit_width_cm, average_fruit_length_cm, fill = fruit_shape,
    shape = fruit_shape, color = fruit_shape
  )
) +
  geom_smooth(method = "lm", se = FALSE, formula = y ~ x) +
  geom_abline(linetype = 2, color = "grey10", linewidth = 1) +
  geom_point(size = 7, color = "grey20", alpha = .8) +
  facet_wrap(
    vars(fruit_shape), nrow = 3, scales = "free", labeller = as_labeller(formas_trad)
  ) +
  facetted_pos_scales(x = eje_x, y = eje_y) +
  scale_color_manual(
    breaks = formas,
    labels = formas_trad,
    values = col
  ) +
  scale_fill_manual(
    breaks = formas,
    labels = formas_trad,
    values = col
  ) +
  scale_shape_manual(
    breaks = formas,
    labels = formas_trad,
    values = c(21, 24, 23, 21, 24, 23, 21)
  ) +
  coord_cartesian(clip = "off") +
  labs(
    title = mi_titulo,
    tag = logo,
    caption = mi_caption,
    x = "Ancho promedio de la fruta (cm)",
    y = "Largo promedio de la fruta (cm)"
  ) +
  theme_minimal(base_size = 20, base_family = "ubuntu") +
  theme(
    text = element_text(family = "ubuntu"),
    aspect.ratio = 1,
    plot.margin = margin(t = 50),
    plot.background = element_rect(fill = "grey90", color = NA),
    plot.title = element_markdown(
      margin = margin(l = 60, b = 45), hjust = 0, color = col[1], face = "bold",
      lineheight = 1.3, size = 26
    ),
    plot.tag = element_markdown(),
    plot.tag.location = "plot",
    plot.tag.position = c(.07, .99),
    plot.caption = element_markdown(
      color = col[4], face = "bold", lineheight = 1.3, size = 20,
      margin = margin(t = -160, b = 80, r = -10)
    ),
    legend.position = "none",
    panel.grid.major = element_line(color = "grey80"),
    panel.grid.minor = element_blank(),
    panel.spacing.y = unit(40, "pt"),
    panel.spacing.x = unit(60, "pt"),
    axis.text = element_text(family = "jet", color = "black"),
    axis.title.y = element_text(hjust = 1),
    axis.title.x = element_text(hjust = 0, margin = margin(t = 20)),
    strip.text = element_text(face = "bold", hjust = 0, size = 21)
  )
Guardo.
ggsave(
  plot = g,
  filename = "tidytuesday/2025/semana_11.png",
  width = 30,
  height = 47,
  units = "cm"
)