# paquetes ----------------------------------------------------------------
library(tidyverse)
library(glue)
library(ggtext)
library(showtext)
# fuentes -----------------------------------------------------------------
# colores, Java
c1 <- "#C5DAF6"
c2 <- "#A1C2ED"
c3 <- "#6996E3"
c4 <- "#4060C8"
c5 <- "#1A318B"
# texto gral
font_add_google(name = "Ubuntu", family = "ubuntu")
# números, eje horizontal
font_add_google(name = "Victor Mono", family = "victor", db_cache = FALSE)
# título
font_add_google(name = "Waterfall", family = "waterfall", db_cache = FALSE)
# íconos
font_add("fa-brands", "icon/Font Awesome 6 Brands-Regular-400.otf")
font_add("fa-solids", "icon/Font Awesome 6 Free-Solid-900.otf")
showtext_auto()
showtext_opts(dpi = 300)
# caption
fuente <- glue("Datos: <span style='color:{c3};'><span style='font-family:mono;'>{{<b>tidytuesdayR</b>}}</span> semana 30. **A Treatise on the Scurvy in Three Parts**. James Lind</span>")
autor <- glue("Autor: <span style='color:{c3};'>**Víctor Gauto**</span>")
icon_twitter <- glue("<span style='font-family:fa-brands;'></span>")
icon_github <- glue("<span style='font-family:fa-brands;'></span>")
usuario <- glue("<span style='color:{c3};'>**vhgauto**</span>")
sep <- glue("**|**")
mi_caption <- glue("{fuente}<br>{autor} {sep} {icon_github} {icon_twitter} {usuario}")
# datos -------------------------------------------------------------------
browseURL("https://github.com/rfordatascience/tidytuesday/blob/master/data/2023/2023-07-25/readme.md")
scurvy <- readr::read_csv('https://raw.githubusercontent.com/rfordatascience/tidytuesday/master/data/2023/2023-07-25/scurvy.csv')
# traducción de los tratamientos
trad <- c(
cider = "cidra", dilute_sulfuric_acid = "ácido diluido",
vinegar = "vinagre", sea_water = "agua de mar", citrus = "cítrico",
purgative_mixture = "purgante")
# me interesan los valores del estado de salud (0 a 3) por cada síntoma
# ordenados por id de los pacientes
d <- scurvy |>
# renombro las columnas por comodidad
rename(
trat = treatment, dosis = dosing_regimen_for_scurvy,
"daño en las encías" = gum_rot_d6,
"llagas en la piel" = skin_sores_d6,
"dolor de rodilla" = weakness_of_the_knees_d6,
cansancio = lassitude_d6, apto = fit_for_duty_d6, id = study_id) |>
# extraigo los números de la escala de estado de salud
mutate(across(.cols = "daño en las encías":apto, .fns = parse_number)) |>
select(-dosis) |>
# tabla larga con los síntomas
pivot_longer(
cols = "daño en las encías":apto,
names_to = "carac",
values_to = "valor") |>
filter(carac != "apto") |>
arrange(id) |>
# traduzco, agrego mayúsculas y convierto a factor
mutate(trat_trad = trad[trat]) |>
mutate(trat_trad = str_to_upper(trat_trad)) |>
mutate(trat_trad = fct_inorder(trat_trad)) |>
# agrego +1 a los valores de la escala de síntomas, para evitar barras = 0
mutate(valor = valor + 1) |>
# agrego '#' y convierto a factor el id de los pacientes
mutate(id_strip = glue("#{id}")) |>
mutate(id_strip = fct_inorder(id_strip)) |>
mutate(carac = str_to_sentence(carac))
# figura ------------------------------------------------------------------
# título y subtítulo
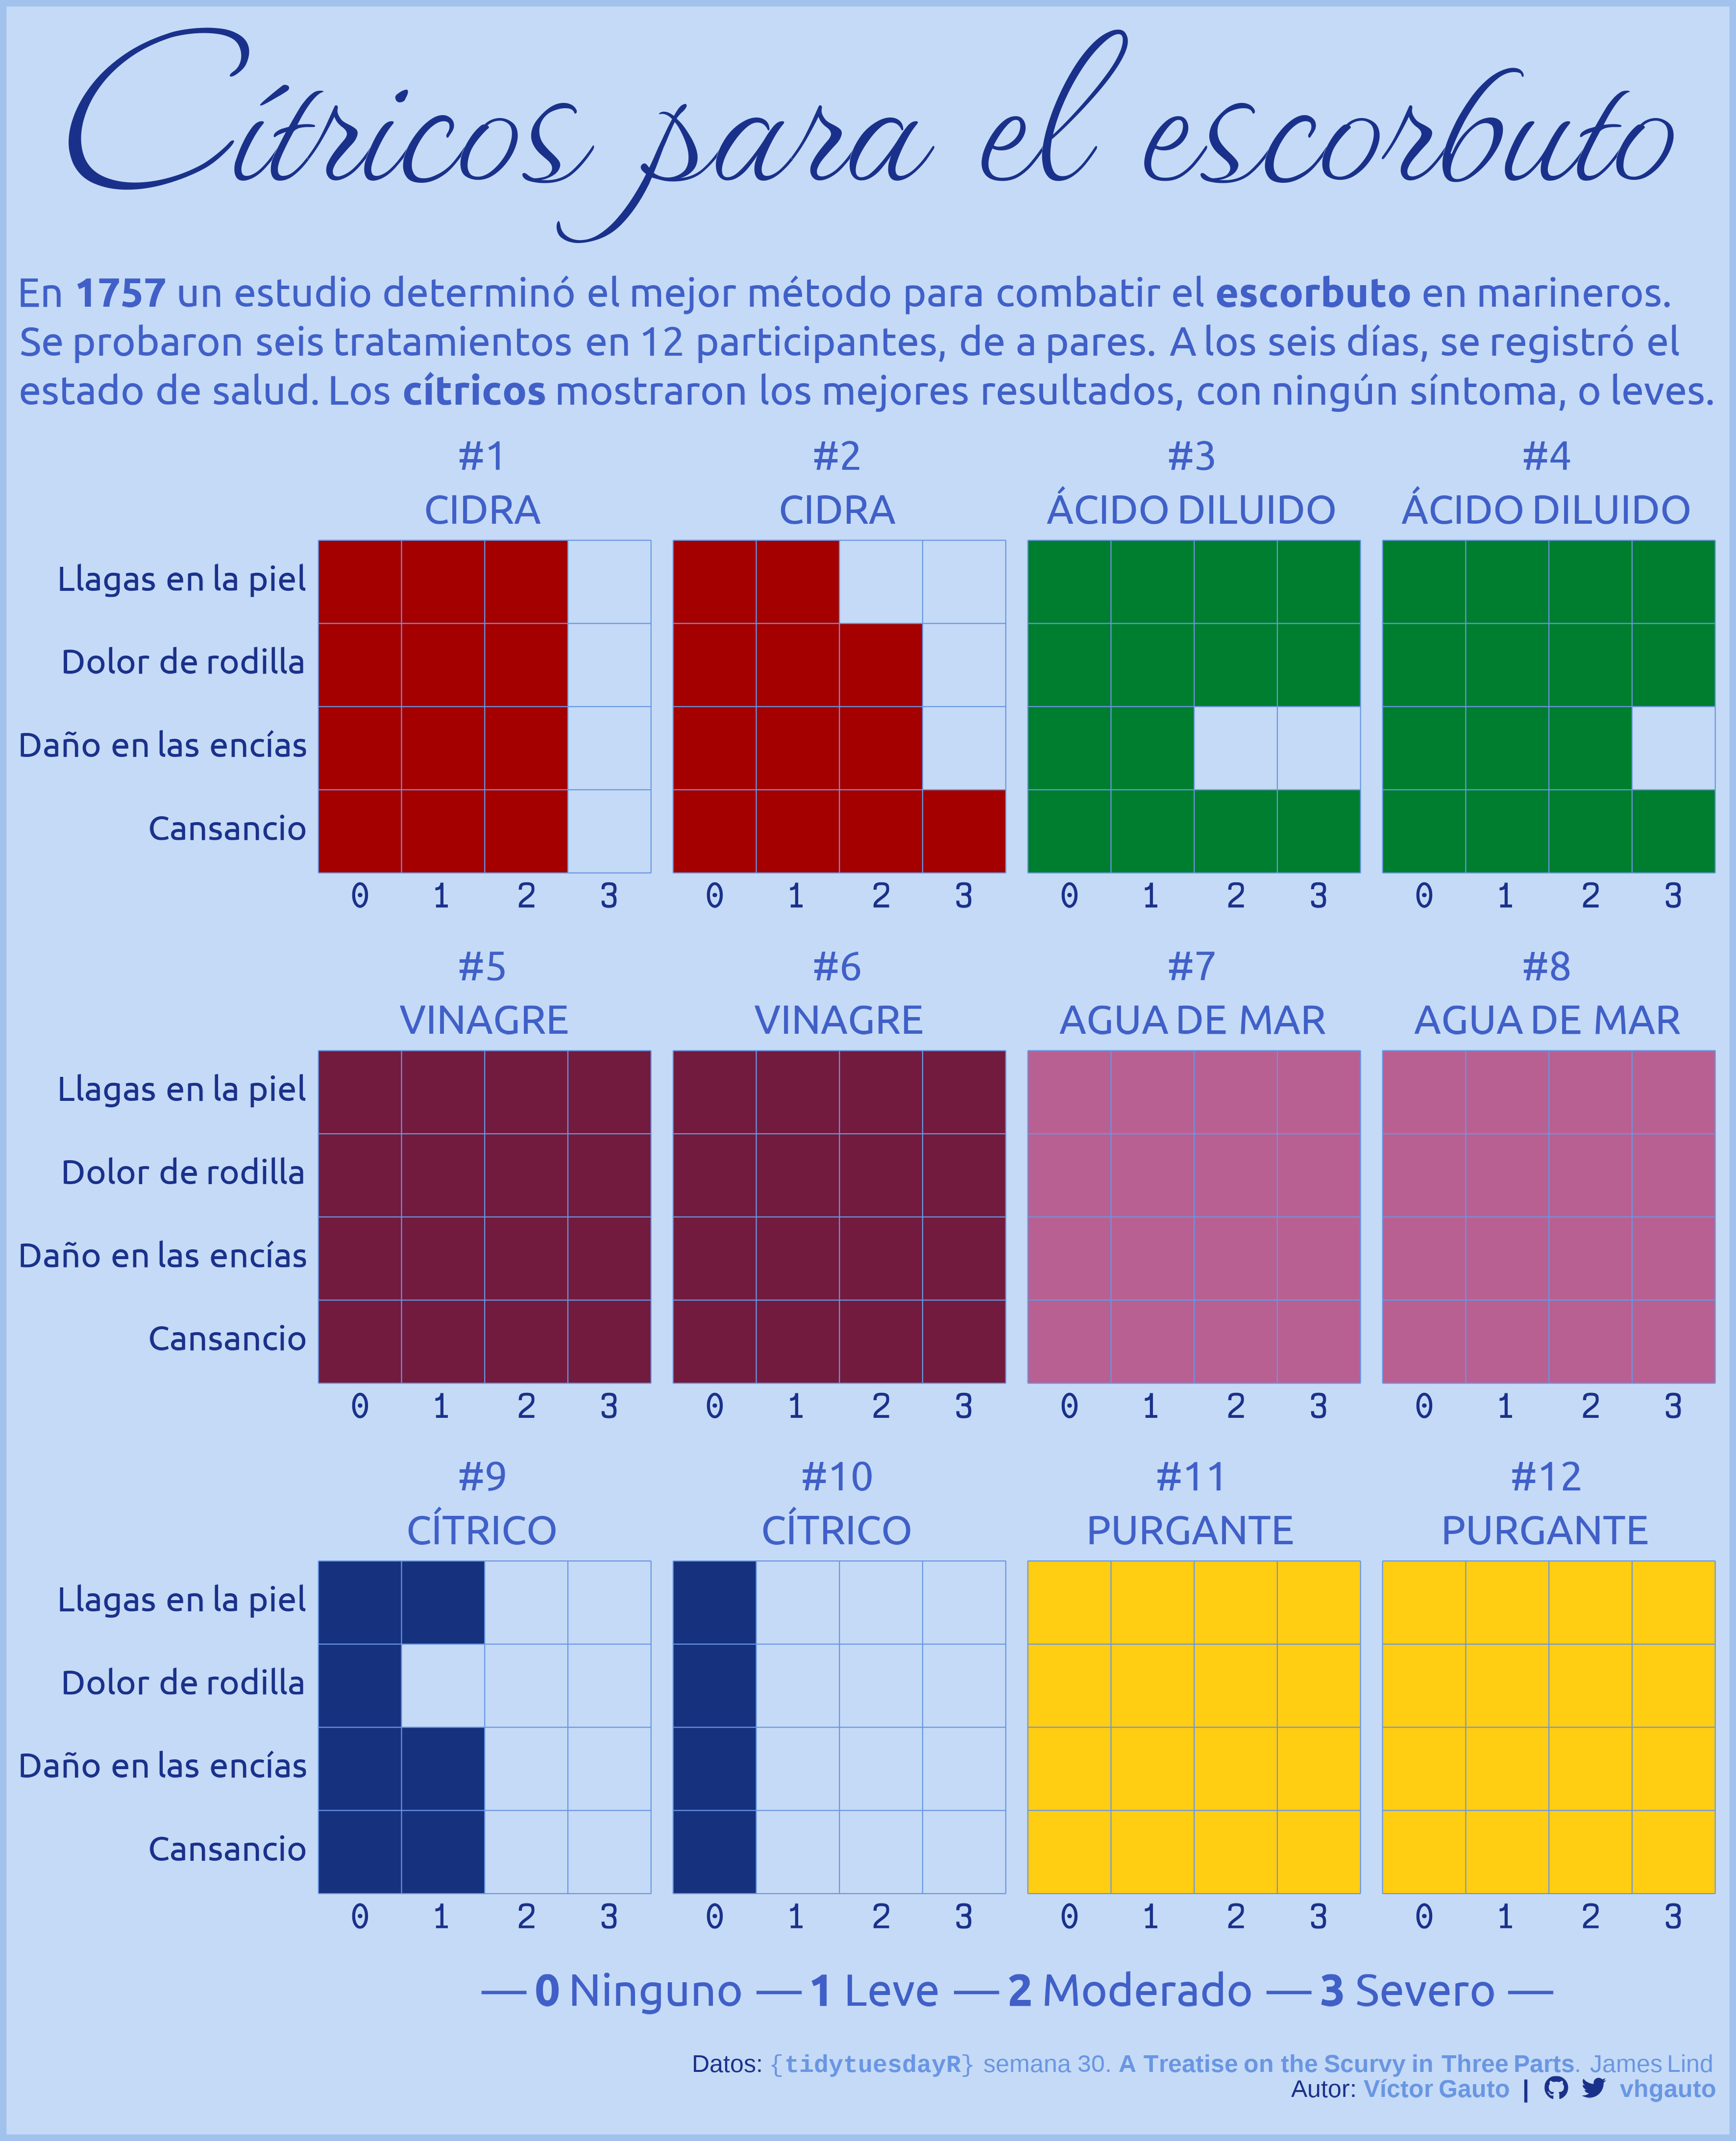
mi_title <- "Cítricos para el escorbuto"
mi_subtitulo <- "En **1757** un estudio determinó el mejor método para combatir
el **escorbuto** en marineros. Se probaron seis tratamientos en 12 participantes,
de a pares. A los seis días, se registró el estado de salud. Los **cítricos**
mostraron los mejores resultados, con ningún síntoma, o leves."
# figura
g <- ggplot(data = d, aes(x = valor, y = carac, fill = trat)) +
geom_col(color = NA, width = 1, show.legend = FALSE) +
geom_vline(xintercept = 0:4, color = c3, linewidth = .25) +
geom_hline(yintercept = .5:4.5, color = c3, linewidth = .25) +
facet_wrap(id_strip ~ trat_trad, scales = "free_x") +
scale_x_continuous(
breaks = 0:4, labels = c("", "0", "1", "2", "3"),
limits = c(0, 4), expand = c(0, 0)) +
scale_y_discrete(expand = c(0, 0)) +
MetBrewer::scale_fill_met_d(name = "Austria") +
labs(
x = "— **0** Ninguno — **1** Leve — **2** Moderado — **3** Severo —",
y = NULL,
title = mi_title,
subtitle = mi_subtitulo,
caption = mi_caption) +
coord_cartesian(clip = "off") +
theme(
aspect.ratio = 1,
plot.margin = margin(14, 10.2, 14, 10.2),
plot.background = element_rect(
fill = c1, color = c2, linewidth = 3),
plot.title.position = "plot",
plot.title = element_text(
size = 130, color = c5, family = "waterfall", hjust = .5, face = "bold"),
plot.subtitle = element_textbox_simple(
size = 20, color = c4, family = "ubuntu", margin = margin(5, -5, 10, 0)),
plot.caption = element_markdown(
color = c5, size = 12, margin = margin(20, 0, 5, 0)),
panel.background = element_rect(fill = NA, color = NA),
panel.grid = element_blank(),
panel.spacing.x = unit(.75, "line"),
panel.spacing.y = unit(1, "line"),
strip.background = element_rect(fill = NA, color = NA),
strip.text = element_markdown(family = "ubuntu", color = c4, size = 20),
axis.title.x = element_markdown(
family = "ubuntu", size = 22, color = c4, margin = margin(20, 0, 0, 0)),
axis.text.x = element_markdown(
family = "victor", color = c5, size = 15, hjust = 2.7, face = "bold"),
axis.text.y = element_markdown(family = "ubuntu", color = c5, size = 17),
axis.ticks = element_blank()
)
# guardo
ggsave(
plot = g,
filename = "2023/semana_30/viz.png",
width = 30,
height = 37,
units = "cm")
# abro
browseURL("2023/semana_30/viz.png")