# paquetes ----------------------------------------------------------------
library(glue)
library(ggtext)
library(showtext)
library(tidyverse)
# fuente ------------------------------------------------------------------
# colores
c1 <- "#312A56"
c2 <- "#11C638"
c3 <- "#95D69A"
c4 <- "#EF9708"
c5 <- "#F0BC95"
c6 <- "#E2E2E2"
# fuente: Ubuntu
font_add(
family = "ubuntu",
regular = "fuente/Ubuntu-Regular.ttf",
bold = "fuente/Ubuntu-Bold.ttf",
italic = "fuente/Ubuntu-Italic.ttf")
# monoespacio & íconos
font_add(
family = "jet",
regular = "fuente/JetBrainsMonoNLNerdFontMono-Regular.ttf")
# bebas
font_add(
family = "bebas",
regular = "fuente/BebasNeue-Regular.ttf"
)
showtext_auto()
showtext_opts(dpi = 300)
# caption
fuente <- glue(
"Datos: <span style='color:{c3};'><span style='font-family:jet;'>",
"{{<b>tidytuesdayR</b>}}</span> semana {21}, ",
"Carbon Majors.</span>")
autor <- glue("<span style='color:{c3};'>**Víctor Gauto**</span>")
icon_twitter <- glue("<span style='font-family:jet;'></span>")
icon_instagram <- glue("<span style='font-family:jet;'></span>")
icon_github <- glue("<span style='font-family:jet;'></span>")
icon_mastodon <- glue("<span style='font-family:jet;'>󰫑</span>")
usuario <- glue("<span style='color:{c3};'>**vhgauto**</span>")
sep <- glue("**|**")
mi_caption <- glue(
"{fuente}<br>{autor} {sep} {icon_github} {icon_twitter} {icon_instagram} ",
"{icon_mastodon} {usuario}")
# datos -------------------------------------------------------------------
tuesdata <- tidytuesdayR::tt_load(2024, 21)
emissions <- tuesdata$emissions
# me interesa la relación entre las emisiones de empresas privadas y estatales
d <- emissions |>
filter(parent_type != "Nation State") |>
reframe(
s = sum(total_emissions_MtCO2e),
.by = c(year, parent_type)
) |>
filter(year >= 1900) |>
rename(
año = year,
tipo = parent_type
)
# año en el que las empresas estatales superan el 50% de las emisiones de CO2
d_50 <- d |>
pivot_wider(
names_from = tipo,
values_from = s
) |>
mutate(
tot = `State-owned Entity` + `Investor-owned Company`
) |>
mutate(
estatal = `State-owned Entity`/tot,
privado = `Investor-owned Company`/tot
) |>
arrange(año) |>
filter(between(estatal, .49, .52))
# figura ------------------------------------------------------------------
# subtítulo y aclaración
mi_subtitle <- glue(
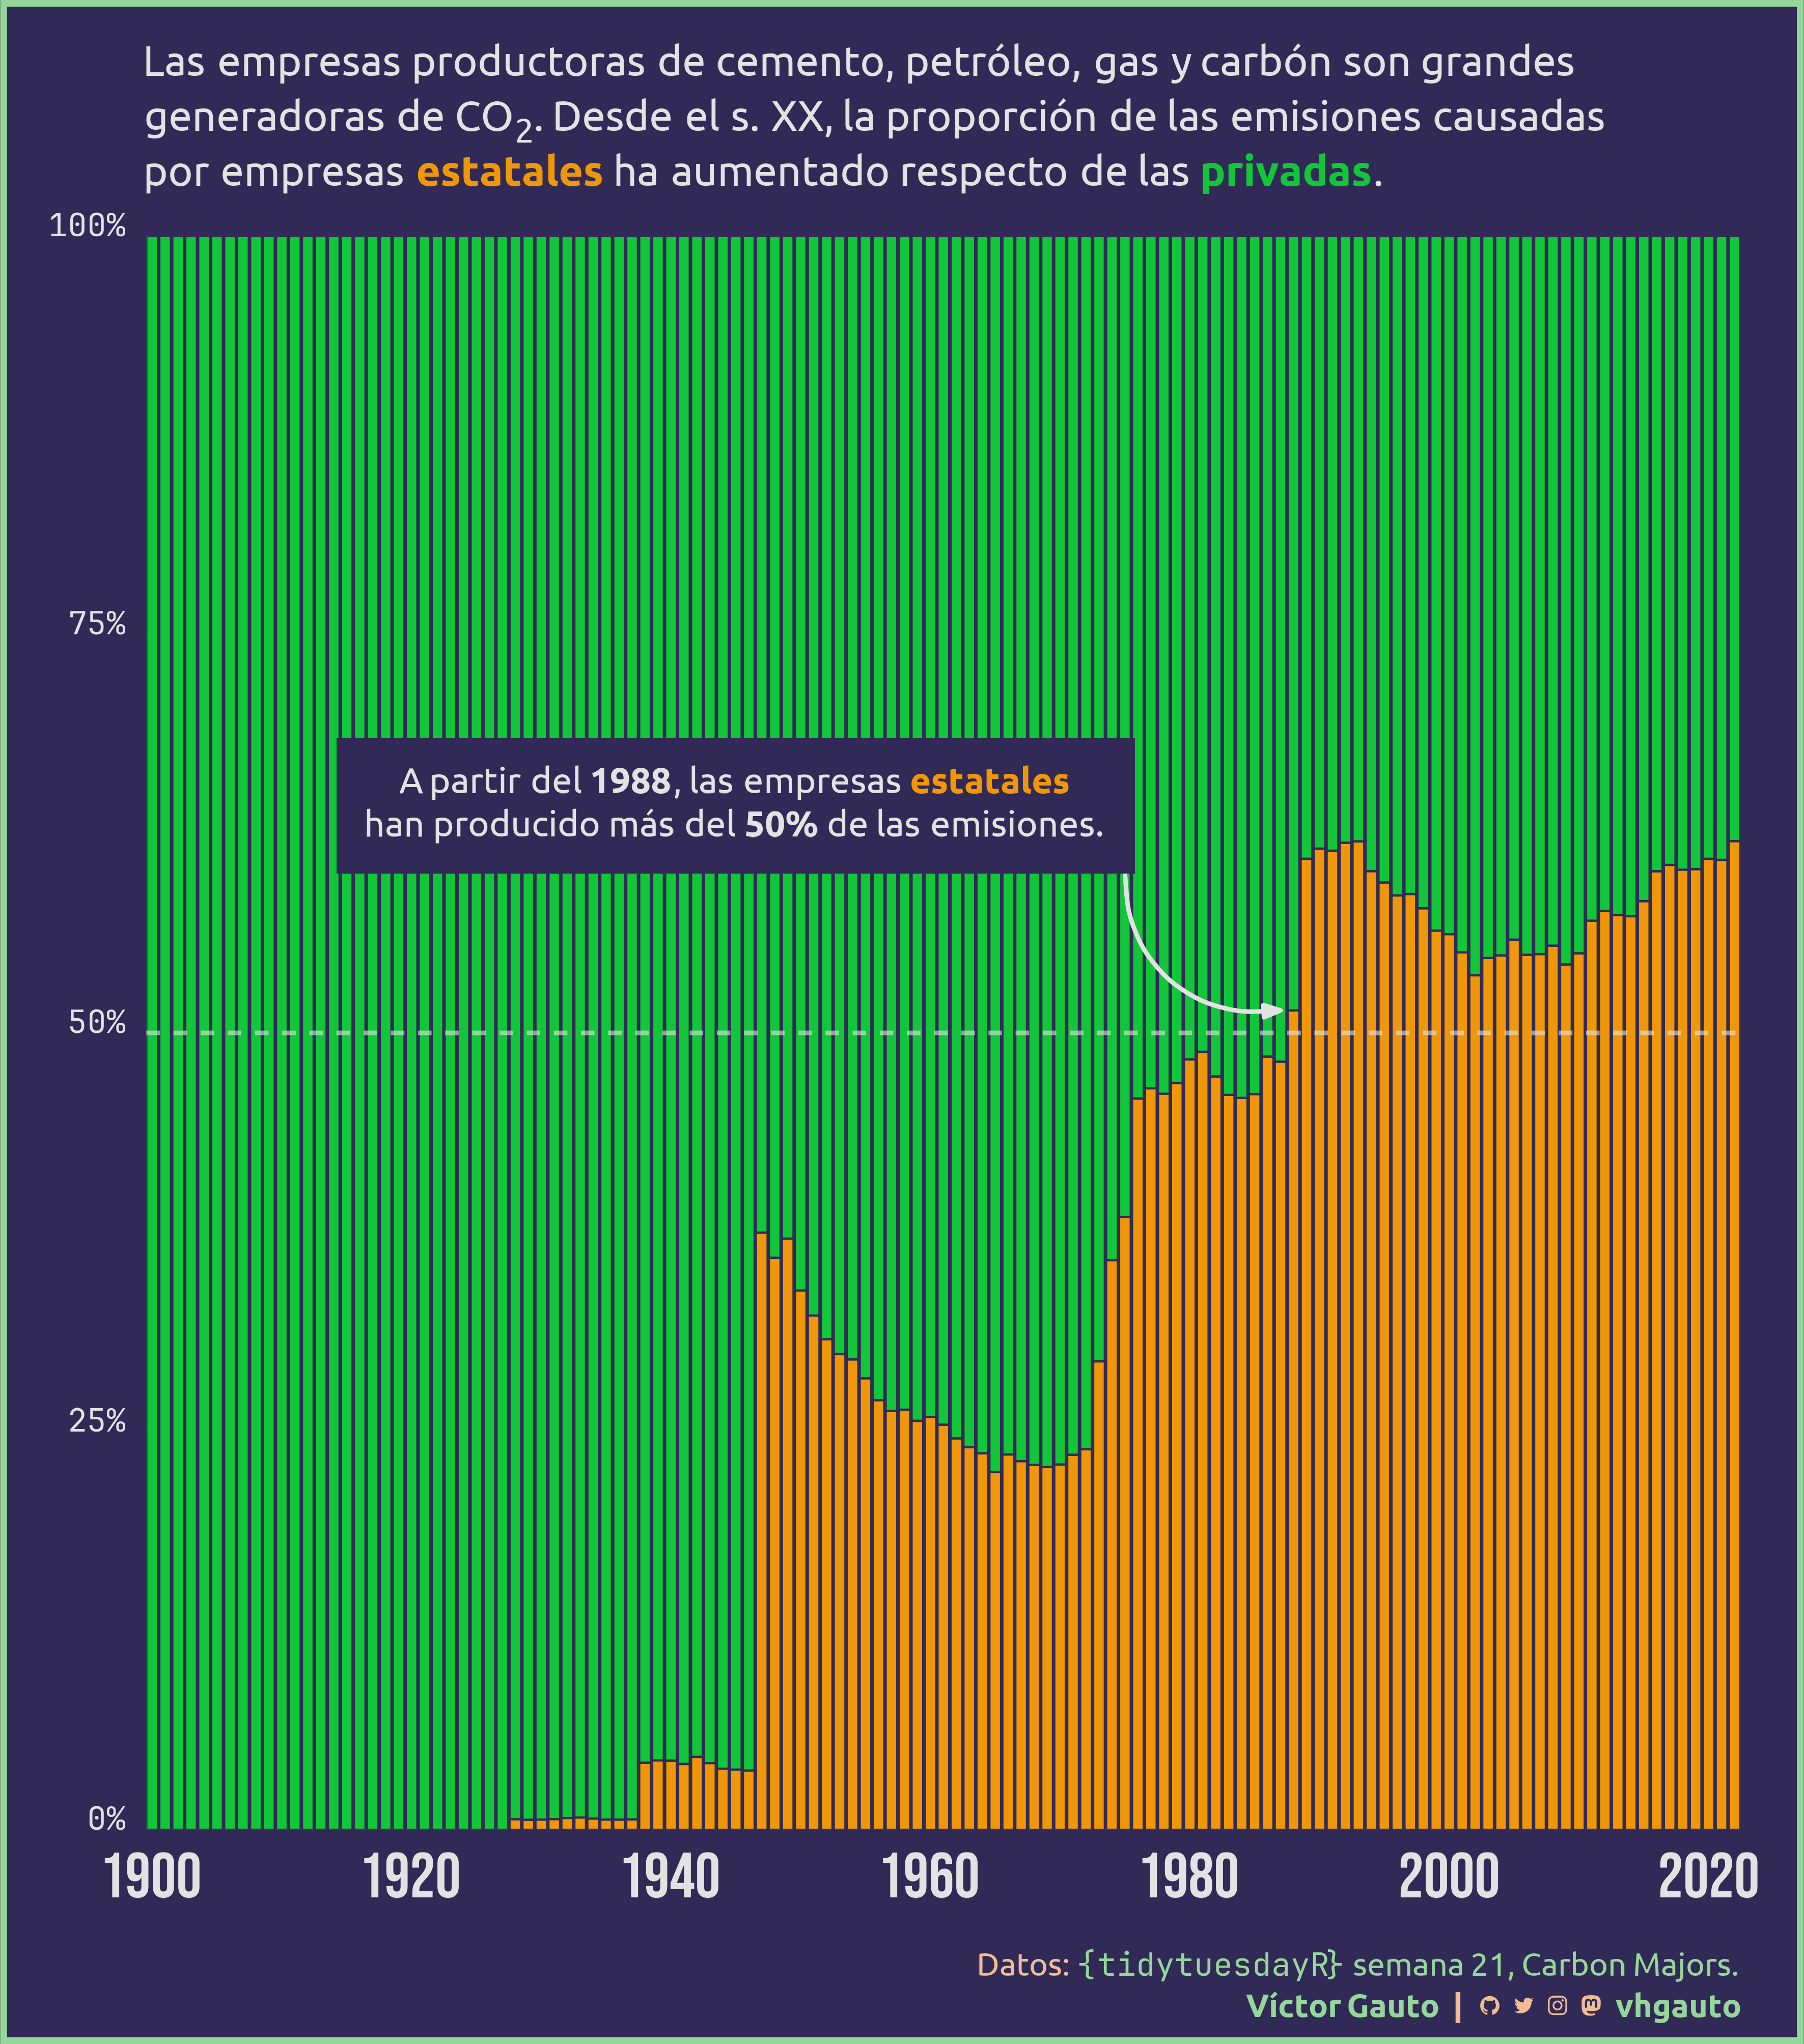
"Las empresas productoras de cemento, petróleo, gas y carbón son grandes<br>",
" generadoras de CO<sub>2</sub>. Desde el s. XX, la proporción de las ",
"emisiones causadas<br>por empresas <b style='color: {c4};'>estatales</b>",
" ha aumentado respecto de las <b style='color: {c2};'>privadas</b>."
)
mi_label <- glue(
"A partir del <b>{d_50$año}</b>, las empresas
<b style='color: {c4};'>estatales</b><br>",
"han producido más del <b>50%</b> de las emisiones."
)
# figura
g <- ggplot(d, aes(año, s, fill = tipo, color = tipo)) +
geom_col(position = position_fill(), linewidth = .5, alpha = 1, color = c1) +
geom_hline(
yintercept = .5, color = c6, linewidth = 1, alpha = .6, linetype = "33") +
annotate(
geom = "richtext", x = 1945, y = .6, hjust = .5, vjust = 0,
color = c6, family = "ubuntu", size = 6, label = mi_label, fill = c1,
label.color = NA, label.r = unit(0, "mm"), label.padding = unit(5, "mm")
) +
annotate(
geom = "curve", x = 1975, y = .6, xend = d_50$año-1, yend = d_50$estatal,
color = c6, linewidth = 1,
arrow = arrow(length = unit(3, "mm"), type = "closed", angle = 20)
) +
scale_x_continuous(
breaks = scales::breaks_width(20)
) +
scale_y_continuous(
breaks = scales::breaks_width(.25),
labels = scales::label_percent()
) +
scale_fill_manual(
values = c(c2, c4)
) +
coord_cartesian(expand = FALSE) +
labs(subtitle = mi_subtitle, caption = mi_caption) +
theme_void() +
theme(
aspect.ratio = 1,
plot.margin = margin(22, 30, 10, 23),
plot.background = element_rect(fill = c1, color = c3, linewidth = 3),
plot.subtitle = element_markdown(
family = "ubuntu", size = 20, margin = margin(b = 20), color = c6,
lineheight = unit(1.3, "line")
),
plot.caption = element_markdown(
family = "ubuntu", color = c5, size = 15, margin = margin(t = 25),
lineheight = unit(1.3, "line")
),
panel.grid.major = element_line(
color = c6, linewidth = .2, linetype = "44"
),
axis.text.x = element_text(
family = "bebas", size = 30, color = c6, margin = margin(t = 10)
),
axis.text.y = element_text(
family = "jet", size = 15, color = c6, margin = margin(r = 10), vjust = 0,
hjust = 1
),
legend.position = "none"
)
# guardo
ggsave(
plot = g,
filename = "2024/s21/viz.png",
width = 30,
height = 34,
units = "cm")
# abro
browseURL("2024/s21/viz.png")