# paquetes ----------------------------------------------------------------
library(glue)
library(ggtext)
library(showtext)
library(tidyverse)
# fuente ------------------------------------------------------------------
# colores
c1 <- "#8C0172"
c2 <- "#121416"
c3 <- "grey95"
c4 <- "grey60"
c5 <- "grey40"
c6 <- "#62E6CD"
# fuente: Ubuntu
font_add(
family = "ubuntu",
regular = "fuente/Ubuntu-Regular.ttf",
bold = "fuente/Ubuntu-Bold.ttf",
italic = "fuente/Ubuntu-Italic.ttf"
)
# monoespacio & íconos
font_add(
family = "jet",
regular = "fuente/JetBrainsMonoNLNerdFontMono-Regular.ttf"
)
showtext_auto()
showtext_opts(dpi = 300)
# caption
fuente <- glue(
"Datos: <span style='color:{c3};'><span style='font-family:jet;'>",
"{{<b>tidytuesdayR</b>}}</span> semana {40}, ",
"<b>lichess.org</b>.</span>"
)
autor <- glue("<span style='color:{c3};'>**Víctor Gauto**</span>")
icon_twitter <- glue("<span style='font-family:jet;'></span>")
icon_instagram <- glue("<span style='font-family:jet;'></span>")
icon_github <- glue("<span style='font-family:jet;'></span>")
icon_mastodon <- glue("<span style='font-family:jet;'>󰫑</span>")
usuario <- glue("<span style='color:{c3};'>**vhgauto**</span>")
sep <- glue("**|**")
mi_caption <- glue(
"{fuente}<br>{autor} {sep} {icon_github} {icon_twitter} {icon_instagram} ",
"{icon_mastodon} {usuario}"
)
# datos -------------------------------------------------------------------
tuesdata <- tidytuesdayR::tt_load(2024, 40)
chess <- tuesdata$chess
# me interesa la duración de las partidas y la cantidad de movimientos
# convierto los tiempos en fechas y calculo la diferencia en horas
d <- chess |>
select(start_time, end_time, turns) |>
mutate(start_time = as.POSIXlt(start_time/1000)) |>
mutate(end_time = as.POSIXlt(end_time/1000)) |>
mutate(dif = end_time - start_time) |>
filter(dif > duration(0)) |>
mutate(dif_h = dif/duration(3600))
# 10000 segundos
h <- duration(1e4)/duration(3600)
h_label <- format(h, decimal.mark = ",", digits = 3)
d2 <- filter(d, dif == duration(1e4))
# figura -----------------------------------------------------------------
# breaks y etiquetas del eje horizontal
x_horas <- c(1e-3, 1e-2, 1e-1, 1e0, 1e1, 1e2)
x_horas_format <- format(
x_horas, decimal.mark = ',', scientific = FALSE, drop0trailing = TRUE,
trim = TRUE)
duration(x_horas*3600)
x_duracion <- c("(3,6s)", "(36s)", "(~6m)", "", "", "(~4d 4h)")
x_label <- glue("{x_horas_format}hn{x_duracion}")
# aclaración y posición
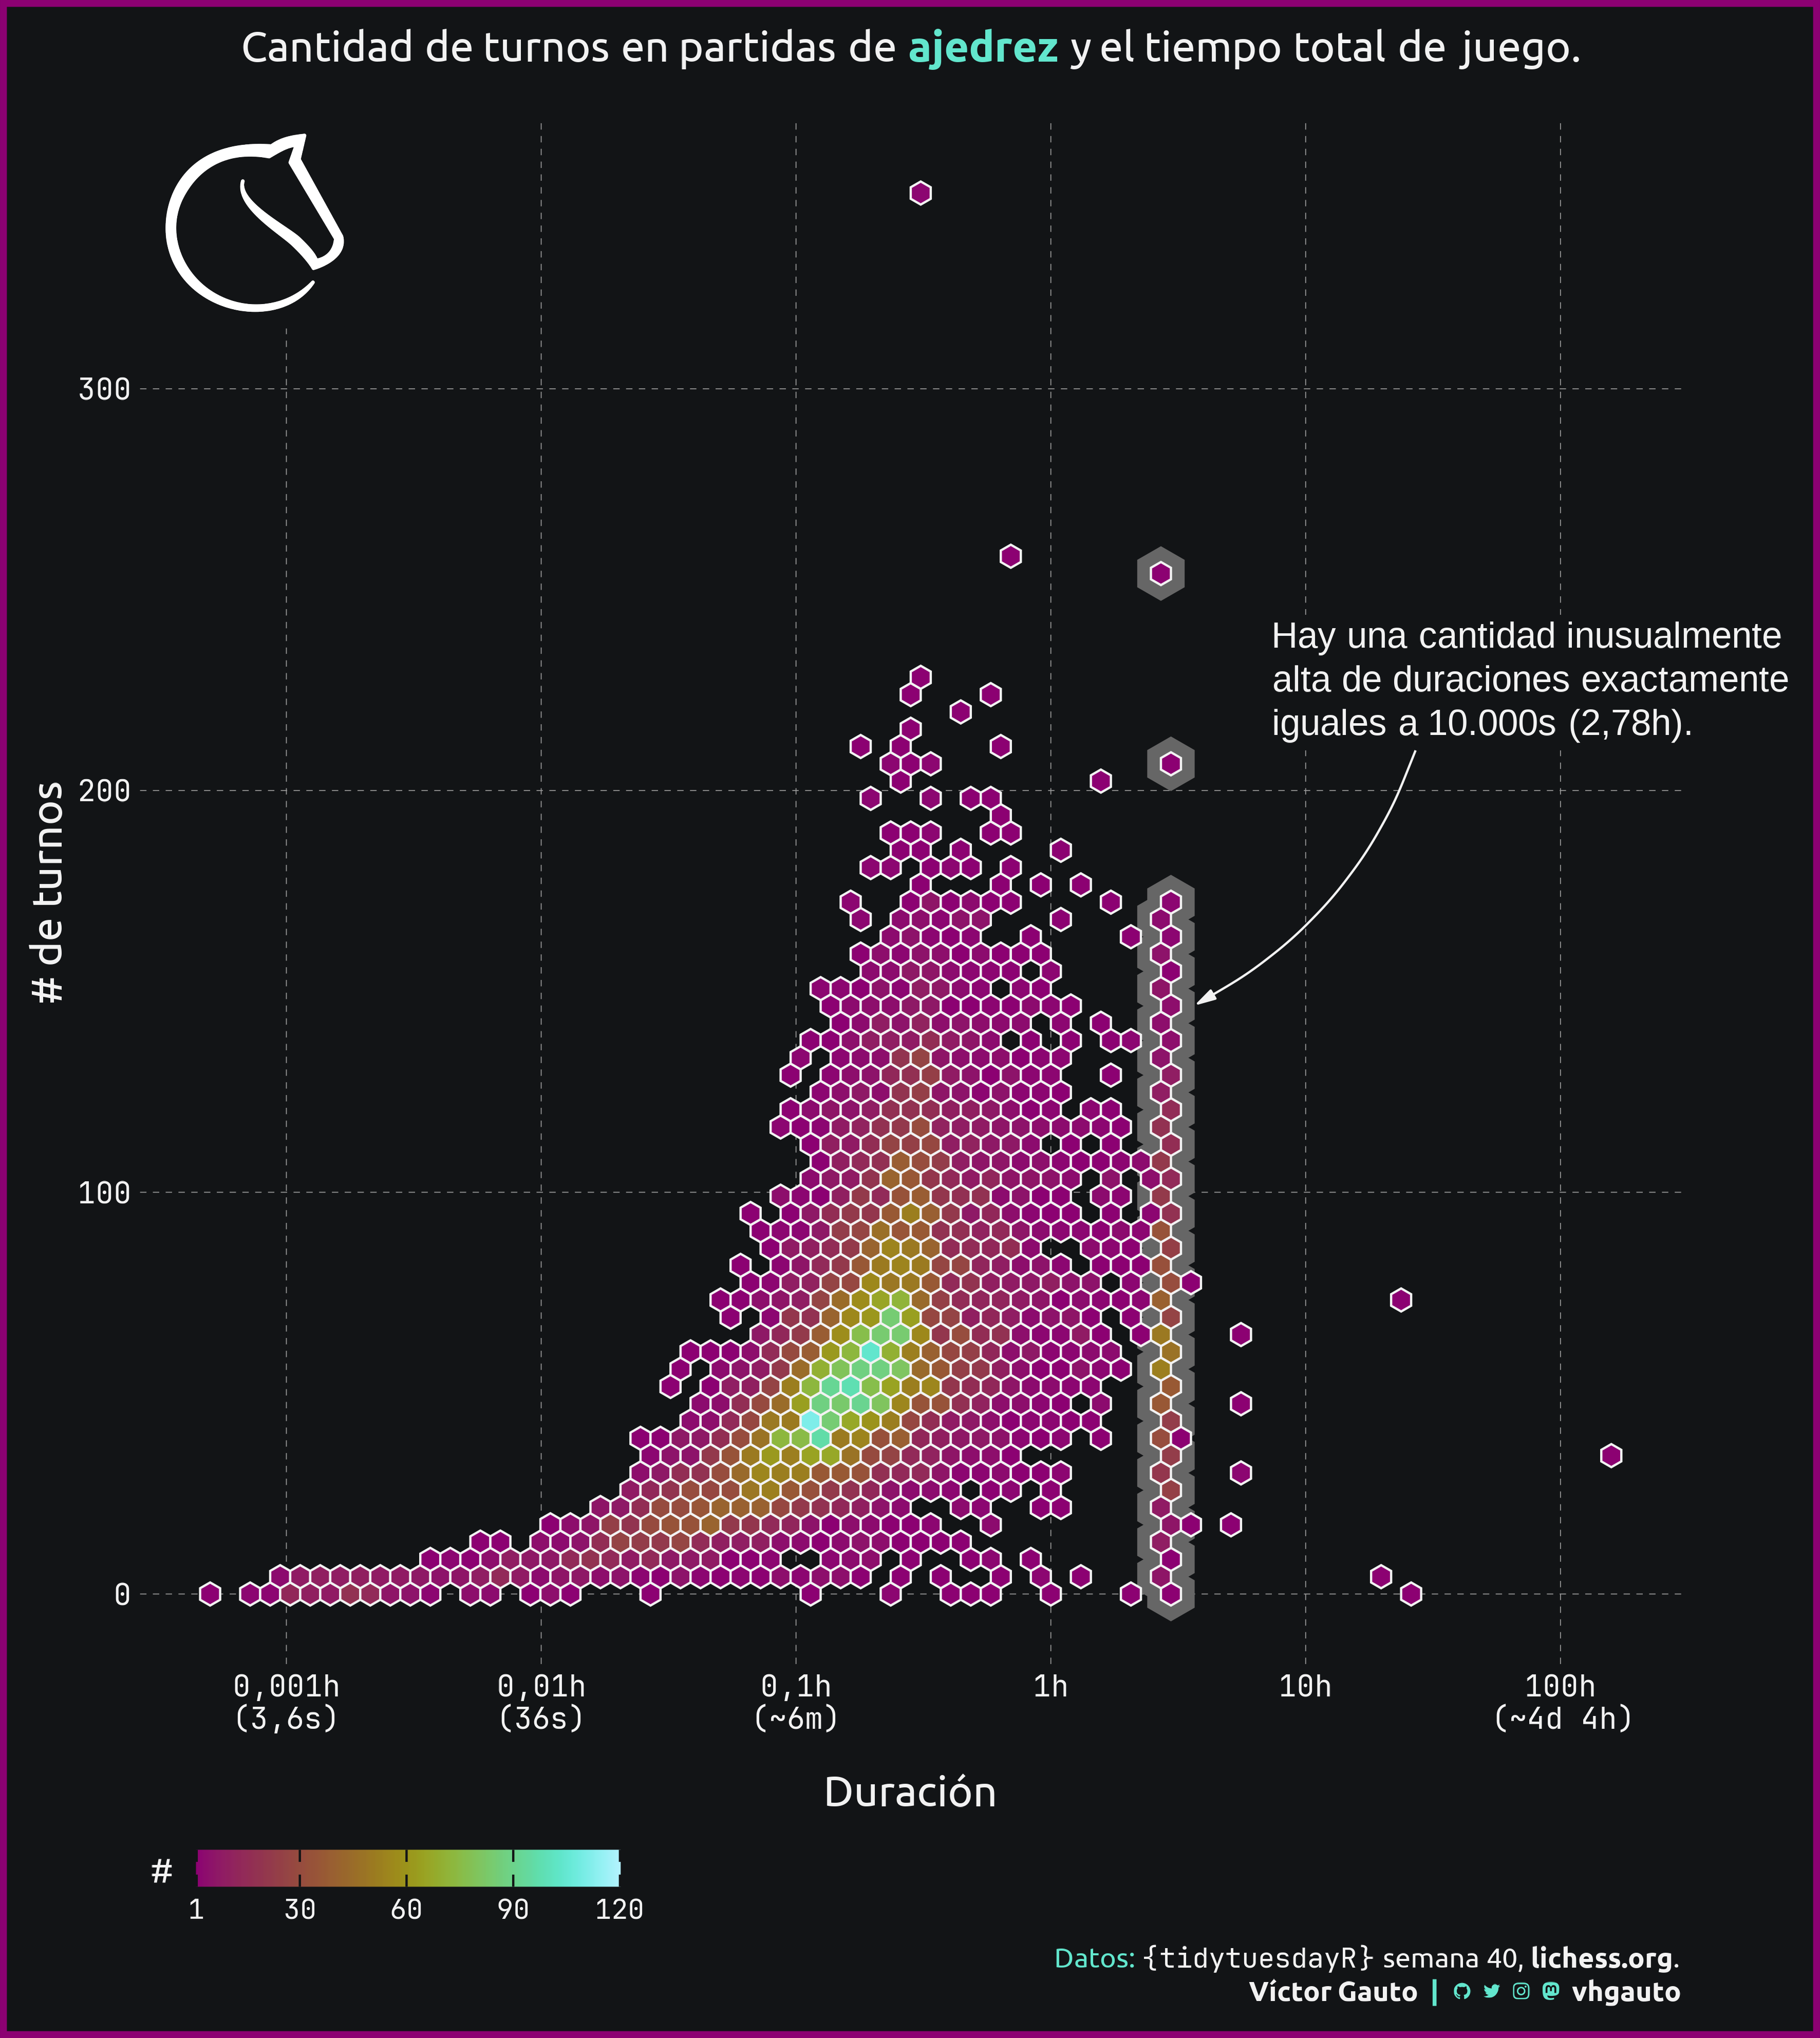
etq_label <- glue(
"Hay una cantidad inusualmente",
"alta de duraciones exactamente",
"iguales a 10.000s ({h_label}h).",
.sep = "<br>"
)
x_esq <- 7
y_esq <- 210
# logo de lichess
link <- "https://raw.githubusercontent.com/lichess-org/lila/refs/heads/master/public/logo/logo-black.png"
logo <- glue("<img src='{link}' width=100 />")
# subtítulo
mi_subtitulo <- glue(
"Cantidad de turnos en partidas de <b style='color:{c6}'>ajedrez</b> ",
"y el tiempo total de juego."
)
# figura
g <- ggplot(d, aes(dif_h, turns)) +
# resalto los 10000s
geom_hex(data = d2, bins = 70, color = c5, linewidth = 6, fill = c2) +
# hex
geom_hex(bins = 70, color = c3, linewidth = .5) +
# logo
annotate(
geom = "richtext", x = I(0), y = I(1.01), label = logo, hjust = 0, vjust = 1,
fill = NA, label.color = NA
) +
# aclaración de los 10000s
annotate(
geom = "richtext", x = x_esq, y = y_esq, label = etq_label, hjust = 0,
vjust = 0, fill = c2, color = c3, size = 6, label.r = unit(0, "mm"),
label.color = NA
) +
# flecha
annotate(
geom = "curve", x = x_esq+20, y = y_esq, xend = h+1, yend = 147,
curvature = -.2, color = c3,
arrow = arrow(angle = 15, length = unit(.3, "cm"), type = "closed"),
) +
scale_x_log10(
breaks = x_horas,
labels = x_label
) +
scico::scale_fill_scico(
palette = "hawaii",
limits = c(1, 120),
breaks = c(1, seq(30, 120, 30))
) +
coord_cartesian(clip = "off") +
labs(
x = "Duración", y = "# de turnos", fill = "#", caption = mi_caption,
subtitle = mi_subtitulo
) +
theme_minimal() +
theme(
aspect.ratio = 1,
plot.margin = margin(b = 15, r = 65, l = 15),
plot.background = element_rect(
fill = c2, color = c1, linewidth = 3
),
plot.subtitle = element_markdown(
family = "ubuntu", color = c3, size = 20, hjust = .5,
margin = margin(b = 25, t = 15)
),
plot.caption = element_markdown(
color = c6, size = 13, family = "ubuntu", lineheight = unit(1.2, "line")
),
panel.background = element_rect(fill = c2, color = NA),
panel.grid.major = element_line(
color = c4, linewidth = .2, linetype = "77"
),
panel.grid.minor = element_blank(),
axis.line = element_blank(),
axis.text = element_text(family = "jet", color = c3, size = 14),
axis.title = element_text(family = "ubuntu", color = c3, size = 20),
axis.title.x = element_text(margin = margin(t = 20)),
legend.background = element_blank(),
legend.position = "bottom",
legend.justification = c(0, 0),
legend.key.width = unit(1.4, "cm"),
legend.ticks = element_line(color = c2),
legend.ticks.length = unit(2, "mm"),
legend.title = element_text(
color = c3, family = "ubuntu", size = 16, margin = margin(b = 15, r = 10)
),
legend.text = element_text(color = c3, family = "jet", size = 13)
)
# guardo
ggsave(
plot = g,
filename = "2024/s40/viz.png",
width = 30,
height = 33.6,
units = "cm")
# abro
browseURL(glue("{getwd()}/2024/s40/viz.png"))