#
# paquetes ----------------------------------------------------------------
library(glue)
library(ggtext)
library(showtext)
library(tidyverse)
# fuente ------------------------------------------------------------------
# colores
c1 <- "#D1A358"
c2 <- "#67B2A9"
c3 <- "#EE2631"
c4 <- "#fff8f9"
c5 <- "grey20"
# fuente: Ubuntu
font_add(
family = "ubuntu",
regular = "fuente/Ubuntu-Regular.ttf",
bold = "fuente/Ubuntu-Bold.ttf",
italic = "fuente/Ubuntu-Italic.ttf"
)
# monoespacio & íconos
font_add(
family = "jet",
regular = "fuente/JetBrainsMonoNLNerdFontMono-Regular.ttf"
)
font_add_google(
name = "Ultra",
family = "ultra"
)
showtext_auto()
showtext_opts(dpi = 300)
# caption
fuente <- glue(
"Datos: <span style='color:{c3};'><span style='font-family:jet;'>",
"{{<b>tidytuesdayR</b>}}</span> semana {47}, ",
"<span style='font-family:jet;'>{{bobsburgersR}}</span>, Steven Ponce.</span>"
)
autor <- glue("<span style='color:{c3};'>**Víctor Gauto**</span>")
icon_twitter <- glue("<span style='font-family:jet;'></span>")
icon_instagram <- glue("<span style='font-family:jet;'></span>")
icon_github <- glue("<span style='font-family:jet;'></span>")
icon_mastodon <- glue("<span style='font-family:jet;'>󰫑</span>")
icon_bsky <- glue("<span style='font-family:jet;'></span>")
usuario <- glue("<span style='color:{c3};'>**vhgauto**</span>")
sep <- glue("**|**")
mi_caption <- glue(
"{fuente}<br>{autor} {sep} {icon_github} {icon_twitter} {icon_instagram} ",
"{icon_mastodon} {icon_bsky} {usuario}"
)
# datos -------------------------------------------------------------------
tuesdata <- tidytuesdayR::tt_load(2024, 47)
ep <- tuesdata$episode_metrics
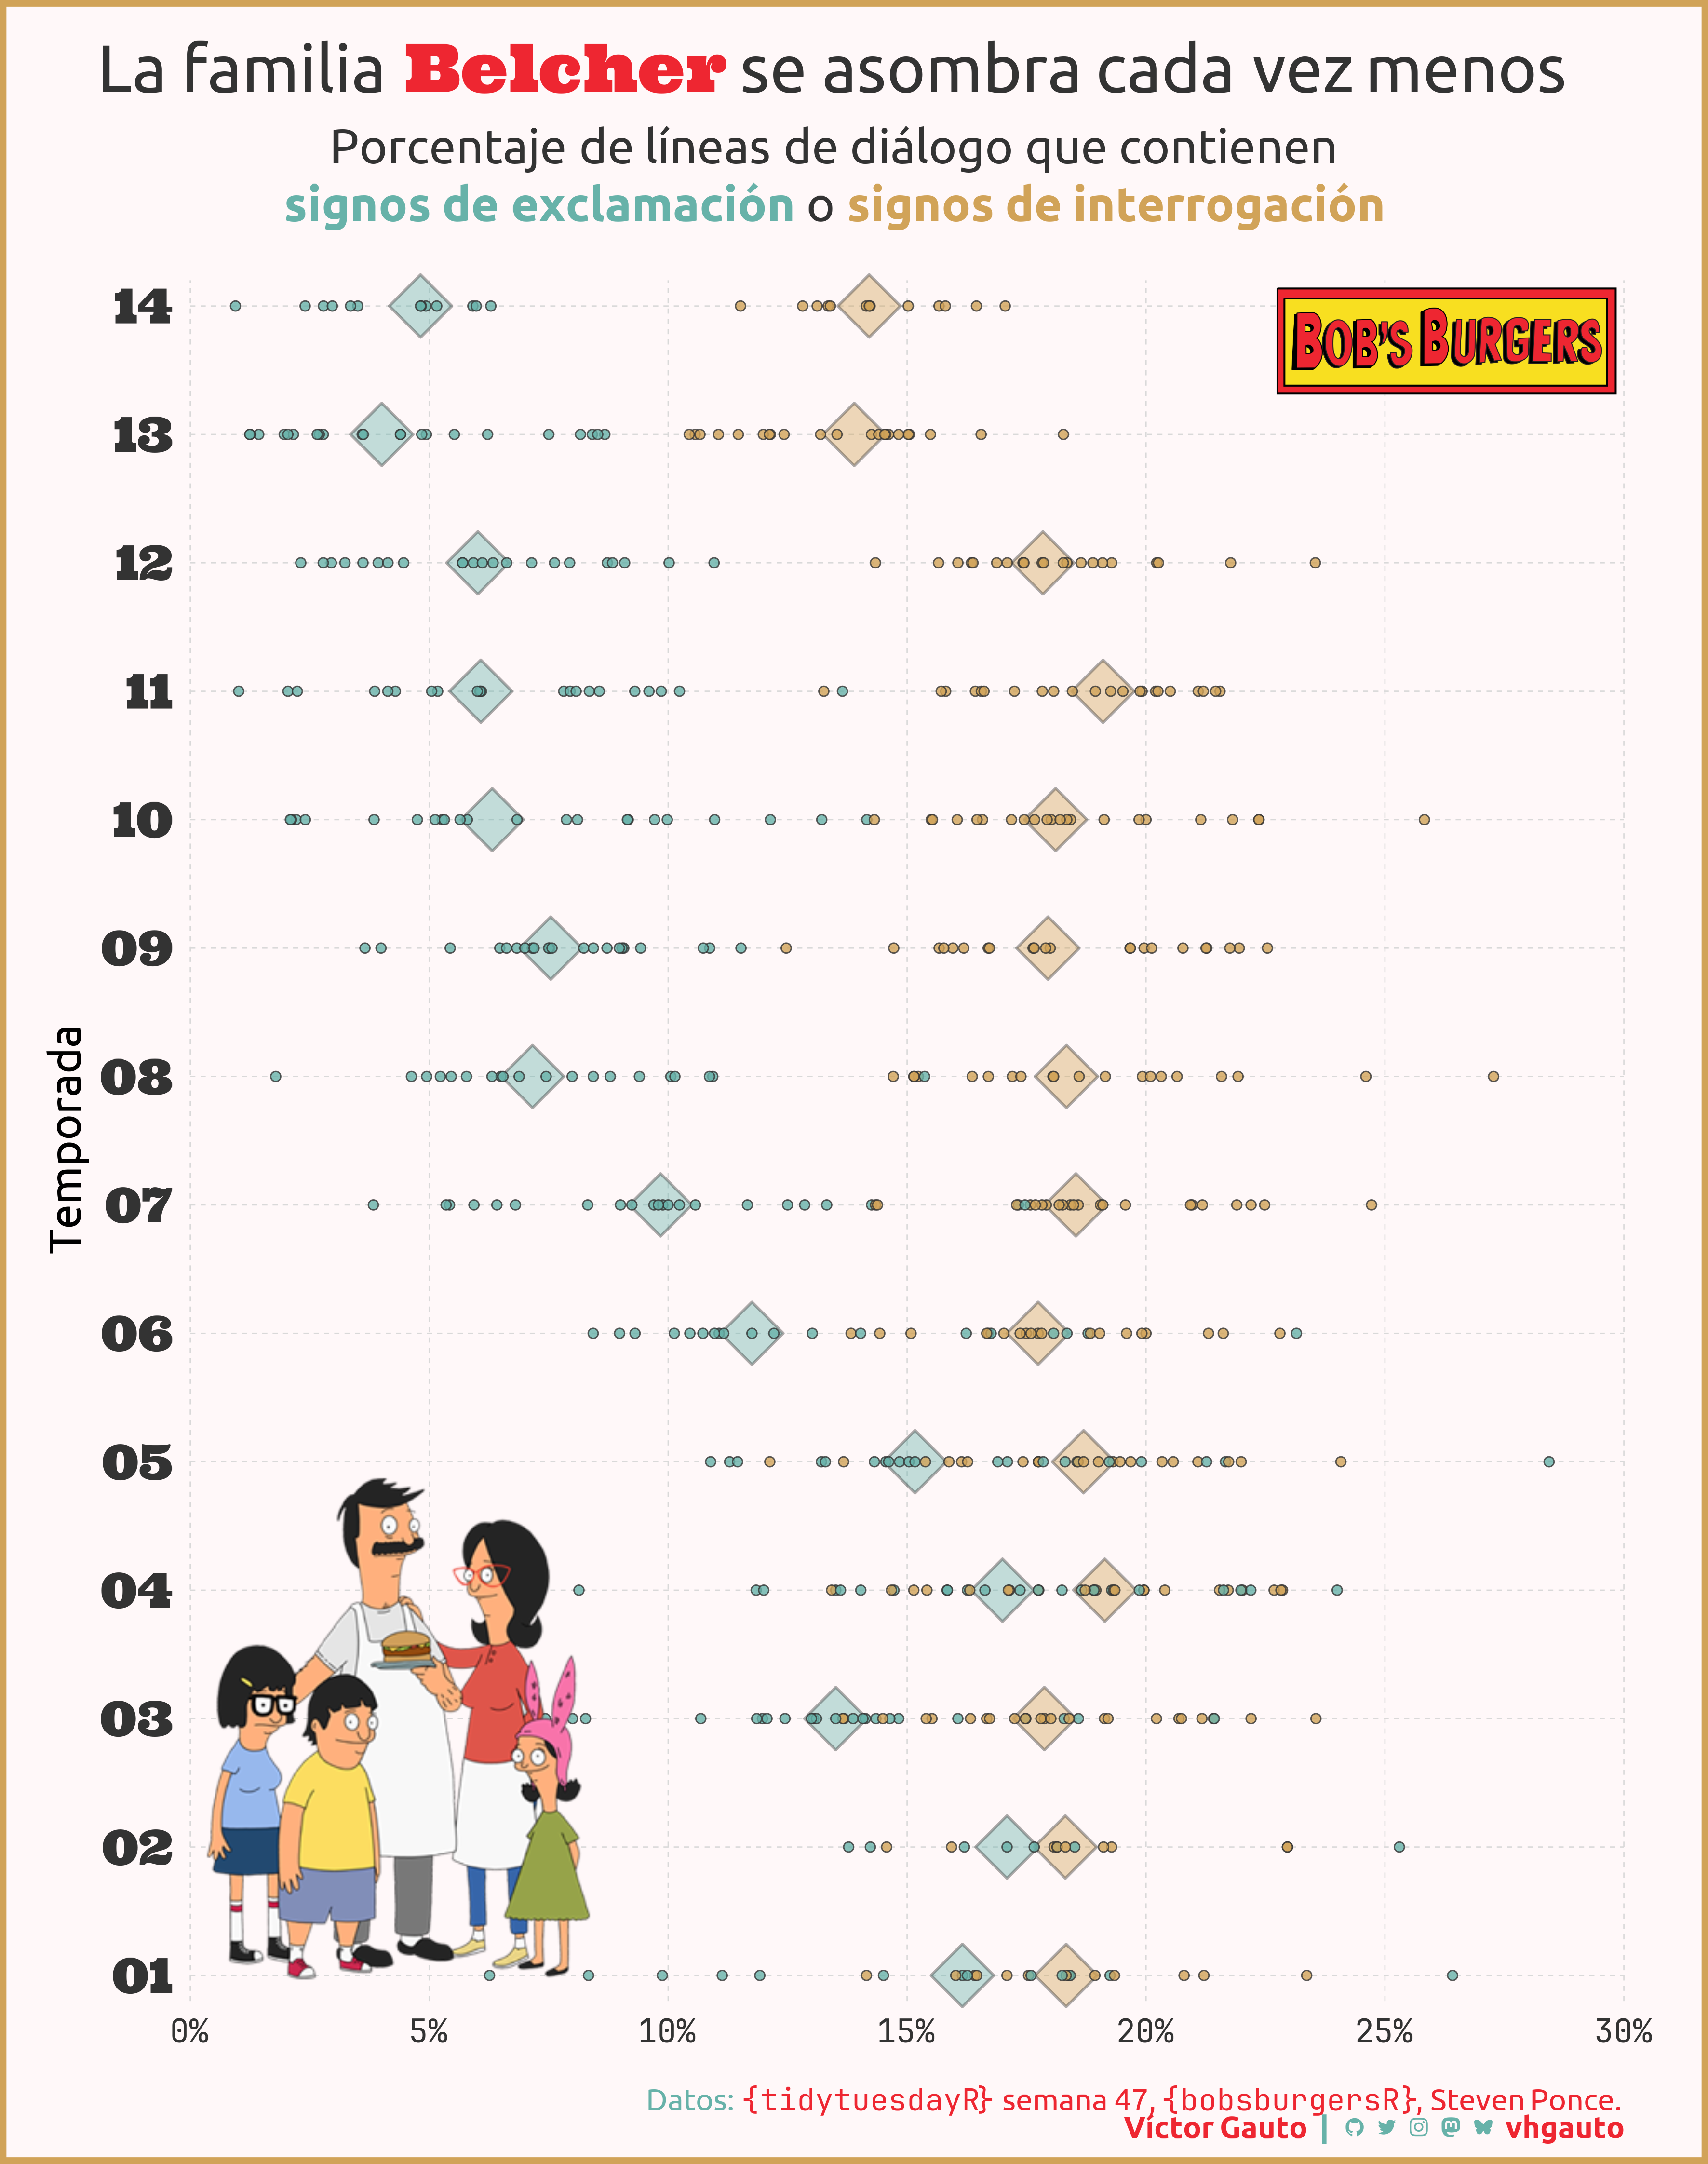
# me interesa comparar el uso de signos de interrogación/exclamación en
# cada temporada
# proporciones medias por temporada
d <- ep |>
reframe(
preg = median(question_ratio),
excl = median(exclamation_ratio),
.by = season
) |>
pivot_longer(
cols = c(preg, excl),
names_to = "dialogo",
values_to = "prop"
)
# proporciones medias por temporada y episodio
d_largo <- ep |>
select(season, question_ratio, exclamation_ratio) |>
pivot_longer(
cols = c(question_ratio, exclamation_ratio),
names_to = "dialogo",
values_to = "prop"
) |>
mutate(
dialogo = if_else(
dialogo == "question_ratio",
"preg",
"excl"
)
)
# figura ------------------------------------------------------------------
# logo y figura de la familia Belcher
img_link <- "https://upload.wikimedia.org/wikipedia/en/7/7f/Bob%27s_Burgers_promo.png"
img_label <- glue("<img src='{img_link}' width=200 />")
logo_link <- "https://upload.wikimedia.org/wikipedia/commons/thumb/4/4c/Bob%27s_Burgers_logo.svg/1024px-Bob%27s_Burgers_logo.svg.png"
logo_label <- glue("<img src='{logo_link}' width=170 />")
# título y subtítulo
mi_titulo <- glue(
"La familia <b style='font-family: ultra; color: {c3}'>Belcher</b> se ",
"asombra cada vez menos"
)
mi_subtitulo <- glue(
"Porcentaje de líneas de diálogo que contienen<br>",
"<b style='color: {c2}'>signos de exclamación</b> o ",
"<b style='color: {c1}'>signos de interrogación</b>"
)
# figura
g <- ggplot(d, aes(prop, season, fill = dialogo)) +
# medianas
geom_point(
show.legend = FALSE, size = 11, shape = 23, color = c5, stroke = 1,
alpha = .4
) +
# episodios
geom_point(
data = d_largo, color = c5, size = 2, shape = 21, show.legend = FALSE,
alpha = .8
) +
# familia Belcher
annotate(
geom = "richtext", x = -Inf, y = -Inf, label = img_label, fill = NA,
label.color = NA, hjust = 0, vjust = 0
) +
# lobo Bob's Burger
annotate(
geom = "richtext", x = Inf, y = Inf, label = logo_label, fill = NA,
label.color = NA, hjust = 1, vjust = 1
) +
scale_x_continuous(
breaks = scales::breaks_width(.05),
expand = c(0, 0),
limits = c(0, .30001),
labels = scales::label_percent()
) +
scale_y_continuous(
breaks = scales::breaks_width(1),
labels = (x) ifelse(x < 10, paste0("0", x), x),
limits = c(.8, 14.2),
expand = c(0, 0)
) +
scale_fill_manual(
breaks = c("preg", "excl"),
values = c(c1, c2)
) +
coord_cartesian(clip = "off") +
labs(
x = NULL,
y = "Temporada",
title = mi_titulo,
subtitle = mi_subtitulo,
caption = mi_caption
) +
ggthemes::theme_tufte(base_size = 20) +
theme(
aspect.ratio = 1.2,
plot.margin = margin(t = 22, b = 10, l = 25, r = 42),
plot.background = element_rect(fill = c4, color = c1, linewidth = 3),
plot.title.position = "plot",
plot.title = element_markdown(
family = "ubuntu", size = 33, color = c5, hjust = .5
),
plot.subtitle = element_markdown(
family = "ubuntu", color = c5, size = 24, lineheight = 1.2, hjust = .5,
margin = margin(b = 25)
),
plot.caption = element_markdown(
family = "ubuntu", color = c2, size = 15, margin = margin(t = 20)
),
panel.grid.major = element_line(
color = "grey85", linewidth = .3, linetype = "44"
),
axis.ticks = element_blank(),
axis.title = element_text(family = "ubuntu", size = 22),
axis.text.x = element_text(family = "jet", color = c5),
axis.text.y = element_text(family = "ultra", color = c5, size = 24)
)
# guardo
ggsave(
plot = g,
filename = "2024/s47/viz.png",
width = 30,
height = 38,
units = "cm"
)
# abro
browseURL(glue("{getwd()}/2024/s47/viz.png"))