# paquetes ----------------------------------------------------------------
library(tidyverse)
library(fontawesome)
library(showtext)
library(glue)
library(ggtext)
library(ggpath)
# fuentes -----------------------------------------------------------------
font_add_google(name = "Share Tech Mono", family = "share") # rendimiento, eje y
font_add_google(name = "Lato", family = "lato") # resto del texto
font_add_google(name = "Bebas Neue", family = "bebas") # años, eje x
font_add_google(name = "Merriweather", family = "merriweather") # título
showtext_auto()
showtext_opts(dpi = 300)
# íconos
font_add("fa-reg", "icon/Font Awesome 5 Free-Regular-400.otf")
font_add("fa-brands", "icon/Font Awesome 5 Brands-Regular-400.otf")
font_add("fa-solid", "icon/Font Awesome 5 Free-Solid-900.otf")
# caption
icon_twitter <- "<span style='font-family:fa-brands; color:grey90;'></span>"
icon_github <- "<span style='font-family:fa-brands; color:grey90;'></span>"
fuente <- "<span style='color:grey90;'>Datos:</span> <span style='color:gold;'><span style='font-family:mono;'>{**tidytuesdayR**}</span> semana 15</span>"
autor <- "<span style='color:grey90;'>Autor:</span> <span style='color:gold;'>**Víctor Gauto**</span>"
sep <- glue("<span style = 'color:grey90;'>**|**</span>")
usuario <- glue("<span style = 'color:gold;'>**vhgauto**</span>")
mi_caption <- glue("{fuente} {sep} {autor} {sep} {icon_github} {icon_twitter} {usuario}")
# datos -------------------------------------------------------------------
browseURL("https://github.com/rfordatascience/tidytuesday/blob/master/data/2023/2023-04-11/readme.md")
eggproduction <- readr::read_csv('https://raw.githubusercontent.com/rfordatascience/tidytuesday/master/data/2023/2023-04-11/egg-production.csv')
# acomodo datos
datos <- eggproduction |>
filter(prod_type == "table eggs" & prod_process == "all") |>
mutate(rendimiento = n_eggs/n_hens) |>
mutate(año = factor(year(observed_month))) |>
select(año, gallina = n_hens, huevo = n_eggs, rendimiento)
# valores mínimos 2017-2020, todos en febrero
flecha <- eggproduction |>
filter(prod_type == "table eggs" & prod_process == "all") |>
mutate(rendimiento = n_eggs/n_hens) |>
mutate(año = factor(year(observed_month))) |>
group_by(año) |>
slice_min(order_by = rendimiento, n = 1) |>
filter(month(observed_month) == 2) |>
select(año, rendimiento) |>
ungroup() |>
mutate(xend = 2:5,
x = 4.8,
yend = rendimiento - 0,
y = 21.95)
# figura ------------------------------------------------------------------
g <- ggplot(data = datos, aes(x = año, y = rendimiento)) +
# verticales
geom_vline(xintercept = 1.5:5.5, color = "grey30", linewidth = .1) +
# tendencia
geom_smooth(aes(x = as.numeric(año), y = rendimiento), linewidth = 4,
color = "gold",
inherit.aes = FALSE, se = FALSE, formula = y ~ x, method = "lm") +
# flechas
geom_segment(data = flecha, aes(x = x, xend = xend, y = y, yend = yend),
color = "grey40", linewidth = .5, alpha = 1) +
geom_richtext(aes(x = 4.8, y = 21.95,
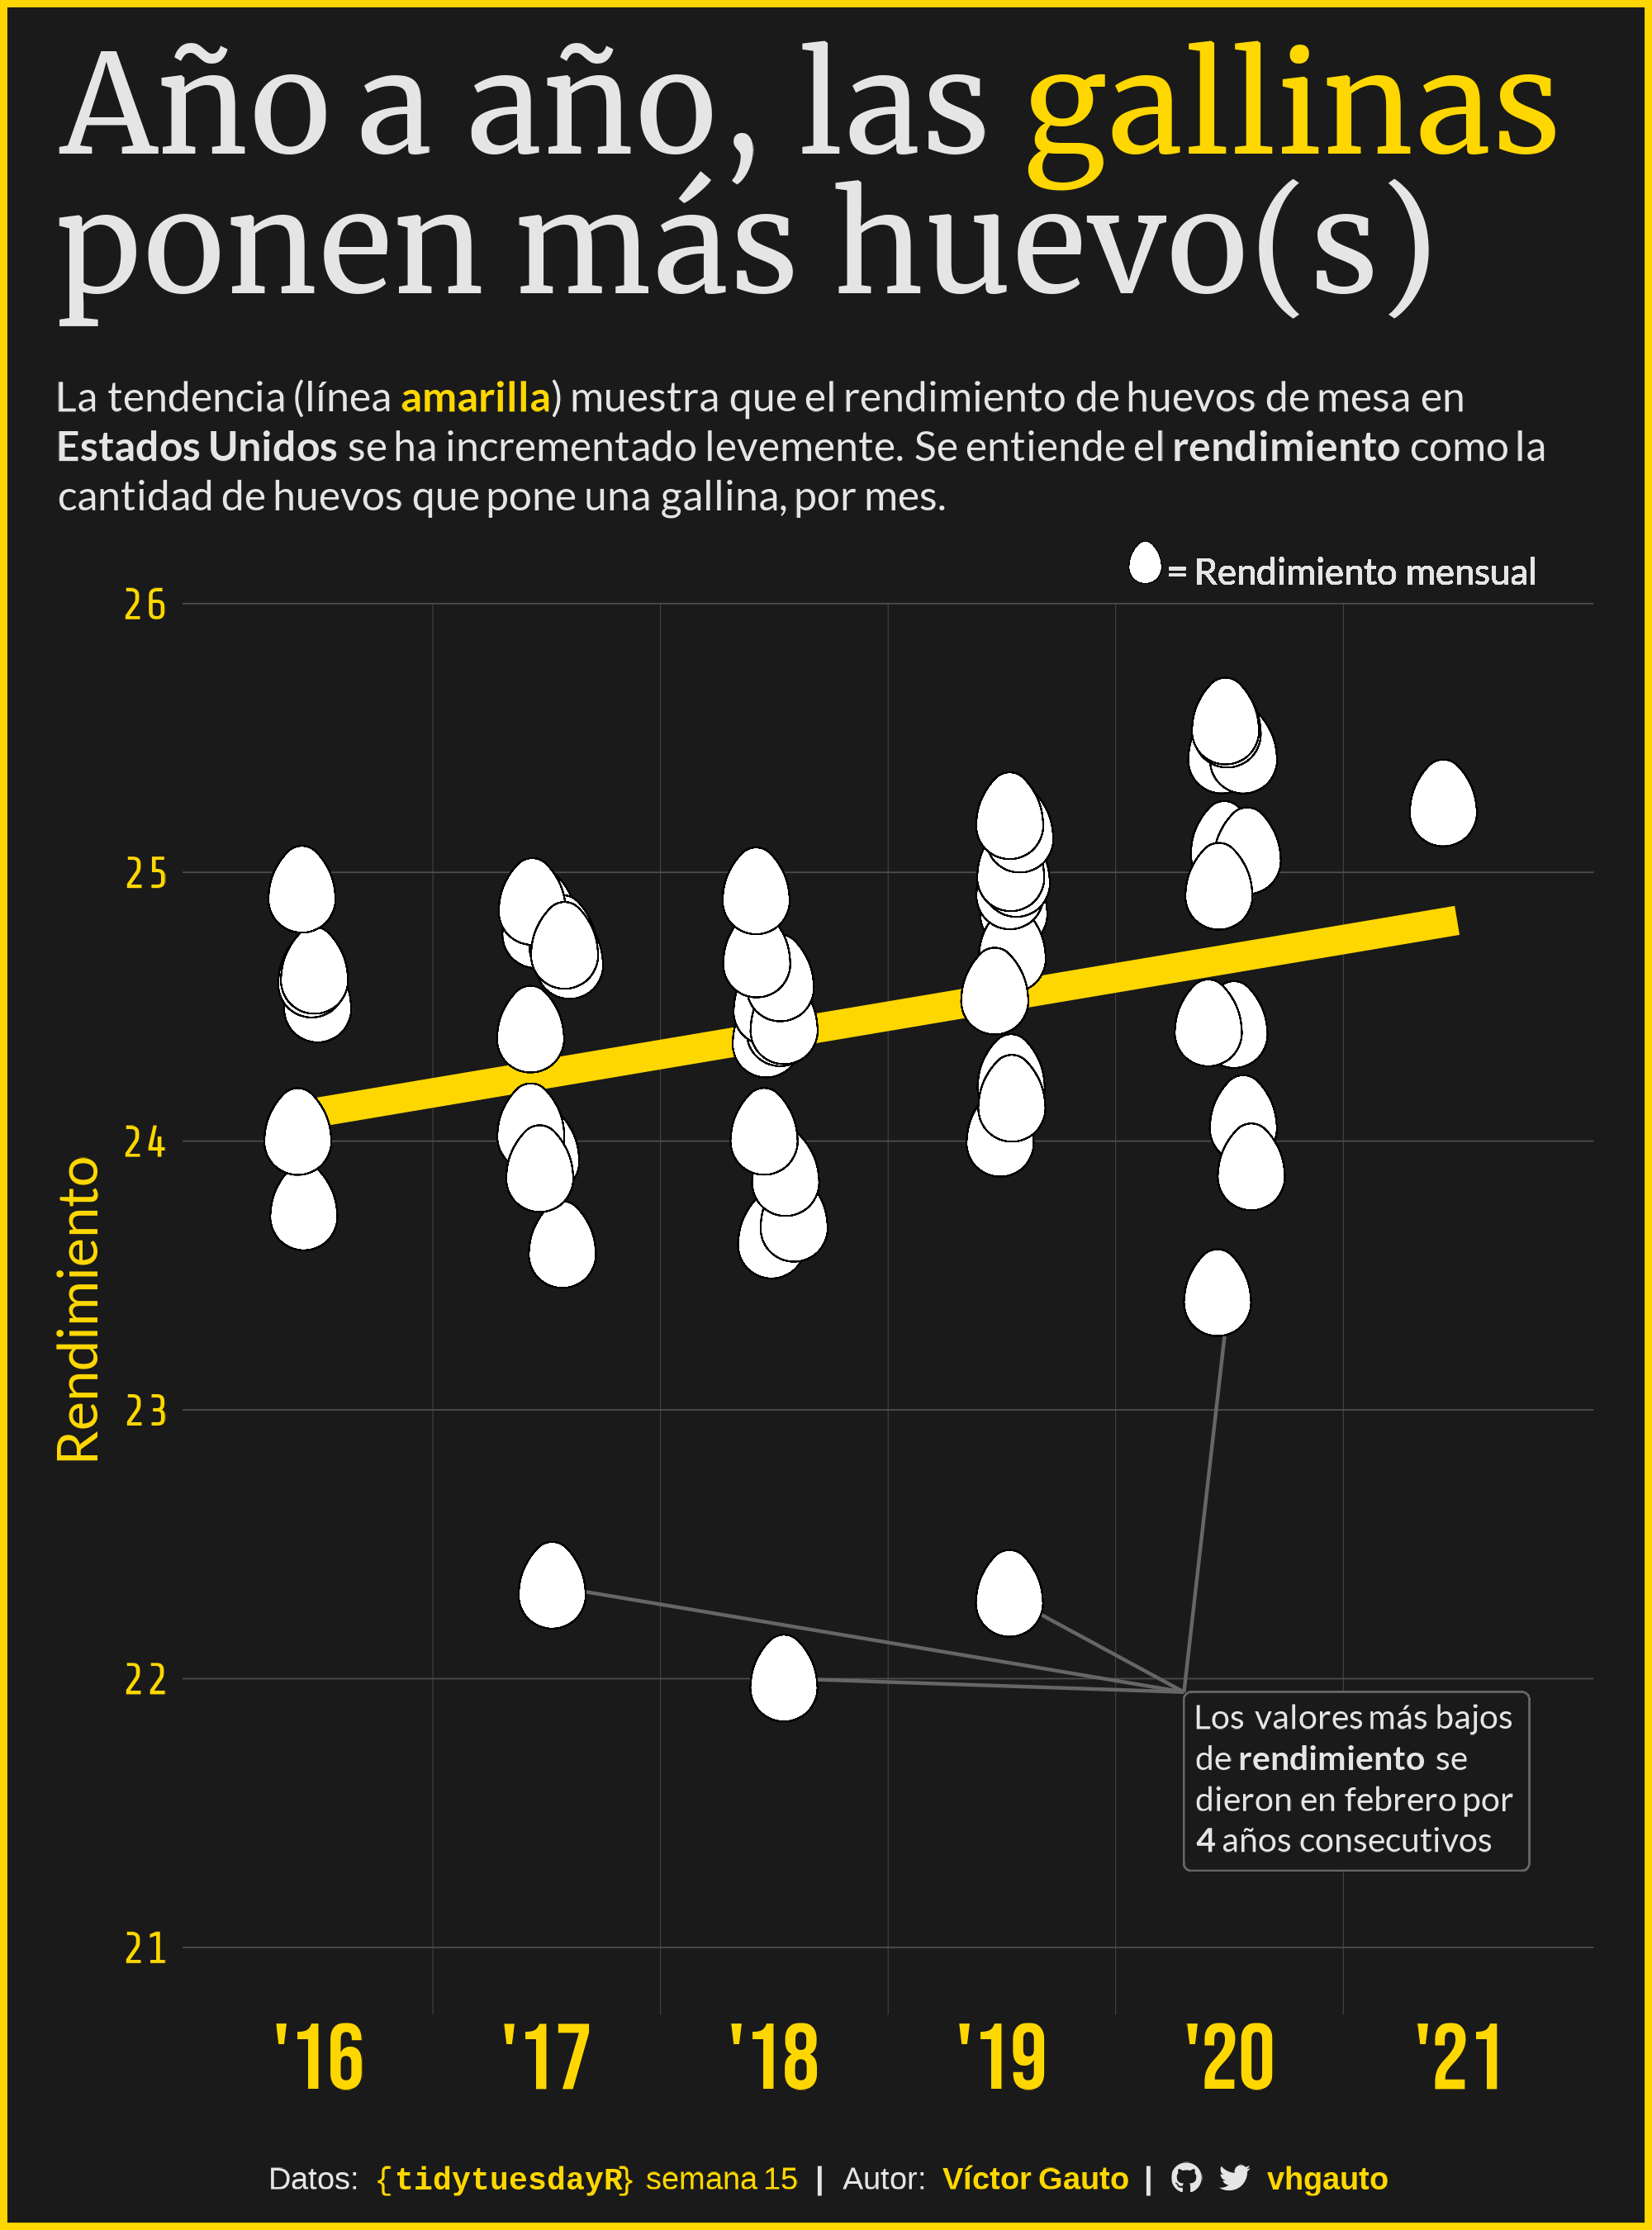
label = "Los valores más bajos<br>de **rendimiento** se<br>
dieron en febrero por<br>**4** años consecutivos"),
inherit.aes = FALSE, color = "grey90", size = 3.5, vjust = 1,
fill = "grey10", label.color = "grey40", hjust = 0, family = "lato") +
# huevo .png, jitter
geom_from_path(aes(path = "2023/semana_15/egg.png"), width = .05,
position = position_jitter(width = .1, seed = 2023)) +
# leyenda
geom_richtext(aes(x = 4.5, y = 26,
label = "<img src='2023/semana_15/egg.png' width='10'> = Rendimiento mensual"),
color = "grey90", fill = NA, inherit.aes = FALSE, hjust = 0,
label.color = NA, vjust = 0, size = 3.7, family = "lato") +
# manual
scale_y_continuous(breaks = seq(21, 26, 1),
limits = c(20.75, 26),
expand = c(0, 0)) +
scale_x_discrete(breaks = 2016:2021,
labels = glue("'{16:21}")) +
coord_cartesian(clip = "off") +
# ejes
labs(x = NULL, y = "Rendimiento",
title = "Año a año, las <span style='color:gold;'>gallinas</span><br>ponen
más huevo(s)",
subtitle = "La tendencia (línea <span style='color:gold;'>**amarilla**</span>)
muestra que el rendimiento de huevos de mesa en **Estados Unidos** se ha
incrementado levemente. Se entiende el **rendimiento** como la cantidad de huevos
que pone una gallina, por mes.",
caption = mi_caption) +
theme_minimal() +
theme(
aspect.ratio = 1,
axis.text.x = element_text(
family = "bebas", size = 27, color = "gold", margin = margin(0, 0, 20, 0)),
axis.text.y = element_text(family = "share", size = 13, color = "gold"),
axis.title.y = element_text(color = "gold", family = "lato", size = 16),
plot.background = element_rect(fill = "grey10", color = "gold", linewidth = 2),
plot.title = element_markdown(
family = "merriweather", size = 40, margin = margin(10, 0, 5, 0),
color = "grey90"),
plot.title.position = "plot",
plot.subtitle = element_textbox_simple(
size = 12, family = "lato", margin = margin(10, 0, 25, 0),
color = "grey90"),
plot.caption = element_markdown(
hjust = .3, size = 9, margin = margin(0, 0, 5, 0)),
plot.margin = margin(5, 17, 5, 17),
panel.background = element_rect(fill = "grey10", color = NA),
panel.grid.minor = element_blank(),
panel.grid.major.x = element_blank(),
panel.grid.major.y = element_line(color = "grey30", linewidth = .2)
)
# guardo
ggsave(plot = g,
filename = "2023/semana_15/viz.png",
width = 2000,
height = 2700,
units = "px",
dpi = 300)
# abro
browseURL("2023/semana_15/viz.png")