# paquetes ----------------------------------------------------------------
library(tidyverse)
library(fontawesome)
library(ggtext)
library(glue)
library(showtext)
# fuente ------------------------------------------------------------------
# colores
# paleta 'Kandinsky' de MetBrewer
c1 <- "#3B3A3E"
c2 <- "#898E9F"
c3 <- "#CE9642"
c4 <- "#3B7C70"
font_add_google(name = "DM Serif Display", family = "dmserif") # título
font_add_google(name = "Inconsolata", family = "inconsolata") # números
font_add_google(name = "Ubuntu", family = "ubuntu", db_cache = FALSE) # texto gral
showtext_auto()
showtext_opts(dpi = 300)
# íconos
font_add("fa-reg", "icon/Font Awesome 6 Free-Regular-400.otf")
font_add("fa-brands", "icon/Font Awesome 6 Brands-Regular-400.otf")
font_add("fa-solid", "icon/Font Awesome 6 Free-Solid-900.otf")
# caption
fuente <- glue("Datos: <span style='color:{c3};'><span style='font-family:mono;'>{{<b>tidytuesdayR</b>}}</span> semana 24</span>")
autor <- glue("Autor: <span style='color:{c3};'>**Víctor Gauto**</span>")
icon_twitter <- glue("<span style='font-family:fa-brands;'></span>")
icon_github <- glue("<span style='font-family:fa-brands;'></span>")
usuario <- glue("<span style='color:{c3};'>**vhgauto**</span>")
sep <- glue("**|**")
mi_caption <- glue("{fuente} {sep} {autor} {sep} {icon_github} {icon_twitter} {usuario}")
# datos -------------------------------------------------------------------
browseURL("https://github.com/rfordatascience/tidytuesday/blob/master/data/2023/2023-06-13/readme.md")
safi <- readr::read_csv('https://raw.githubusercontent.com/rfordatascience/tidytuesday/master/data/2023/2023-06-13/safi_data.csv')
# traducción de los ítems
traduccion <- c(
mobile_phone = "celular", radio = "radio", cow_plough = "arado",
solar_panel = "panel solar", bicycle = "bicicleta",
solar_torch = "linterna solar", table = "mesa", motorcyle = "motocicleta",
television = "televisión", cow_cart = "carro", sterio = "estéreo",
sofa_set = "juego de sofás", electricity = "electricidad", fridge = "heladera",
lorry = "camión", car = "auto", computer = "PC")
# arreglo los datos
d <- safi |>
# selecciono la columna de ítems
select(items_owned) |>
# remuevo las celdas vacías
filter(items_owned != "NULL") |>
# separo el contenido de las celdas de ítems, y agrego filas
separate_longer_delim(cols = items_owned, delim = ";") |>
# cuento la cantidad de ítems
count(items_owned) |>
# ordeno
arrange(desc(n)) |>
# traduzco
mutate(items_owned = traduccion[items_owned]) |>
# convierto a factor los ítems individuales
mutate(items_owned = fct_reorder(items_owned, n))
# figura ------------------------------------------------------------------
# título
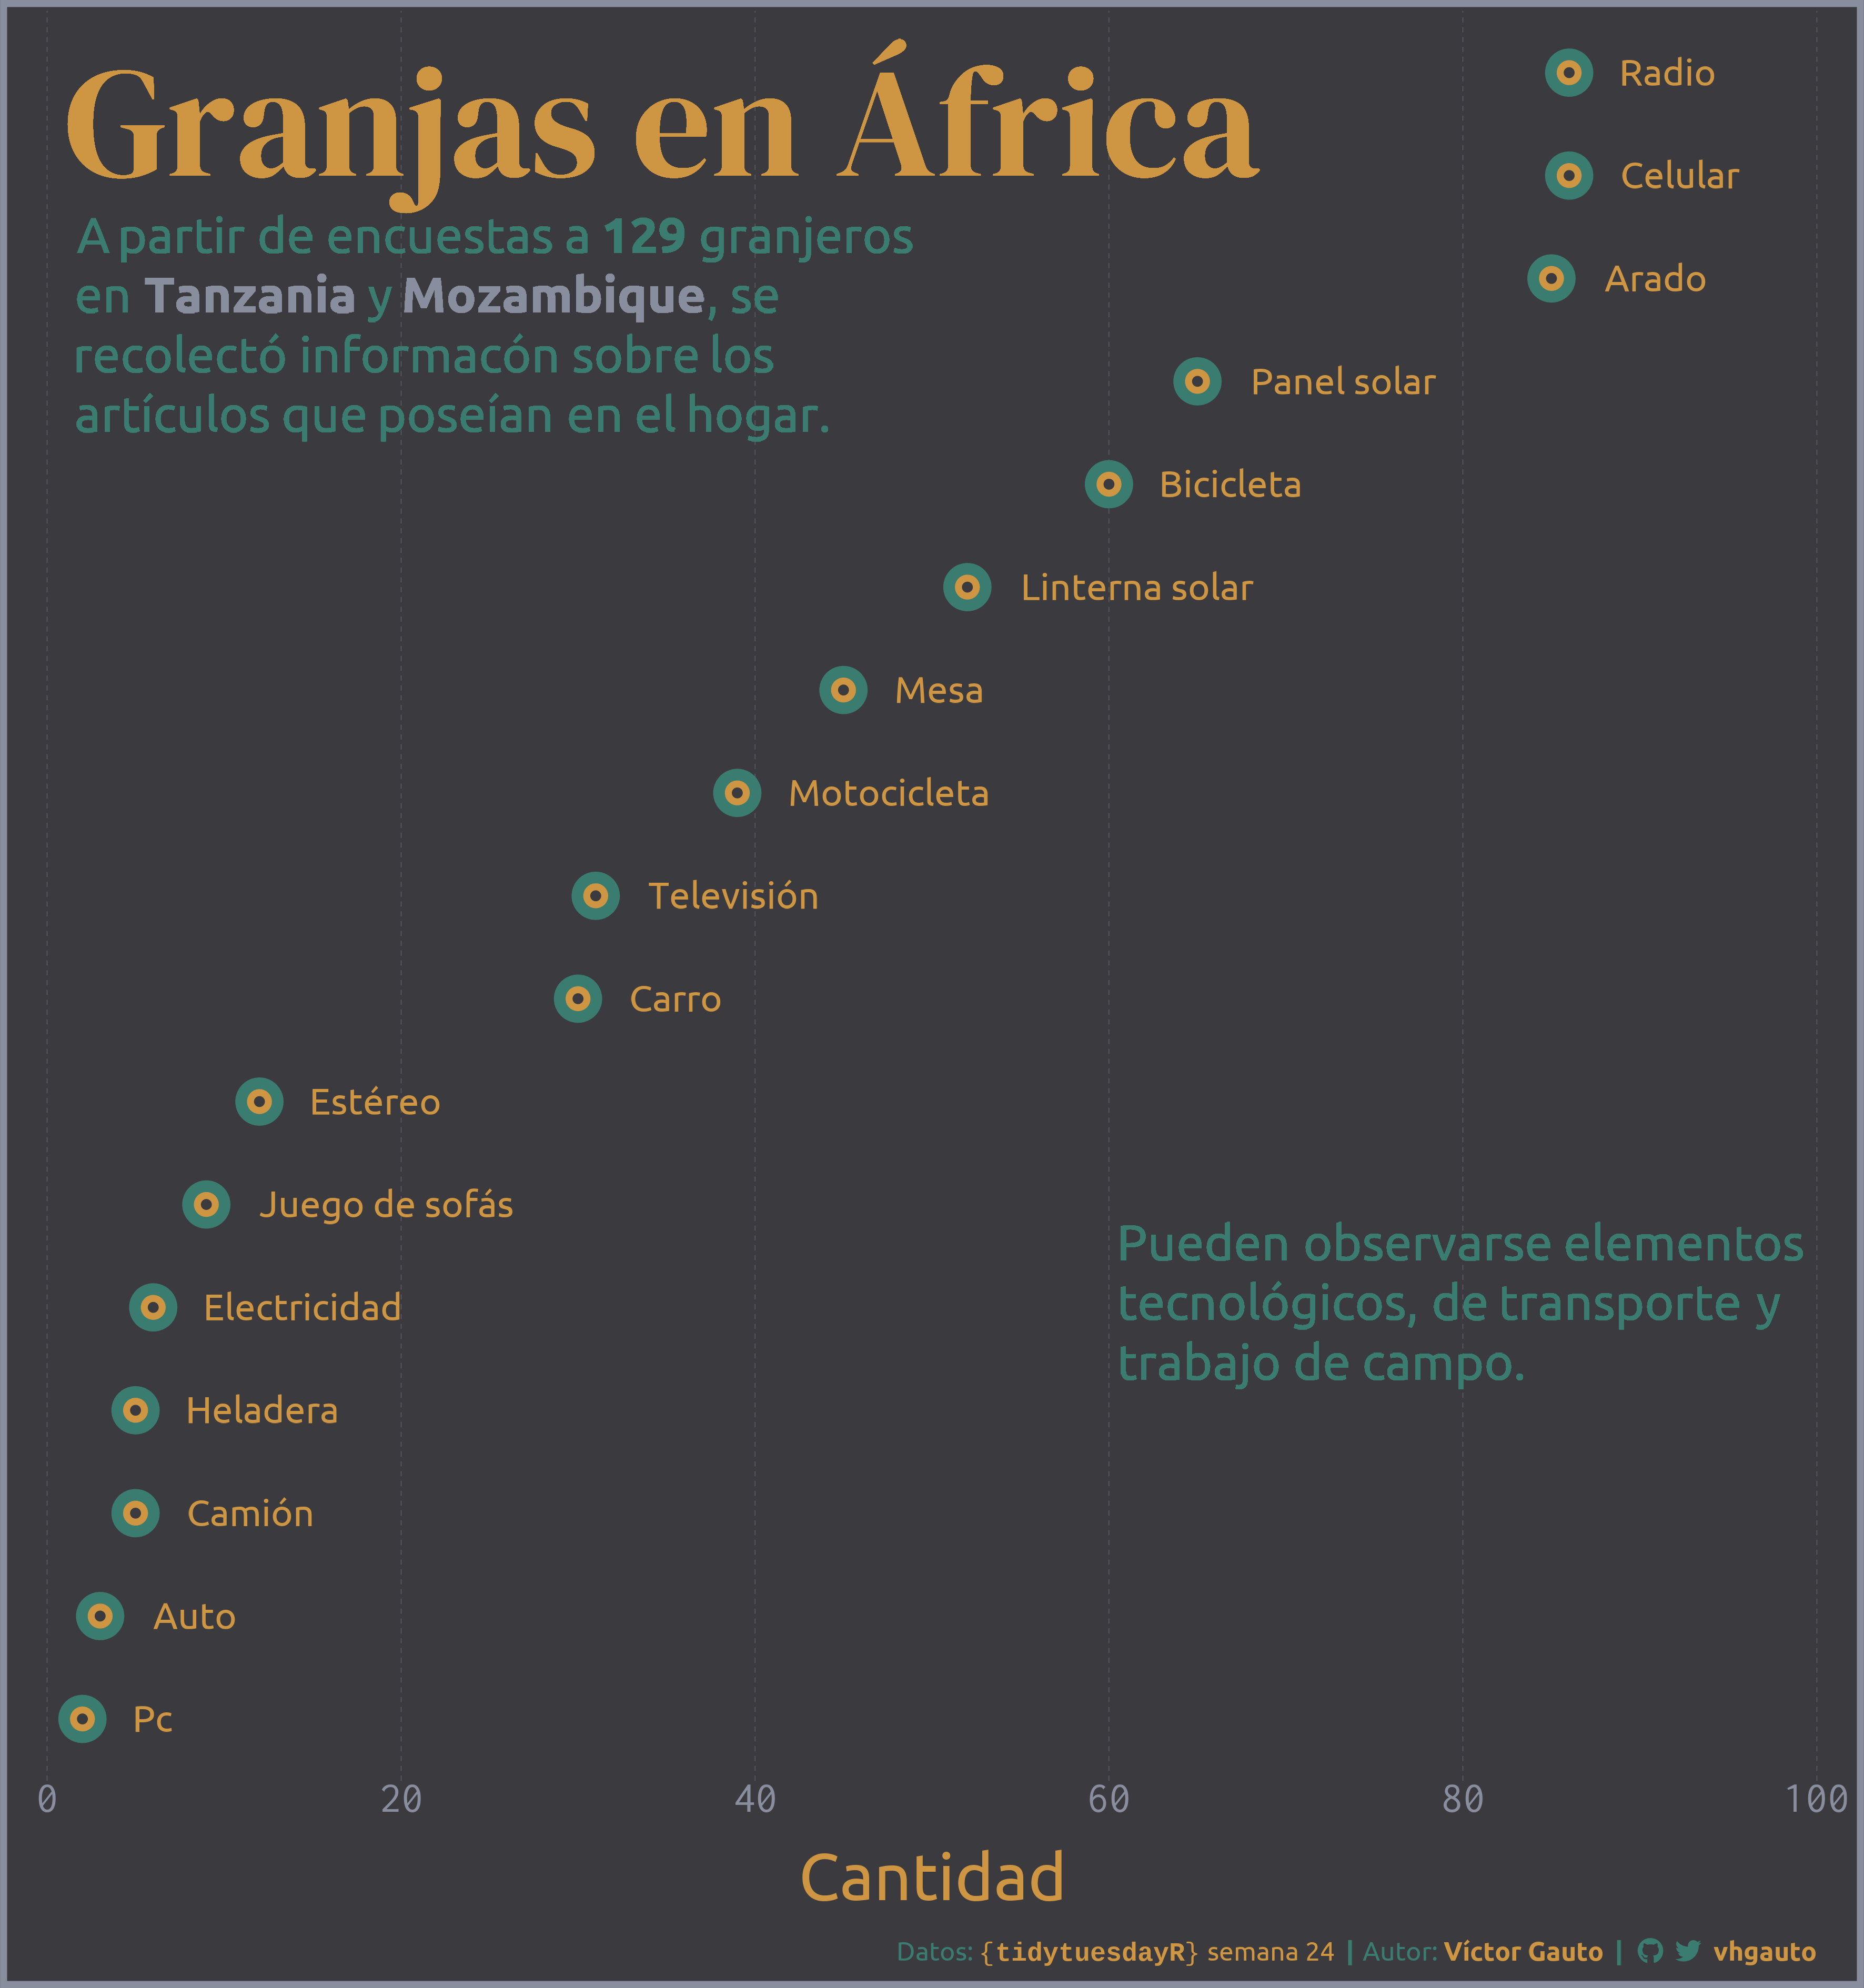
tit <- "Granjas en África"
# subtítulos
sub1 <- glue(
"A partir de encuestas a <b>{length(unique(safi$key_ID))}</b> granjeros en
<b style='color:{c2}'>Tanzania</b> y <b style='color:{c2}'>Mozambique</b>, se
recolectó informacón sobre los artículos que poseían en el hogar.")
sub2 <- glue(
"Pueden observarse elementos tecnológicos, de transporte y trabajo de campo.")
# figura
g <- ggplot(data = d, aes(x = n, y = items_owned, fill = items_owned)) +
# título
geom_text(
x = 1, y = 17, label = tit,
color = c3, size = 25, hjust = 0, vjust = 1, family = "dmserif") +
# subtítulo I
geom_textbox(
x = 1, y = 14.5, label = sub1,
color = c4, size = 8, box.color = NA, fill = NA, hjust = 0,
width = unit(14, "cm"), family = "ubuntu") +
# subtítulo II
geom_textbox(
x = 60, y = 5, label = sub2,
color = c4, size = 8, box.color = NA, fill = NA, hjust = 0,
width = unit(12, "cm"), family = "ubuntu") +
# puntos
geom_point(
show.legend = FALSE, color = c4, size = 10, shape = 16) +
geom_point(
show.legend = FALSE, color = c3, size = 5,shape = 16) +
geom_point(
show.legend = FALSE, color = c1, size = 2, shape = 16) +
# ítems
geom_text(
aes(label = str_to_sentence(items_owned)),
hjust = 0, nudge_x = 3, color = c3, size = 6, family = "ubuntu") +
# ejes
labs(
x = "Cantidad", y = NULL, caption = mi_caption) +
scale_x_continuous(
limits = c(0, 100), expand = c(0, 0), breaks = seq(0, 100, 20)) +
coord_cartesian(clip = "off") +
# tema
theme_void() +
theme(
aspect.ratio = 1,
plot.margin = margin(5, 21.5, 5, 21.5),
plot.background = element_rect(
fill = c1, color = c2, linewidth = 3),
plot.caption = element_markdown(
color = c4, size = 12, family = "ubuntu", margin = margin(10, 0, 5, 0)),
panel.grid.major.x = element_line(
color = c2, linewidth = .07, linetype = "ff"),
axis.text.x = element_text(
size = 20, family = "inconsolata", color = c2),
axis.text.y = element_blank(),
axis.title.x = element_text(
color = c3, size = 30, family = "ubuntu", margin = margin(15, 0, 5, 0)))
# guardo
ggsave(
plot = g,
filename = "2023/semana_24/viz.png",
width = 30,
height = 32,
units = "cm",
dpi = 300)
# abro
browseURL("2023/semana_24/viz.png")