# paquetes ----------------------------------------------------------------
library(tidyverse)
library(ggraph)
library(showtext)
library(glue)
library(ggtext)
# fuente ------------------------------------------------------------------
# colores
c1 <- "grey95"
c2 <- "gold"
c3 <- "grey30"
c4 <- "#C159A0"
# caption
font_add_google(name = "Ubuntu", family = "ubuntu")
# paquetes
font_add_google(name = "Victor Mono", family = "victor", db_cache = FALSE)
# íconos
font_add("fa-brands", "icon/Font Awesome 6 Brands-Regular-400.otf")
font_add("fa-solids", "icon/Font Awesome 6 Free-Solid-900.otf")
showtext_auto()
showtext_opts(dpi = 300)
# caption
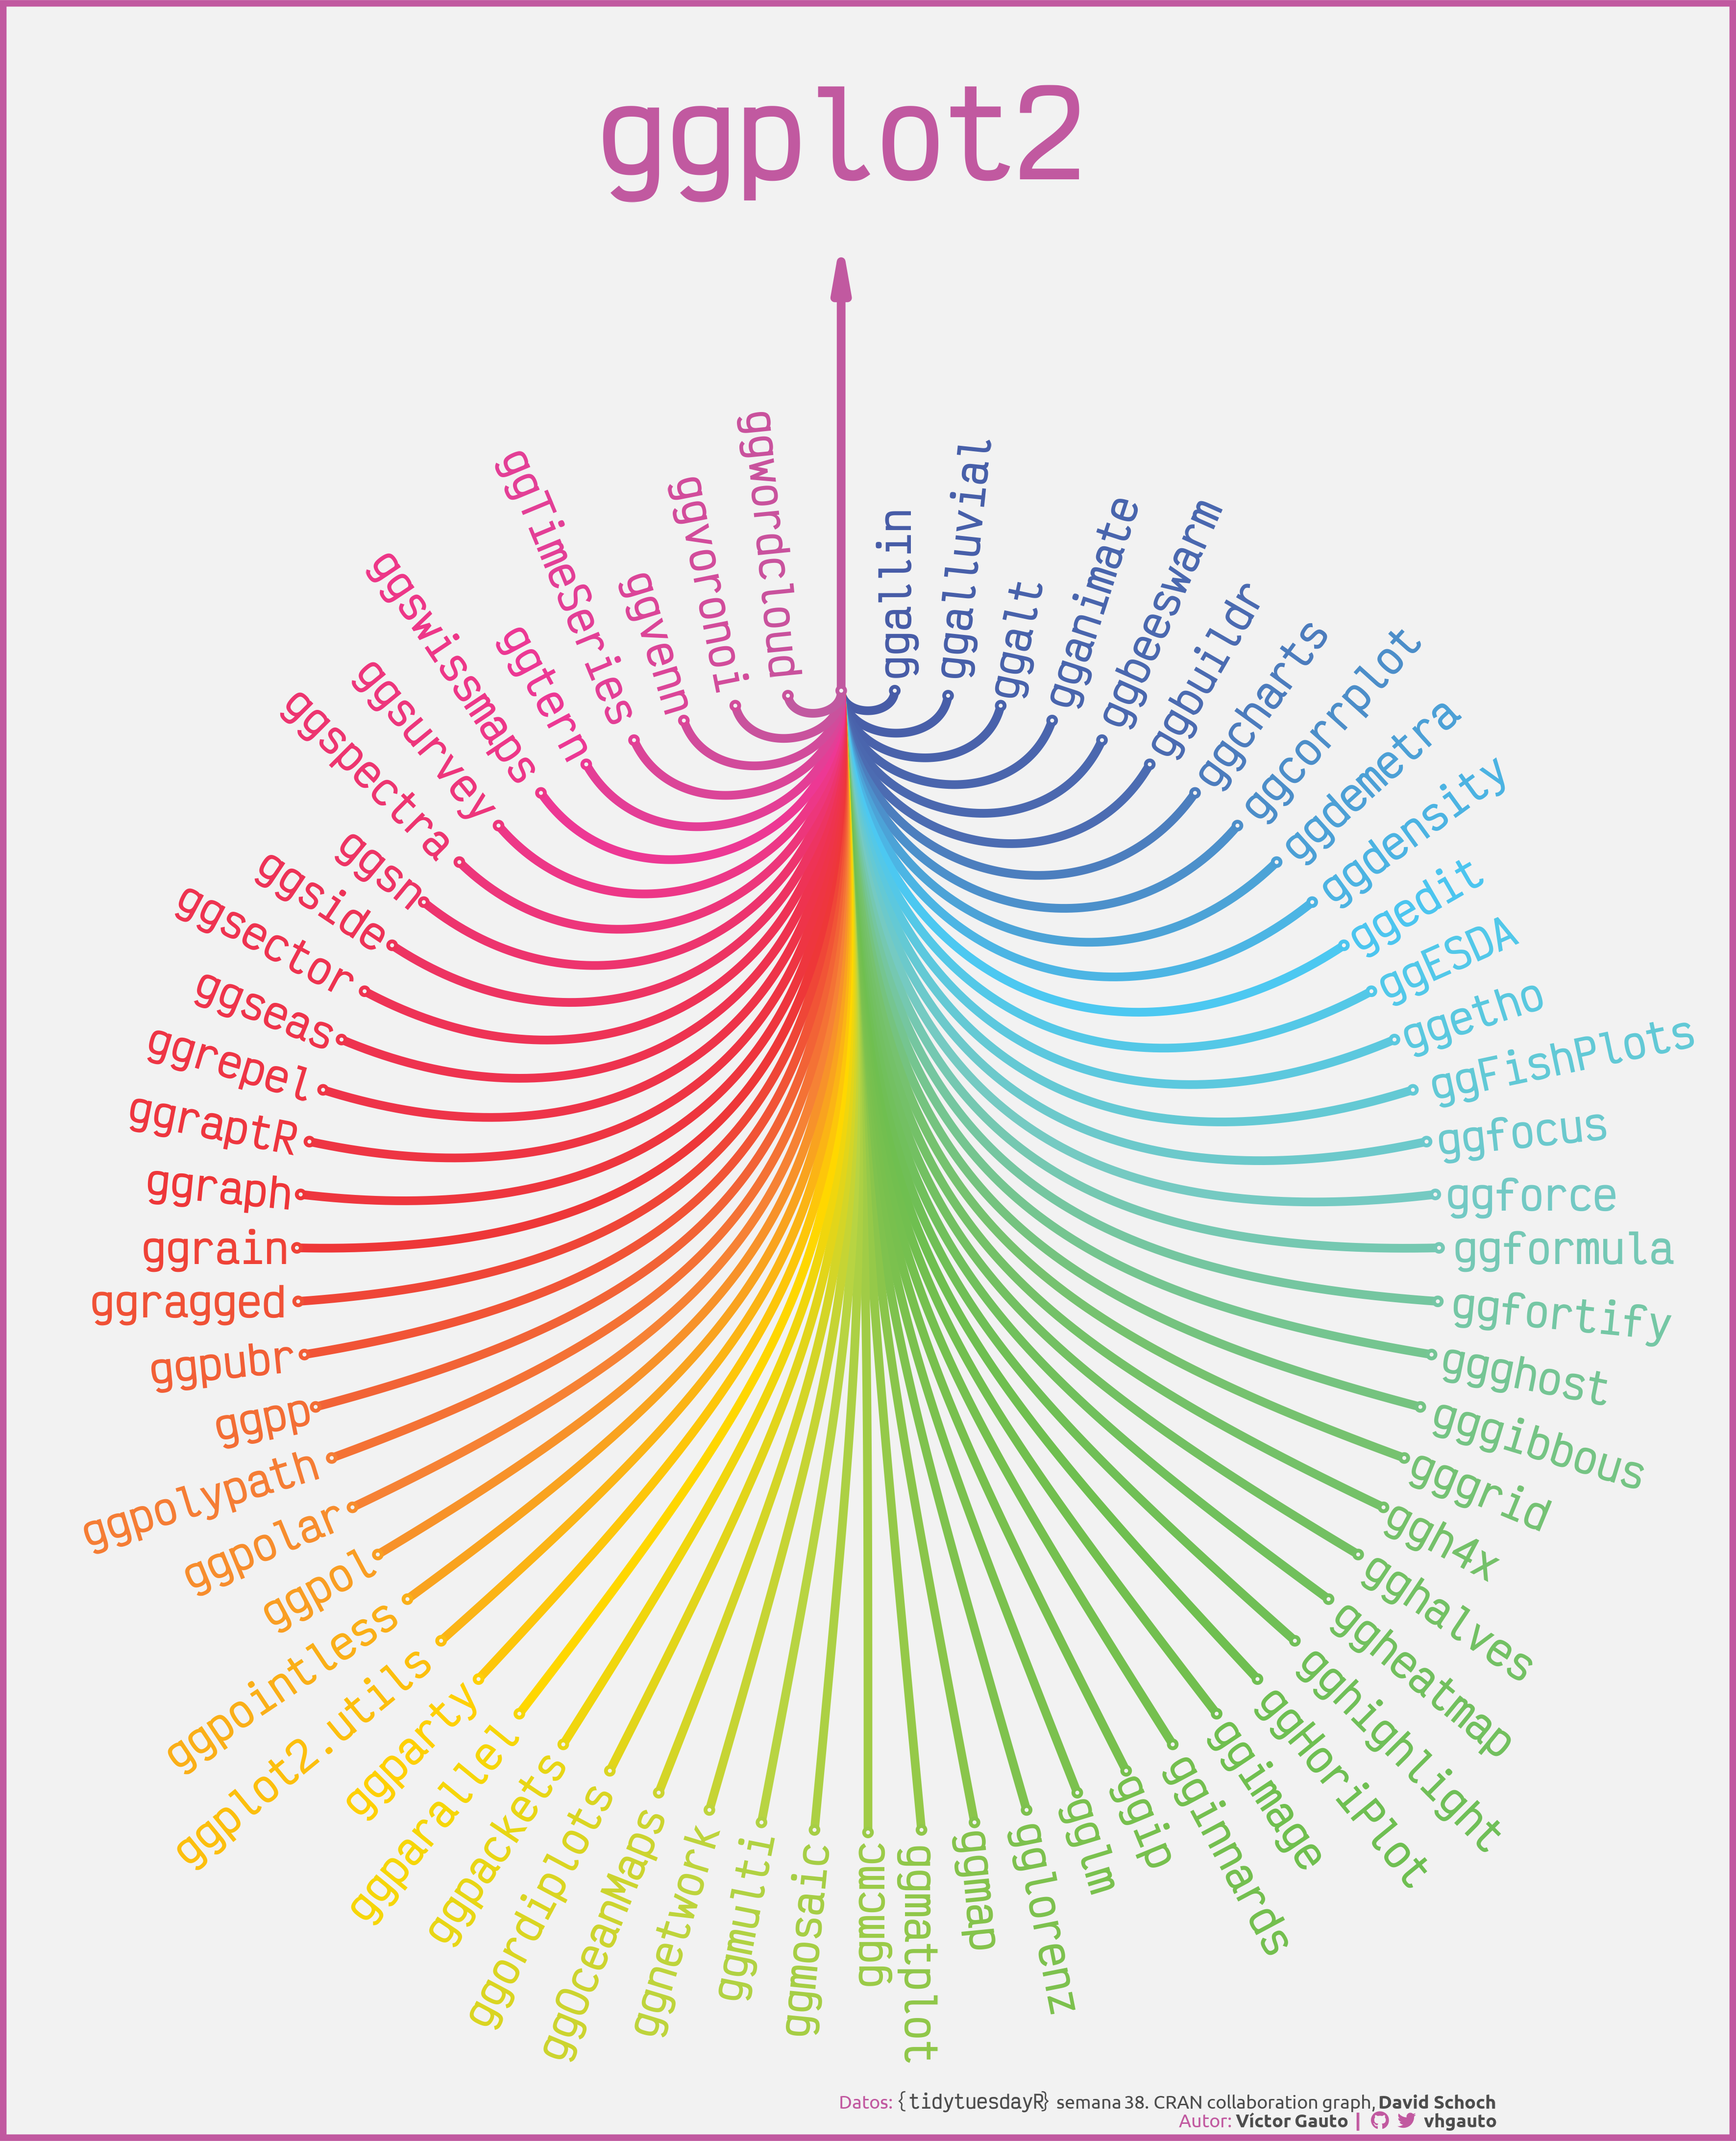
fuente <- glue("Datos: <span style='color:{c3};'><span style='font-family:victor;'>{{<b>tidytuesdayR</b>}}</span> semana 38. CRAN collaboration graph, **David Schoch**</span>")
autor <- glue("Autor: <span style='color:{c3};'>**Víctor Gauto**</span>")
icon_twitter <- glue("<span style='font-family:fa-brands;'></span>")
icon_github <- glue("<span style='font-family:fa-brands;'></span>")
usuario <- glue("<span style='color:{c3};'>**vhgauto**</span>")
sep <- glue("**|**")
mi_caption <- glue("{fuente}<br>{autor} {sep} {icon_github} {icon_twitter} {usuario}")
# datos -------------------------------------------------------------------
browseURL("https://github.com/rfordatascience/tidytuesday/blob/master/data/2023/2023-09-19/readme.md")
cran_20230905 <- readr::read_csv('https://raw.githubusercontent.com/rfordatascience/tidytuesday/master/data/2023/2023-09-19/cran_20230905.csv')
# me interesa ver los paquetes que empiezan con 'gg', como un grafo
# paleta de colores alrededor de 'ggplot2'
f_paleta <- colorRampPalette(
c("#475CA7", "#4C6CB2", "#4CC8F1", "#75CAC2", "#76C26F", "#6FBF50",
"#7FC24E", "#B8D442", "gold", "#F68235", "#EE3738", "#EE3356",
"#ED3894", "#C159A0"))
# elijo los paquetes que empiezan con 'gg' y que tienen 'ggplot2' como
# dependencia
d <- cran_20230905 |>
select(paq = Package, dep = Depends) |>
separate_longer_delim(dep, ",") |>
mutate(dep = str_trim(dep)) |>
filter(str_detect(paq, "^gg")) |>
drop_na(dep) |>
filter(str_detect(dep, "ggplot2")) |>
mutate(dep = "ggplot2") |>
mutate(co = f_paleta(66))
# ángulos de texto de los paquetes alrededor del grafo
s1 <- seq(90, 0, length.out = 16)
s2 <- seq(360, 270, length.out = 17)
s3 <- seq(-270, -360, length.out = 17)
s4 <- seq(0, -90, length.out = 17)
# agrego hjust, vjust, size y colores
# en el caso de 'ggplot2', tiene valores diferentes
d_vertices <- d |>
distinct(paq) |>
add_row(paq = "ggplot2") |>
# mutate(hjust = case_when(
# row_number() <= 33 ~ -.05,
# row_number() > 33 ~ 1.05,
# .default = .5)) |>
mutate(hjust = if_else(row_number() <= 33, -.075, 1.075)) |>
mutate(angle = c(s1, s2, s3, s4)) |>
mutate(vjust = .5) |>
mutate(size = 7) |>
mutate(angle = if_else(paq == "ggplot2", 0, angle)) |>
mutate(hjust = if_else(paq == "ggplot2", .5, hjust)) |>
mutate(vjust = if_else(paq == "ggplot2", -5.5, vjust)) |>
mutate(size = if_else(paq == "ggplot2", 20, size)) |>
mutate(co = f_paleta(67))
# creo el grafo
graph <- igraph::graph_from_data_frame(d, vertices = d_vertices)
# figura ------------------------------------------------------------------
g <- ggraph(graph, layout = 'linear', circular = TRUE) +
# flecha apuntando a 'ggplot2'
annotate(
geom = "segment", x = -.047, xend = -.047, y = .99, yend = 1.75,
color = c4, arrow = arrow(angle = 10, type = "closed"), linewidth = 2) +
# arcos que unen 'paq' con 'ggplot2'
geom_edge_arc(
aes(colour = I(co)), edge_width = 2, linemitre = 1, lineend = "round",
show.legend = FALSE) +
# puntos de color y blancos
geom_node_point(aes(colour = I(co)), size = 2) +
geom_node_point(color = c1, size = .25) +
# texto 'paq'
geom_node_text(
aes(
label = name, angle = angle, hjust = hjust, vjust = vjust, size = size,
colour = I(co)),
show.legend = FALSE, fontface = "bold", family = "victor") +
coord_fixed(clip = "off") +
scale_size_identity() +
labs(caption = mi_caption) +
theme_void() +
theme(
plot.margin = margin(90, 117.9, 5, 117.9),
plot.background = element_rect(fill = c1, color = c4, linewidth = 3),
plot.caption = element_markdown(
hjust = 1, color = c4, margin = margin(90, 0, 0, 0), size = 9,
family = "ubuntu"),
plot.caption.position = "plot"
)
# guardo
ggsave(
plot = g,
filename = "2023/semana_38/viz.png",
width = 30,
height = 37,
units = "cm")
# abro
browseURL("2023/semana_38/viz.png")