Ocultar código
library(glue)
library(ggtext)
library(showtext)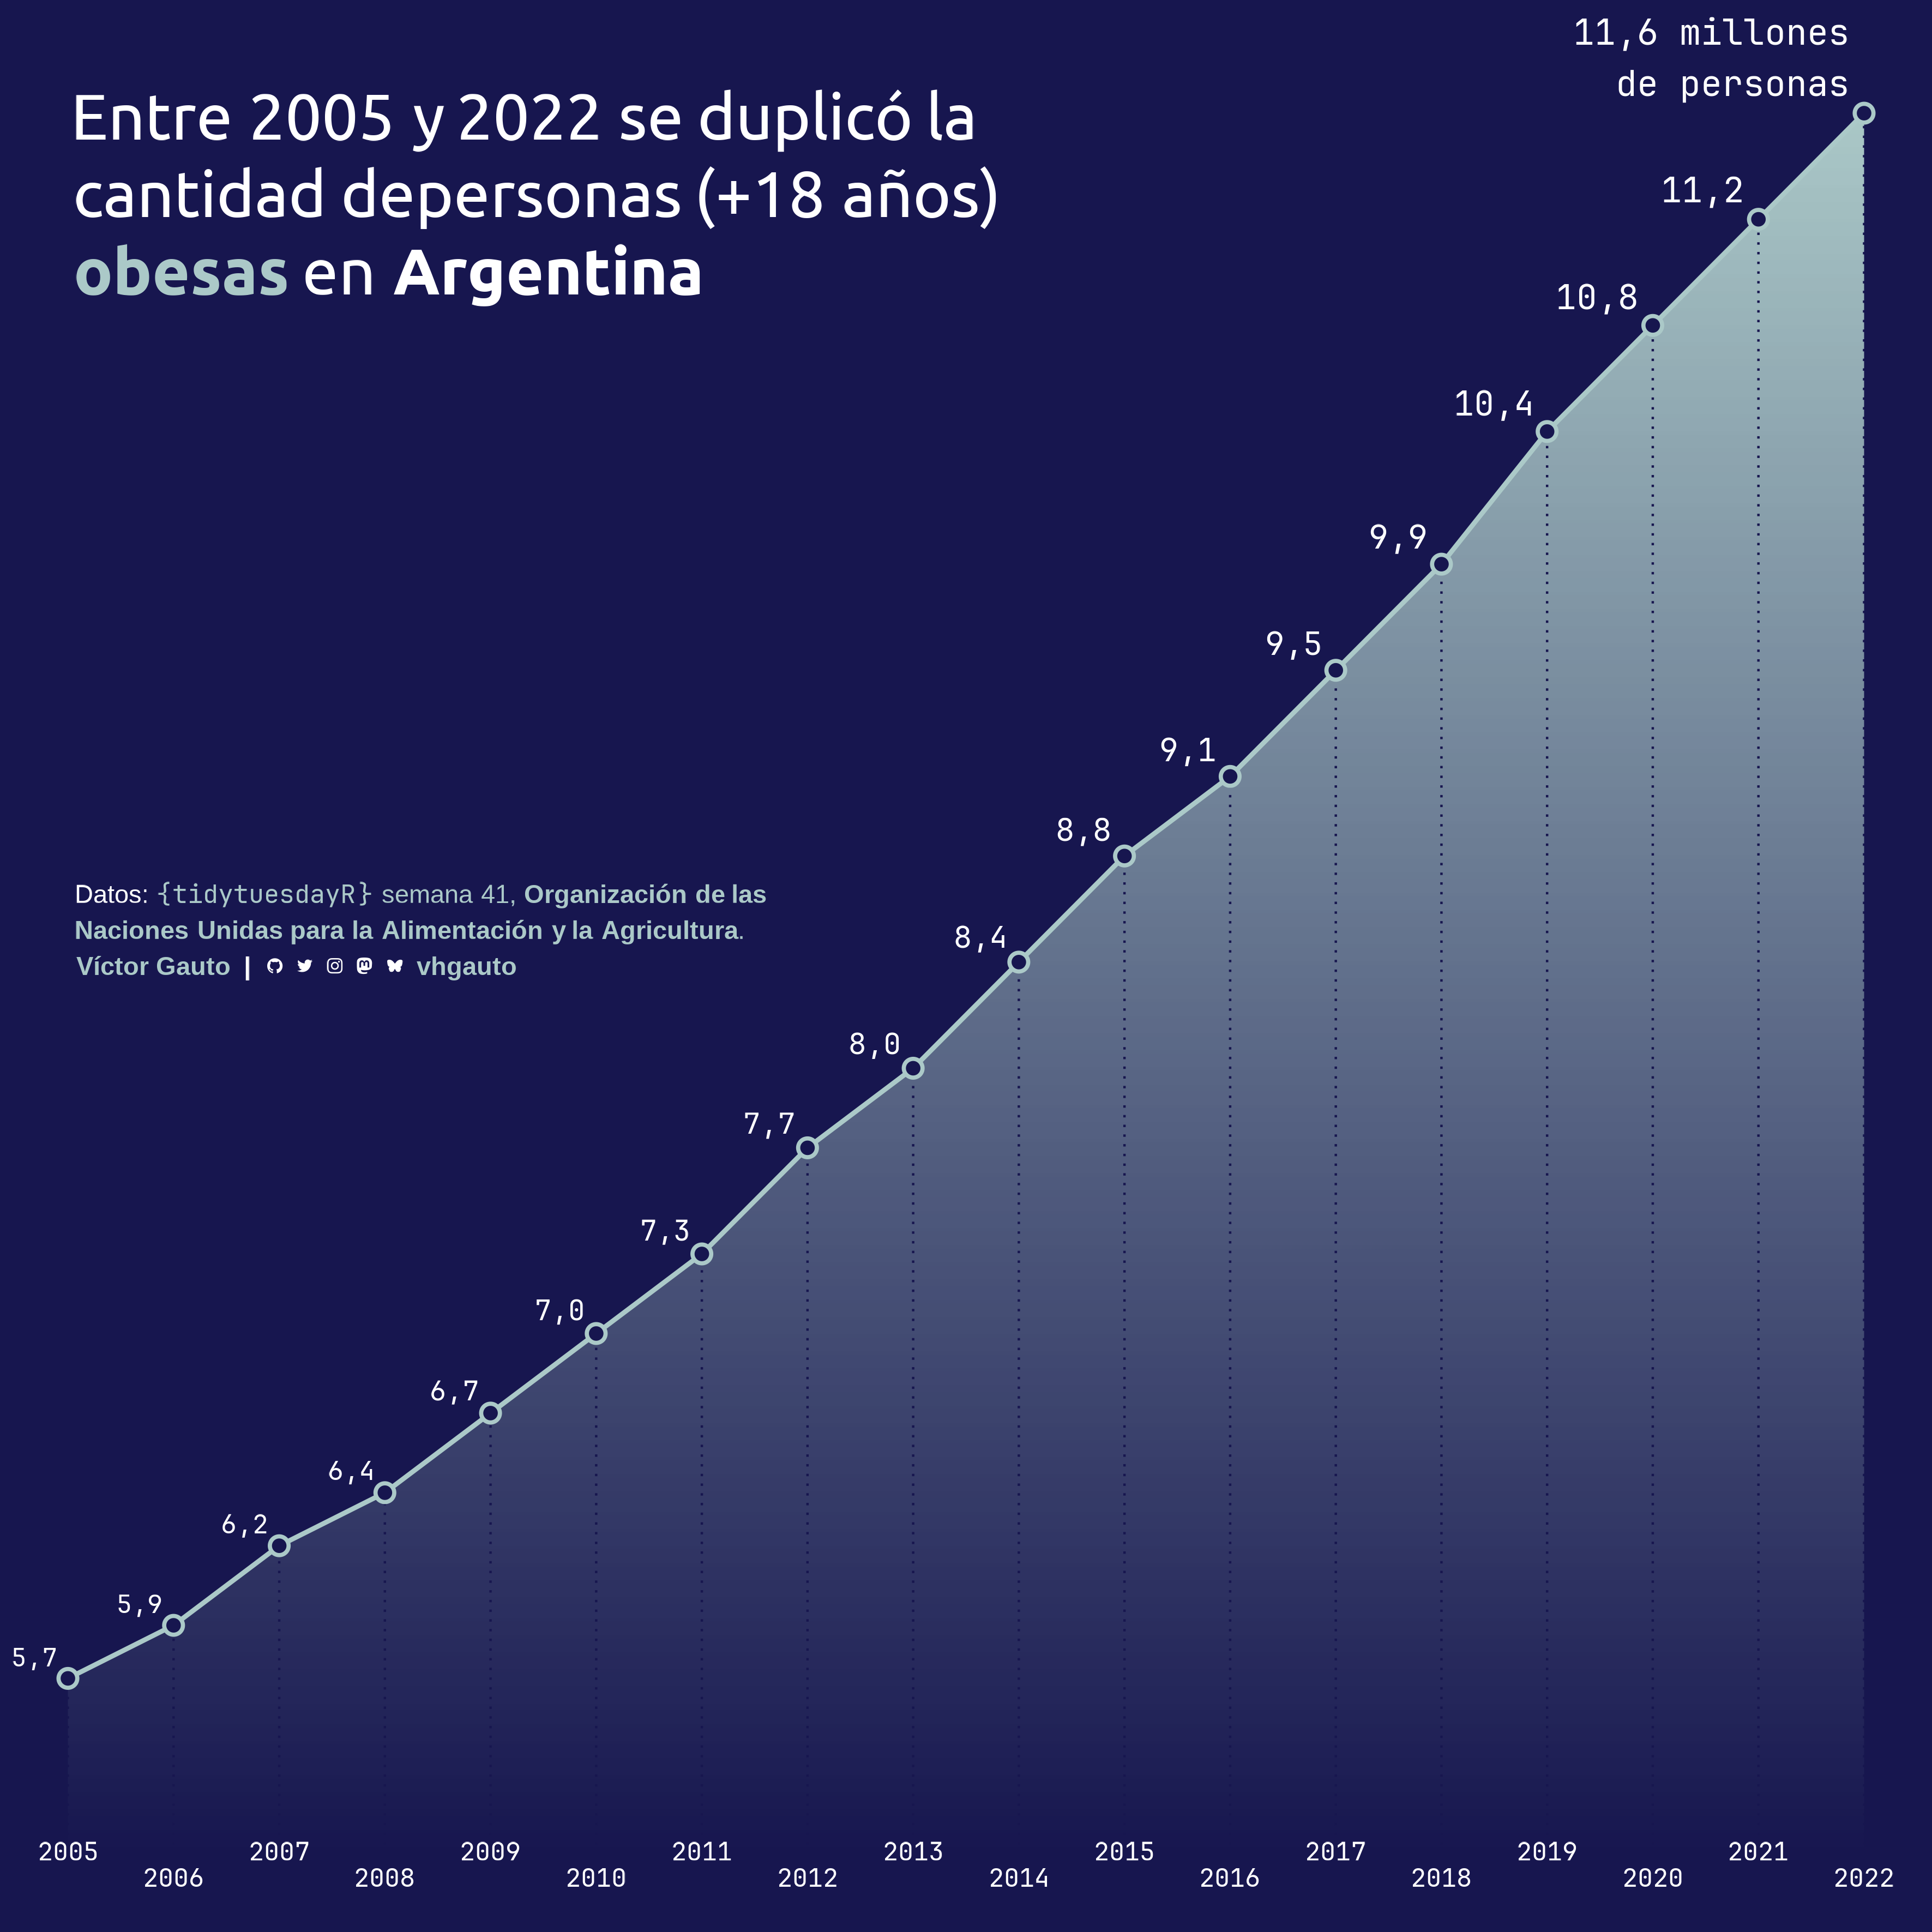
library(tidyverse)Evolución de la cantidad de personas obesas en Argentina.
library(glue)
library(ggtext)
library(showtext)
library(tidyverse)Colores.
c1 <- "#ABC9C8"
c2 <- "#17164F"
c3 <- "white"
c4 <- "black"
Fuentes: Ubuntu y JetBrains Mono.
font_add(
  family = "ubuntu",
  regular = "././fuente/Ubuntu-Regular.ttf",
  bold = "././fuente/Ubuntu-Bold.ttf",
  italic = "././fuente/Ubuntu-Italic.ttf"
)

font_add(
  family = "jet",
  regular = "././fuente/JetBrainsMonoNLNerdFontMono-Regular.ttf"
)

showtext_auto()
showtext_opts(dpi = 300)fuente <- glue(
"Datos: <span style='color:{c1};'><span style='font-family:jet;'>",
"{{<b>tidytuesdayR</b>}}</span> semana 41, ",
"<b>Organización de las<br>Naciones Unidas para la Alimentación y ",
"la Agricultura</b>.</span>"
)
autor <- glue("<span style='color:{c1};'>**Víctor Gauto**</span>")
icon_twitter <- glue("<span style='font-family:jet;'></span>")
icon_instagram <- glue("<span style='font-family:jet;'></span>")
icon_github <- glue("<span style='font-family:jet;'></span>")
icon_mastodon <- glue("<span style='font-family:jet;'>󰫑</span>")
icon_bsky <- glue("<span style='font-family:jet;'></span>")
usuario <- glue("<span style='color:{c1};'>**vhgauto**</span>")
sep <- glue("**|**")
mi_caption <- glue(
"{fuente}<br>{autor} {sep} {icon_github} {icon_twitter} {icon_instagram} ",
"{icon_mastodon} {icon_bsky} {usuario}"
)tuesdata <- tidytuesdayR::tt_load(2025, 41)
food <- tuesdata$food_securityMe interesa la evolución anual en la cantidad de adultos obesos. Agrego formato a los números e indico las unidades.
d <- filter(
  food,
  Area == "Argentina" &
    Item == "Number of obese adults (18 years and older) (million)"
) |>
  select(año = Year_Start, valor = Value) |>
  mutate(
    label = format(
      valor,
      nsmall = 1,
      decimal.mark = ",",
      big.mark = "",
      trim = TRUE
    )
  ) %>%
  mutate(
    label = if_else(
      row_number() == nrow(.),
      paste0(label, " millones\nde personas"),
      label
    )
)Indico el patrón de diseño con una rampa de colores lineal.
p <- grid::linearGradient(
  colours = colorRampPalette(c(c2, c1))(100),
  x1 = 0,
  y1 = 0,
  x2 = 0,
  y2 = 1
)
Título y figura.
mi_titulo <- glue(
  "Entre 2005 y 2022 se duplicó la<br>cantidad de",
  "personas (+18 años)<br><b style='color: {c1};'>obesas</b> en",
  " **Argentina**"
)

g <- ggplot(d, aes(año, valor)) +
  geom_ribbon(aes(ymin = 5, ymax = valor), fill = p) +
  geom_line(color = c1, linewidth = 1) +
  geom_segment(
    aes(x = año, yend = valor, y = 5),
    color = c2,
    linewidth = .5,
    linetype = 3
  ) +
  geom_point(
    shape = 21,
    fill = c2,
    color = c1,
    size = 3,
    stroke = 1.3
  ) +
  geom_label(
    aes(label = label, hjust = hjust, vjust = vjust, size = valor),
    color = c3,
    hjust = 1,
    vjust = 0,
    show.legend = FALSE,
    fill = NA,
    label.padding = unit(0.4, "lines"),
    family = "jet",
    border.color = NA
  ) +
  geom_text(
    aes(y = 5, label = año),
    color = c3,
    family = "jet",
    vjust = rep(c(-.2, 1.2), length.out = nrow(d)),
    size = 4
  ) +
  annotate(
    geom = "richtext",
    x = I(0),
    y = I(.95),
    label = mi_titulo,
    fill = NA,
    color = c3,
    hjust = 0,
    label.color = NA,
    family = "ubuntu",
    size = 10
  ) +
  annotate(
    geom = "richtext",
    x = I(0),
    y = I(.5),
    label = mi_caption,
    hjust = 0,
    vjust = 0,
    color = c3,
    lineheight = 1.4,
    size = 4,
    fill = NA,
    label.color = NA
  ) +
  scale_x_continuous(breaks = scales::breaks_width(2)) +
  scale_size_area(max_size = 5.5) +
  coord_cartesian(ylim = c(5, NA), expand = FALSE, clip = "off") +
  theme_void(base_size = 10) +
  theme(
    plot.background = element_rect(fill = c2),
    plot.margin = margin(t = 50, b = 30, r = 30, l = 30)
  )
Guardo.
ggsave(
  plot = g,
  filename = "tidytuesday/2025/semana_41.png",
  width = 30,
  height = 30,
  units = "cm"
)