# paquetes ----------------------------------------------------------------
library(glue)
library(ggtext)
library(showtext)
library(tidyverse)
# fuente ------------------------------------------------------------------
# colores
col <- viridis::plasma(3)
c1 <- "grey90"
c2 <- "grey60"
c3 <- "black"
# fuente: Ubuntu
font_add(
family = "ubuntu",
regular = "fuente/Ubuntu-Regular.ttf",
bold = "fuente/Ubuntu-Bold.ttf",
italic = "fuente/Ubuntu-Italic.ttf")
# fuente: Victor
font_add(
family = "victor",
regular = "fuente/VictorMono-ExtraLight.ttf",
bold = "fuente/VictorMono-VariableFont_wght.ttf",
italic = "fuente/VictorMono-ExtraLightItalic.ttf")
# fuente: Bebas Neue
font_add(
family = "bebas",
regular = "fuente/BebasNeue-Regular.ttf")
# íconos
font_add("fa-brands", "icon/Font Awesome 6 Brands-Regular-400.otf")
showtext_auto()
showtext_opts(dpi = 300)
# caption
fuente <- glue(
"Datos: <span style='color:{col[1]};'><span style='font-family:mono;'>",
"{{<b>tidytuesdayR</b>}}</span> semana {11}. ",
"R4DS Online Learning Community</span>")
autor <- glue("<span style='color:{col[1]};'>**Víctor Gauto**</span>")
icon_twitter <- glue("<span style='font-family:fa-brands;'></span>")
icon_instagram <- glue("<span style='font-family:fa-brands;'></span>")
icon_github <- glue("<span style='font-family:fa-brands;'></span>")
icon_mastodon <- glue("<span style='font-family:fa-brands;'></span>")
usuario <- glue("<span style='color:{col[1]};'>**vhgauto**</span>")
sep <- glue("**|**")
mi_caption <- glue(
"{fuente}<br>{autor} {sep} {icon_github} {icon_twitter} {icon_instagram} ",
"{icon_mastodon} {usuario}")
# datos -------------------------------------------------------------------
tuesdata <- tidytuesdayR::tt_load(2024, 11)
fiscal <- tuesdata$fiscal_sponsor_directory
# me interesa sumar las organizaciones por década, y agregar los nombres de
# algunas
# nombres de las etiquetas
d_label <- fiscal |>
select(name, year_501c3) |>
drop_na() |>
mutate(decada = year_501c3 - year_501c3 %% 10) |>
mutate(n = n(), .by = decada) |>
slice_sample(n = 5, by = decada) |>
mutate(n_name = n - n(), .by = decada) |>
reframe(
label = str_flatten_comma(name),
.by = c(decada, n_name)
) |>
mutate(
l = if_else(
n_name != 0,
str_c(label, glue(" y {n_name} más.")),
glue("{label}.")
)
) |>
mutate(l = str_wrap(l, 65))
d <- fiscal |>
select(name, year_501c3) |>
drop_na() |>
mutate(decada = year_501c3 - year_501c3 %% 10) |>
count(decada) |>
inner_join(d_label, by = join_by(decada)) |>
mutate(decada = factor(decada))
# puntos, para geom_jitter()
d_punto <- d |>
select(decada, n) |>
mutate(p = map(n, ~ seq(1, .x, 1))) |>
unnest(p)
# figura ------------------------------------------------------------------
# subtítulo y eje vertical
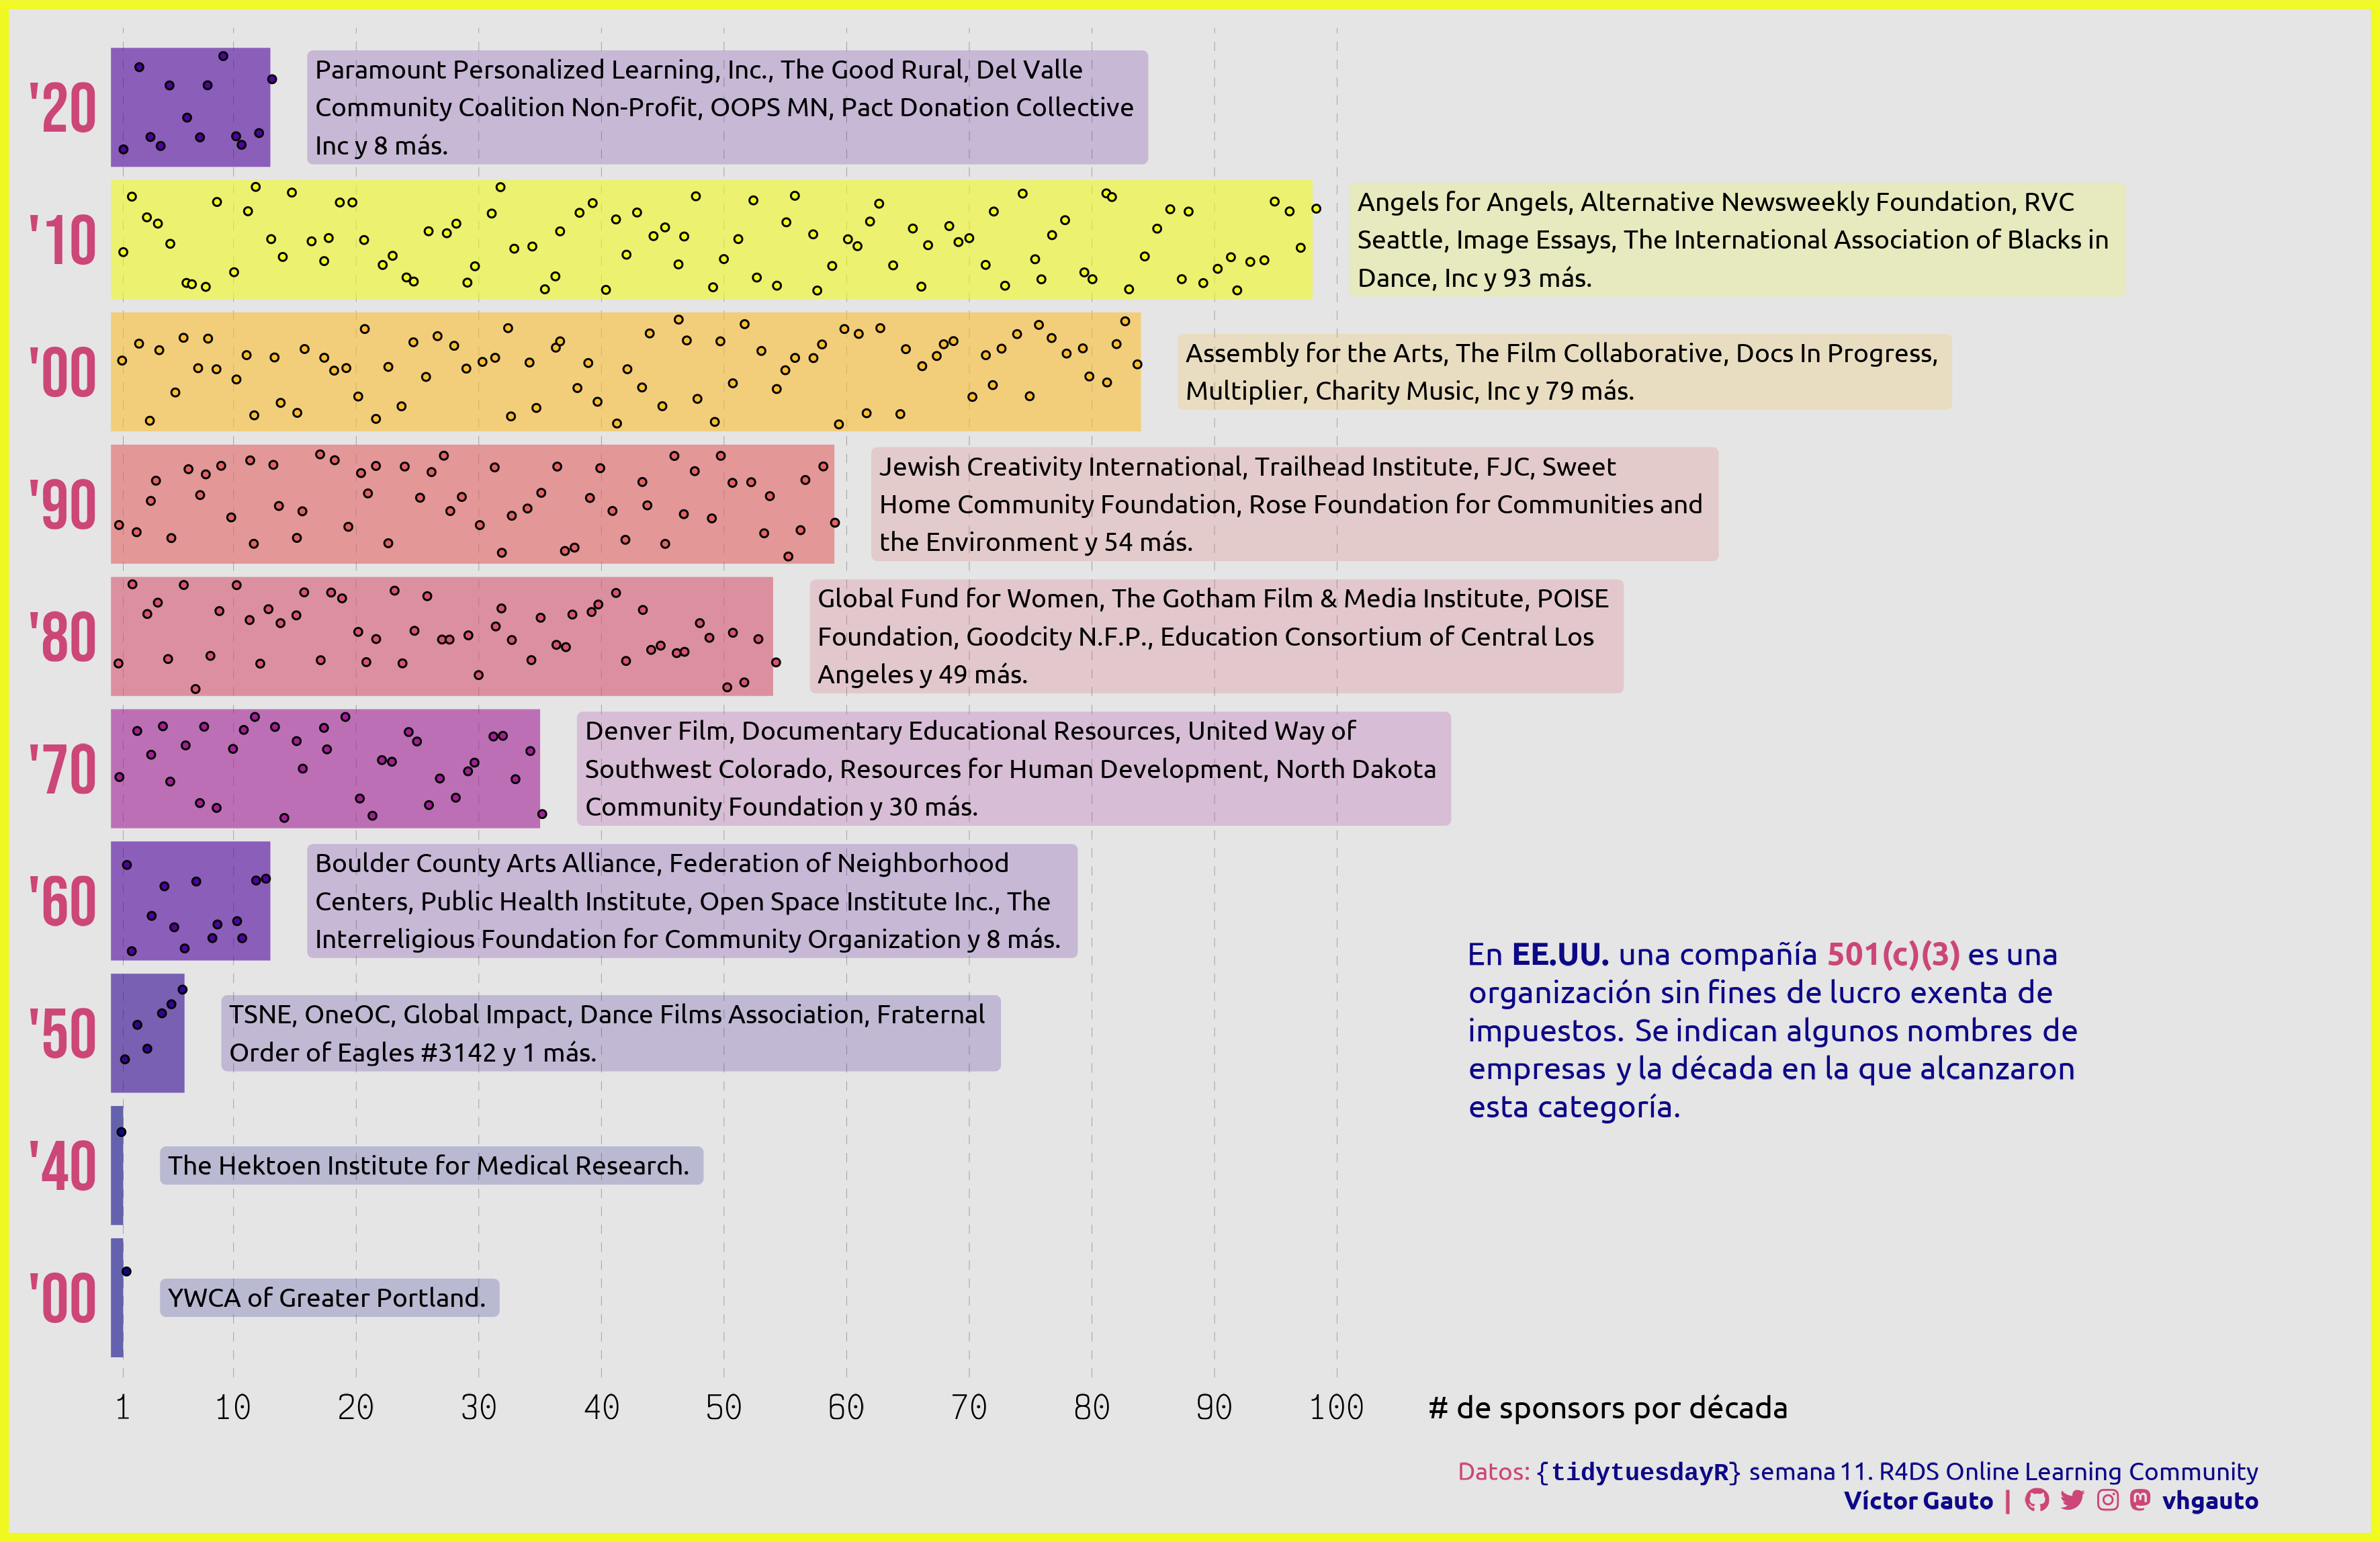
mi_subtitle <- glue(
"En <b>EE.UU.</b> una compañía ",
"<b style='color:{col[2]}'>501(**c**)(3)</b> es una<br>",
"organización sin fines de lucro exenta de<br>",
"impuestos. Se indican algunos nombres de<br>",
"empresas y la década en la que alcanzaron<br>",
"esta categoría."
)
dec <- d$decada |>
as.character() |>
as.integer() |>
str_sub(3, 4)
eje_y <- glue("'{dec}")
# figura
g <- ggplot(d, aes(n, decada)) +
geom_col(aes(fill = n), alpha = .6, color = NA, show.legend = FALSE) +
geom_label(
aes(x = n+3, label = l, fill = n), hjust = 0, size = 3.3, alpha = .2,
family = "ubuntu", label.size = 0, show.legend = FALSE) +
geom_point(
data = d_punto, aes(p, decada, fill = n), size = 1, alpha = 1,
position = position_jitter(seed = 2024),
show.legend = FALSE, color = c3, shape = 21) +
annotate(
geom = "richtext", x = 110, y = 3, label = mi_subtitle, family = "ubuntu",
hjust = 0, size = 4, color = col[1], fill = NA, label.color = NA) +
scale_x_continuous(
breaks = c(1, seq(10, 100, 10)), expand = c(0, 0)) +
scale_y_discrete(labels = eje_y) +
scale_color_viridis_c(option = "plasma") +
scale_fill_viridis_c(option = "plasma") +
coord_cartesian(clip = "off") +
labs(y = NULL, x = "# de sponsors por década", caption = mi_caption) +
theme_void() +
theme(
aspect.ratio = 1,
plot.margin = margin(t = 10, r = 330, b = 10, l = 10),
plot.background = element_rect(fill = c1, color = col[3], linewidth = 3),
plot.caption = element_markdown(
family = "ubuntu", margin = margin(t = 15, r = -300), color = col[2],
lineheight = unit(1.2, "line")),
axis.text.x = element_text(margin = margin(t = 5), family = "victor"),
axis.text.y = element_text(
vjust = .5, margin = margin(r = 5), size = 25, family = "bebas",
color = col[2]),
axis.title.x = element_text(
family = "ubuntu", hjust = 1.33, margin = margin(t = -10)),
panel.grid.major.x = element_line(
linetype = "ff", linewidth = .1, color = c2)
)
# guardo
ggsave(
plot = g,
filename = "2024/s11/viz.png",
width = 30,
height = 19.435,
units = "cm")
# abro
browseURL("2024/s11/viz.png")