Ocultar código
library(glue)
library(ggtext)
library(showtext)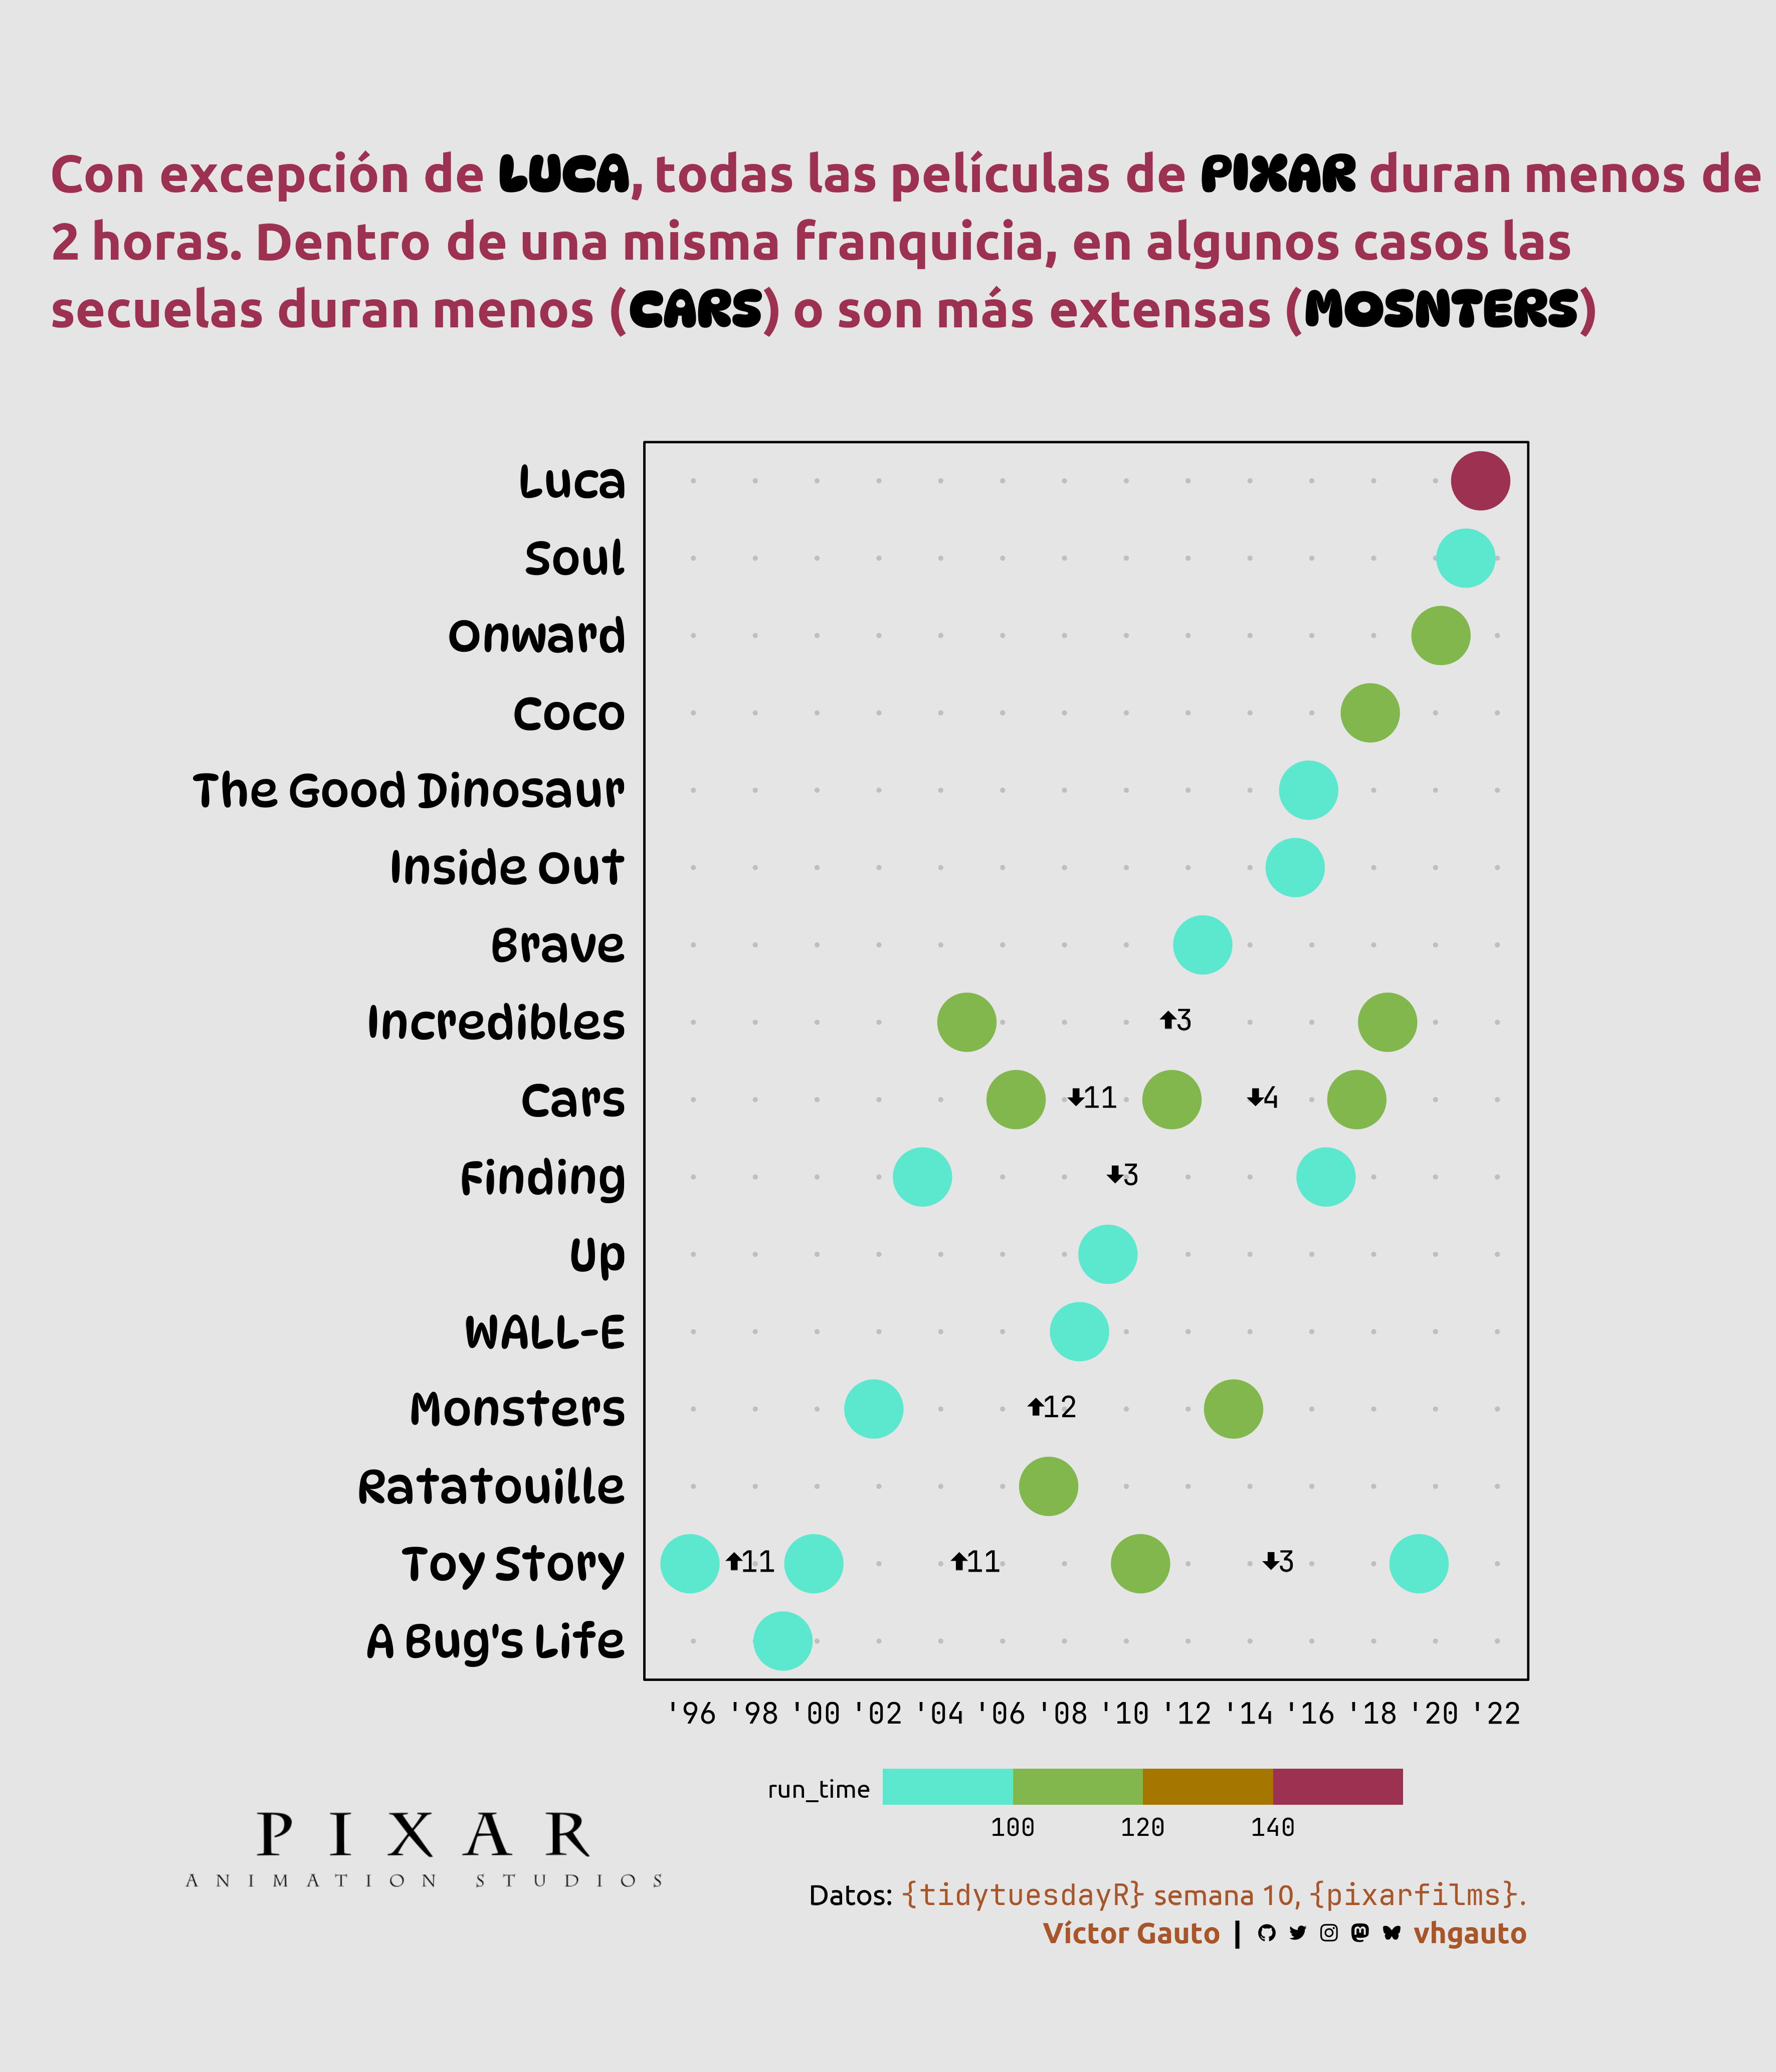
library(tidyverse)Duración de películas de Píxar y cambios entre franquicias.
library(glue)
library(ggtext)
library(showtext)
library(tidyverse)f_est <- function(x) {
paste0("<b style='font-family: dynapuff; color: black'>", x, "</b>")
}Colores.
c1 <- "#9D3151"
c2 <- "#A75529"
c3 <- "grey90"
c4 <- "grey75"
c5 <- "black"
Fuentes: Ubuntu, JetBrains Mono y Barriecito.
font_add(
  family = "ubuntu",
  regular = "././fuente/Ubuntu-Regular.ttf",
  bold = "././fuente/Ubuntu-Bold.ttf",
  italic = "././fuente/Ubuntu-Italic.ttf"
)

font_add(
  family = "jet",
  regular = "././fuente/JetBrainsMonoNLNerdFontMono-Regular.ttf"
)

font_add_google(name = "DynaPuff", family = "dynapuff", db_cache = FALSE)

showtext_auto()
showtext_opts(dpi = 300)fuente <- glue(
"Datos: <span style='color:{c2};'><span style='font-family:jet;'>",
"{{<b>tidytuesdayR</b>}}</span> semana 10, ",
"<b style='font-family:jet;'>{{pixarfilms}}</b>.</span>"
)
autor <- glue("<span style='color:{c2};'>**Víctor Gauto**</span>")
icon_twitter <- glue("<span style='font-family:jet;'></span>")
icon_instagram <- glue("<span style='font-family:jet;'></span>")
icon_github <- glue("<span style='font-family:jet;'></span>")
icon_mastodon <- glue("<span style='font-family:jet;'>󰫑</span>")
icon_bsky <- glue("<span style='font-family:jet;'></span>")
usuario <- glue("<span style='color:{c2};'>**vhgauto**</span>")
sep <- glue("**|**")
mi_caption <- glue(
"{fuente}<br>{autor} {sep} {icon_github} {icon_twitter} {icon_instagram} ",
"{icon_mastodon} {icon_bsky} {usuario}"
)tuesdata <- tidytuesdayR::tt_load(2025, 10)
pixar_films <- tuesdata$pixar_filmsMe interesa la diferencia de tiempo entre películas de la misma franquicia, y ver la duración total de cada película con su fecha de estreno.
d <- pixar_films |>
  drop_na() |>
  select(film, release_date, run_time, film_rating) |>
  mutate(
    franq = case_when(
      str_detect(film, "Toy") ~ "Toy Story",
      str_detect(film, "Cars") ~ "Cars",
      str_detect(film, "Finding") ~ "Finding",
      str_detect(film, "Incredibles") ~ "Incredibles",
      str_detect(film, "Monsters") ~ "Monsters",
      .default = film
    )
  ) |>
  arrange(release_date) |>
  mutate(franq = fct_reorder(franq, release_date))
Agrego íconos de flechas y extraigo todas las franquicias.
i_arriba <- glue("<span style='font-family:jet;'>󰜷</span>")
i_abajo <- glue("<span style='font-family:jet;'>󰜮</span>")
franquicias <- d |>
count(franq) |>
filter(n > 1) |>
pull(franq)Obtengo el punto medio entre dos películas para cada franquicia.
d2 <- d |>
  select(-film_rating) |>
  filter(franq %in% franquicias) |>
  nest(.by = franq) |>
  mutate(
    dif_fecha = map(.x = data, ~ .x |> mutate(l_fecha = lag(release_date))),
    dif_time = map(.x = data, ~ .x |> mutate(l_time = lag(run_time)))
  ) |>
  unnest(dif_fecha, dif_time) |>
  select(-data, -ends_with("1")) |>
  mutate(
    fecha_m = release_date + (l_fecha - release_date)/2,
    time_m = run_time - l_time
  ) |>
  mutate(
    time_m = if_else(
      time_m > 0,
      paste0(i_arriba, time_m),
      paste0(i_abajo, abs(time_m))
    )
)Logo de PíXAR, grilla de puntos para poder al fondo y título.
link <- "https://upload.wikimedia.org/wikipedia/commons/thumb/4/40/Pixar_logo.svg/640px-Pixar_logo.svg.png"
logo <- glue("<img src='{link}' width=230 />")

p <- expand_grid(
  x = seq.Date(from = ymd(19960101), to = ymd(20220101), by = "2 year"),
  y = unique(d$franq)
)

mi_titulo <- glue(
  "Con excepción de {f_est('LUCA')}, todas
  las películas de {f_est('PIXAR')} duran menos de<br>
  2 horas. Dentro de una misma franquicia, en algunos casos las<br>
  secuelas duran menos ({f_est('CARS')}) o son más extensas
  ({f_est('MOSNTERS')})"
)
Figura.
g <- ggplot(d, aes(release_date, franq, color = run_time)) +
  geom_point(
    data = p, aes(x, y), color = c4, size = .5, inherit.aes = FALSE
  ) +
  geom_point(size = 12, stroke = 1) +
  geom_richtext(
    data = d2, aes(fecha_m, label = time_m), size = 5, fill = NA,
    label.size = unit(0, "mm"), family = "jet", color = c5
  ) +
  annotate(
    geom = "richtext", x = I(-.25), y = I(-1.7), label = logo, fill = NA,
    label.color = NA
  ) +
  scale_x_date(
    date_breaks = "2 year",
    date_labels = "'%y"
  ) +
  colorspace::scale_color_binned_sequential(
    palette = "Hawaii"
  ) +
  coord_cartesian(
    xlim = ymd(c("19940601", "20230101")), ylim = c(.5, 16.5), expand = FALSE,
    clip = "off"
  ) +
  labs(
    x = NULL, y = NULL, fill = "Duración\n(min)", title = mi_titulo,
    caption = mi_caption
  ) +
  ggthemes::theme_par(base_family = "ubuntu") +
  theme(
    aspect.ratio = 1.4,
    plot.background = element_rect(fill = c3, color = NA),
    plot.title = element_markdown(
      color = c1, size = 25, margin = margin(b = 50, l = -65), lineheight = 1.3,
      hjust = 0
    ),
    plot.title.position = "plot",
    plot.caption = element_markdown(
      size = 14, margin = margin(t = 15), lineheight = 1.3
    ),
    axis.text.x = element_text(family = "jet", size = 14),
    axis.text.y = element_text(hjust = 1, family = "dynapuff", size = 22),
    axis.ticks = element_blank(),
    legend.position = "bottom",
    legend.key.width = unit(50, "pt"),
    legend.background = element_blank(),
    legend.text = element_text(family = "jet"),
    legend.title = element_text(
      margin = margin(b = 15, r = 5), family = "ubuntu"
    )
  )
Guardo.
ggsave(
  plot = g,
  filename = "tidytuesday/2025/semana_10.png",
  width = 30,
  height = 35,
  units = "cm"
)