# paquetes ----------------------------------------------------------------
library(glue)
library(ggtext)
library(showtext)
library(tidyverse)
# fuente ------------------------------------------------------------------
# colores
cc <- PrettyCols::prettycols(palette = "Dark")
c1 <- "grey20"
c2 <- "black"
c3 <- "grey95"
# fuente: Ubuntu
font_add(
family = "ubuntu",
regular = "fuente/Ubuntu-Regular.ttf",
bold = "fuente/Ubuntu-Bold.ttf",
italic = "fuente/Ubuntu-Italic.ttf"
)
# monoespacio & íconos
font_add(
family = "jet",
regular = "fuente/JetBrainsMonoNLNerdFontMono-Regular.ttf"
)
# Bebas Neue
font_add(
family = "bebas",
regular = "fuente/BebasNeue-Regular.ttf"
)
showtext_auto()
showtext_opts(dpi = 300)
# caption
fuente <- glue(
"Datos: <span style='color:{cc[2]};'><span style='font-family:jet;'>",
"{{<b>tidytuesdayR</b>}}</span> semana {50}, ",
"<b>Parfumo</b>.</span>"
)
autor <- glue("<span style='color:{cc[2]};'>**Víctor Gauto**</span>")
icon_twitter <- glue("<span style='font-family:jet;'></span>")
icon_instagram <- glue("<span style='font-family:jet;'></span>")
icon_github <- glue("<span style='font-family:jet;'></span>")
icon_mastodon <- glue("<span style='font-family:jet;'>󰫑</span>")
icon_bsky <- glue("<span style='font-family:jet;'></span>")
usuario <- glue("<span style='color:{cc[2]};'>**vhgauto**</span>")
sep <- glue("**|**")
mi_caption <- glue(
"{fuente}<br>{autor} {sep} {icon_github} {icon_twitter} {icon_instagram} ",
"{icon_mastodon} {icon_bsky} {usuario}"
)
# datos -------------------------------------------------------------------
tuesdata <- tidytuesdayR::tt_load(2024, 50)
parfumo <- tuesdata$parfumo_data_clean
# me interesan las fragancias principales y la cantidad de veces que se usó
# desde el 1900
# las 9 fragancias principales
top_accords <- parfumo |>
select(Main_Accords) |>
drop_na() |>
separate_longer_delim(
cols = Main_Accords,
delim = ", "
) |>
count(Main_Accords, sort = TRUE) |>
slice_max(order_by = n, n = 9) |>
pull(Main_Accords)
# obtengo la cantidad de fragancias por año
d <- parfumo |>
select(Release_Year, Main_Accords) |>
drop_na() |>
separate_longer_delim(
cols = Main_Accords,
delim = ", "
) |>
filter(Main_Accords %in% top_accords) |>
count(Release_Year, Main_Accords) |>
filter(between(Release_Year, 1900, 2023)) |>
mutate(Main_Accords = fct_reorder(Main_Accords, n, max)) |>
mutate(Main_Accords = fct_rev(Main_Accords)) |>
filter(n >= 5)
# figura ------------------------------------------------------------------
# datos para el fondo de cada panel
rect_tbl <- tibble(
xmin = 1900,
xmax = 2025,
ymin = 0,
ymax = 1000,
Main_Accords = unique(d$Main_Accords)
)
# etiquetas de las fragancias (strip)
burbujas <- "<span style='font-family:jet;'>󰗣</span>"
esencias <- sort(unique(d$Main_Accords))
esencias_label <- glue(
"<b style='color:{c(cc, cc[1:4])}'>{burbujas} {esencias} {burbujas}</b>"
)
esencias_label <- set_names(esencias_label, esencias)
# eje horizontal
eje_x <- c(seq(1900, 2000, 25), max(d$Release_Year))
# logo de Parfumo
logo <- "https://images.parfumo.de/logos/logo.png"
logo_label <- glue("<img src='{logo}' width=120 />")
logo_tbl <- tibble(
x = 1900,
y = -375,
label = logo_label,
Main_Accords = factor("Citrus")
)
# subtítulo
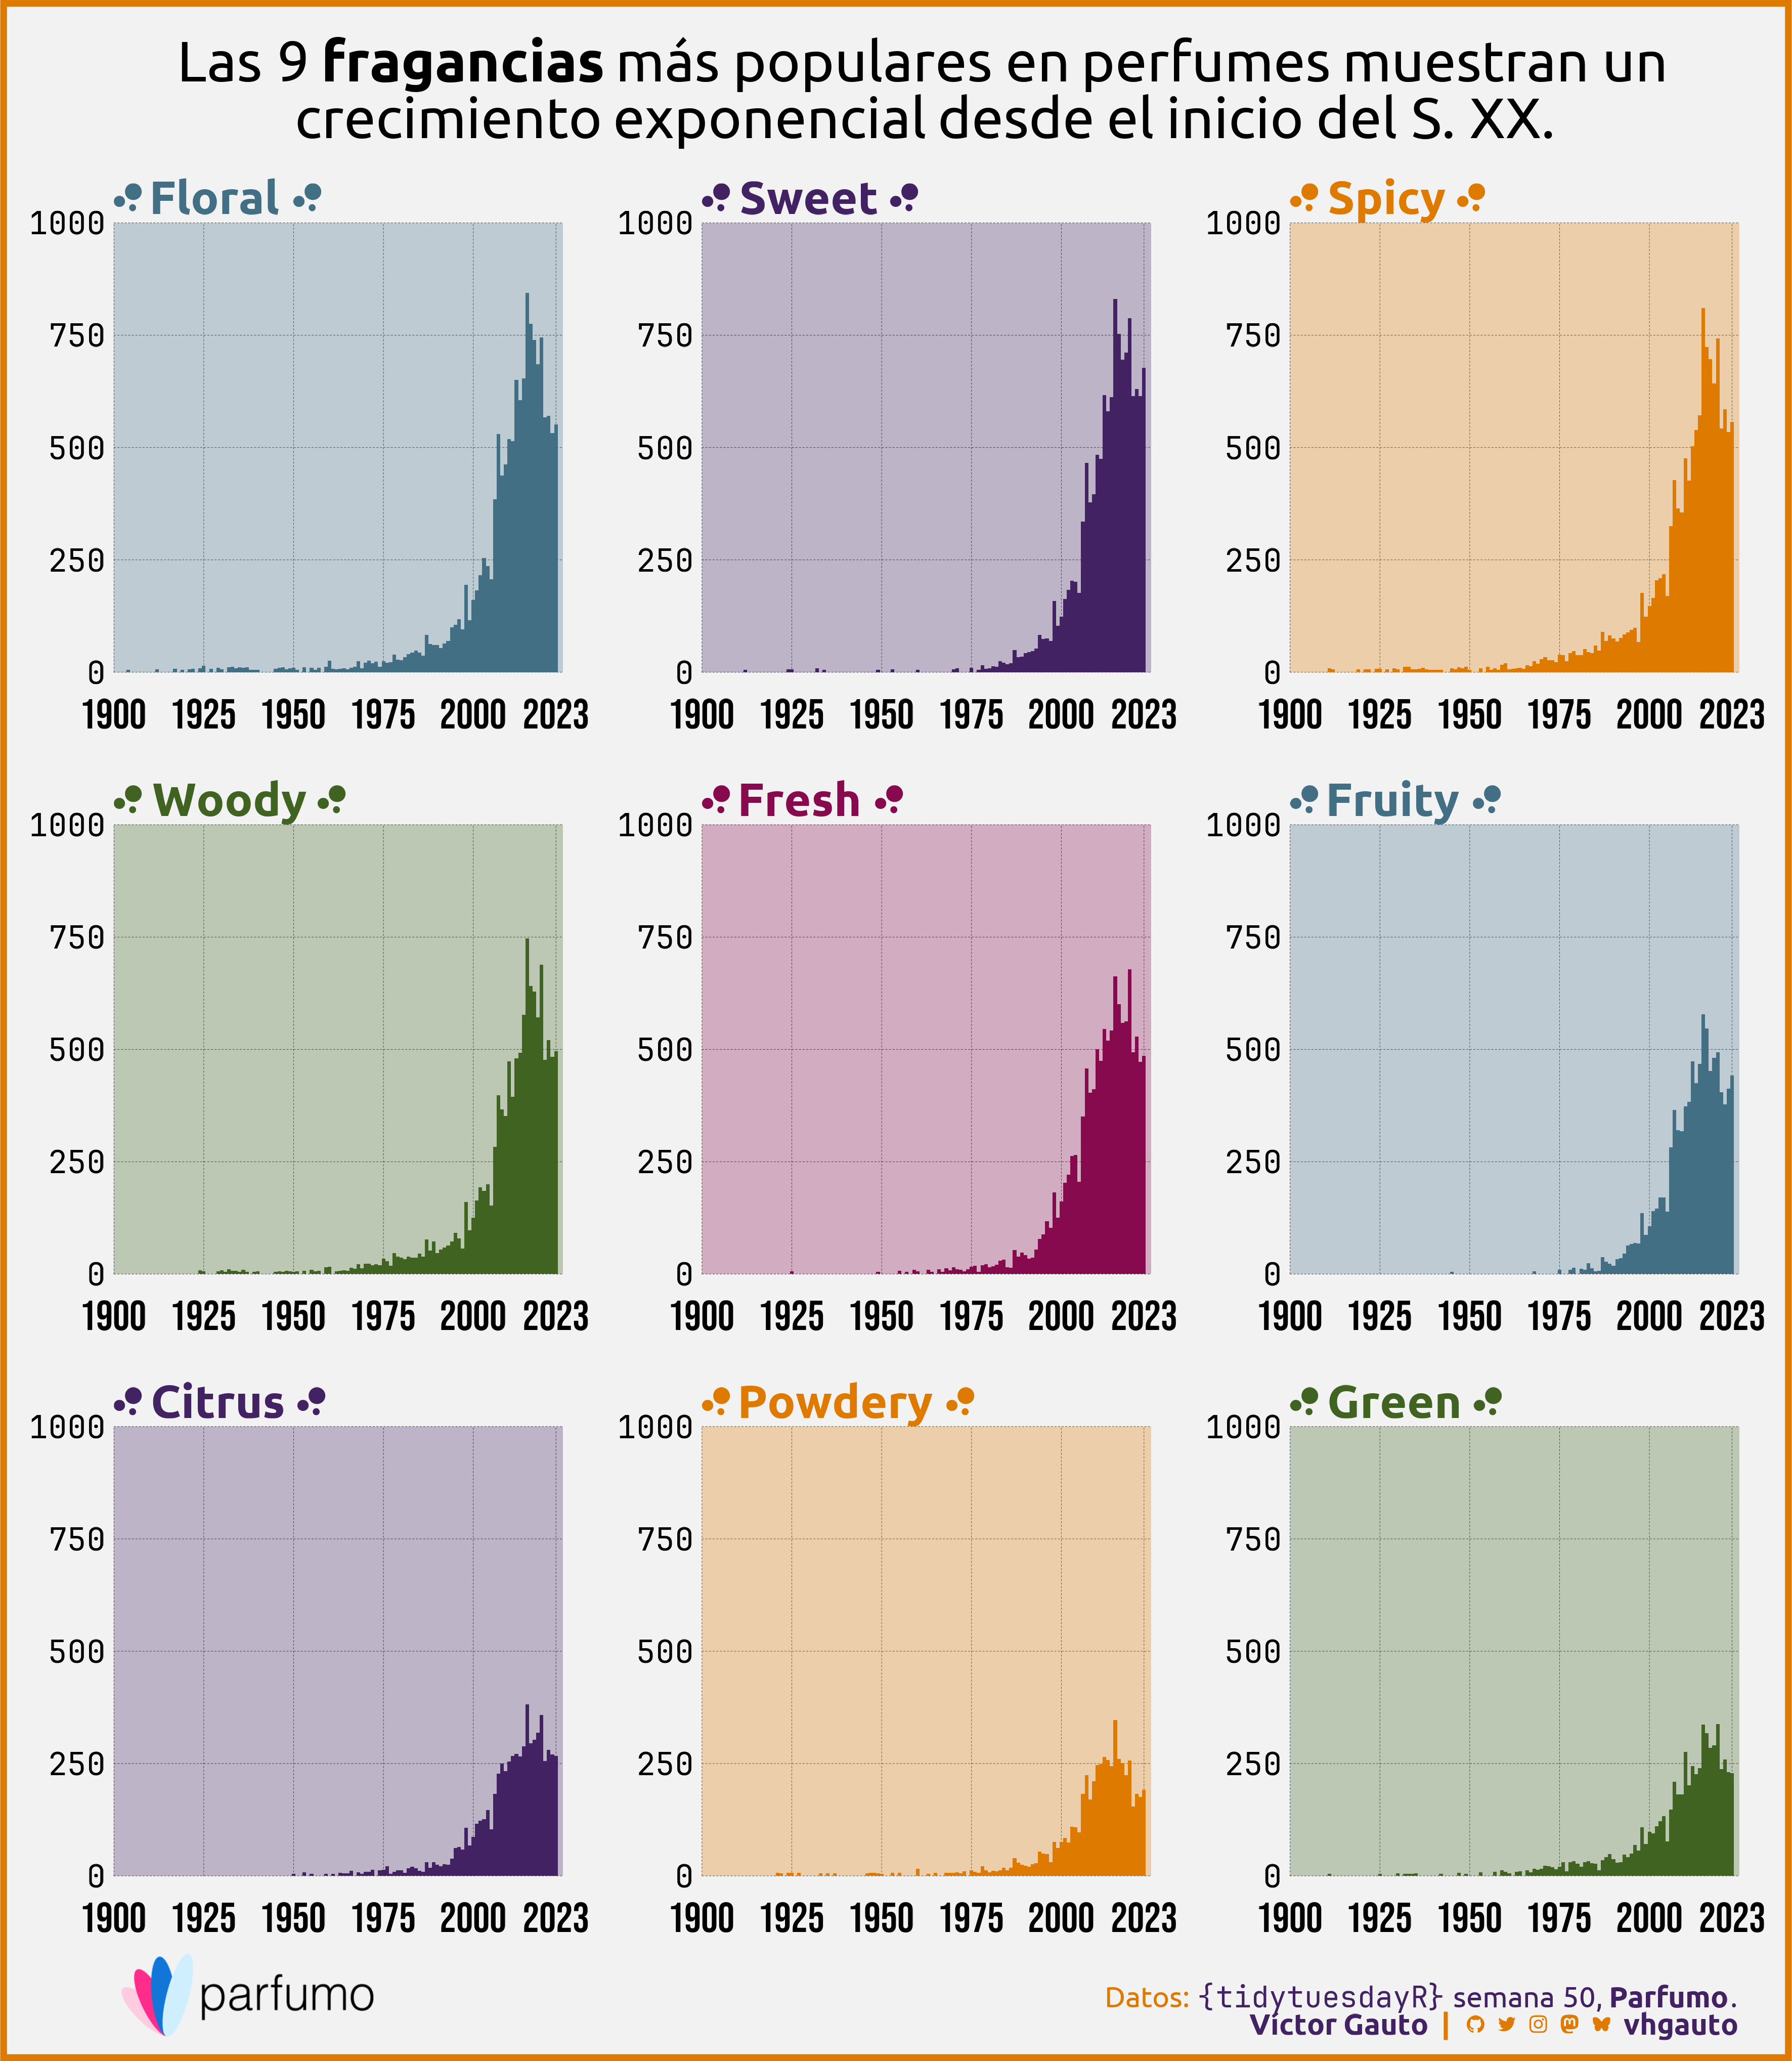
mi_subtitulo <- glue(
"Las 9 <b>fragancias</b> más populares en perfumes muestran un<br>",
"crecimiento exponencial desde el inicio del S. XX."
)
# figura
g <- ggplot(d, aes(Release_Year, n, color = Main_Accords, fill = Main_Accords)) +
geom_rect(
data = rect_tbl, inherit.aes = FALSE, show.legend = FALSE,
aes(xmin = xmin, xmax = xmax, ymin = ymin, ymax = ymax, fill = Main_Accords)
) +
geom_col(
color = NA,show.legend = FALSE, alpha = 1, width = 1
) +
geom_richtext(
data = logo_tbl, aes(x, y, label = logo_label), hjust = 0,
vjust = 0, fill = NA, label.color = NA, show.legend = FALSE
) +
facet_wrap(
vars(Main_Accords), nrow = 3, scales = "free",
labeller = as_labeller(esencias_label)
) +
scale_x_continuous(
breaks = eje_x,
limits = c(1900, 2025),
labels = eje_x,
expand = c(0, 0)
) +
scale_y_continuous(
expand = c(0, 0)
) +
scale_fill_manual(
values = alpha(c(cc, cc), .3)
) +
scale_color_manual(
values = c(cc, cc)
) +
coord_cartesian(clip = "off", xlim = c(1900, 2025), ylim = c(0, 1000)) +
labs(x = NULL, subtitle = mi_subtitulo, caption = mi_caption) +
theme_void(base_size = 15) +
theme(
aspect.ratio = 1,
plot.margin = margin(r = 25, l = 13, b = 5, t = 5),
plot.background = element_rect(fill = c3, color = cc[3], linewidth = 3),
plot.subtitle = element_markdown(
family = "ubuntu", color = c2, size = 27, margin = margin(t = 15, b = 15),
hjust = .5, lineheight = 1
),
plot.caption = element_markdown(
family = "ubuntu", color = cc[3], margin = margin(t = 25, b = 5),
size = 14
),
panel.spacing = unit(25, "pt"),
panel.grid.major = element_line(
color = c1, linewidth = .1, linetype = 2
),
axis.text.x = element_text(
family = "bebas", color = c2, margin = margin(t = 12), size = 20
),
axis.text.y = element_text(
family = "jet", color = c2, margin = margin(r = 5), hjust = 1
),
strip.background = element_blank(),
strip.text = element_markdown(
family = "ubuntu", hjust = 0, margin = margin(b = 0), size = 22
)
)
# guardo
ggsave(
plot = g,
filename = "2024/s50/viz.png",
width = 30,
height = 34.5,
units = "cm"
)
# abro
browseURL(paste0(getwd(), "/2024/s50/viz.png"))