# paquetes ----------------------------------------------------------------
library(glue)
library(ggtext)
library(showtext)
library(tidyverse)
# fuente ------------------------------------------------------------------
# colores
c1 <- "#185461"
c2 <- "#D8DEE9"
c3 <- "#ECEFF4"
c4 <- "black"
c5 <- "white"
c6 <- "#001959"
# fuente: Ubuntu
font_add(
family = "ubuntu",
regular = "fuente/Ubuntu-Regular.ttf",
bold = "fuente/Ubuntu-Bold.ttf",
italic = "fuente/Ubuntu-Italic.ttf"
)
# monoespacio & íconos
font_add(
family = "jet",
regular = "fuente/JetBrainsMonoNLNerdFontMono-Regular.ttf"
)
showtext_auto()
showtext_opts(dpi = 300)
# caption
fuente <- glue(
"Datos: <span style='color:{c1};'><span style='font-family:jet;'>",
"{{<b>tidytuesdayR</b>}}</span> semana {53}, ",
"<b>James Beard Awards</b>, PythonCoderUnicorn.</span>"
)
autor <- glue("<span style='color:{c1};'>**Víctor Gauto**</span>")
icon_twitter <- glue("<span style='font-family:jet;'></span>")
icon_instagram <- glue("<span style='font-family:jet;'></span>")
icon_github <- glue("<span style='font-family:jet;'></span>")
icon_mastodon <- glue("<span style='font-family:jet;'>󰫑</span>")
icon_bsky <- glue("<span style='font-family:jet;'></span>")
usuario <- glue("<span style='color:{c1};'>**vhgauto**</span>")
sep <- glue("**|**")
mi_caption <- glue(
"{fuente}<br>{autor} {sep} {icon_github} {icon_twitter} {icon_instagram} ",
"{icon_mastodon} {icon_bsky} {usuario}"
)
# datos -------------------------------------------------------------------
tuesdata <- tidytuesdayR::tt_load(2024, 53)
restaurant_and_chef <- tuesdata$restaurant_and_chef
# me interesa un mapa con la cantidad de ganadores por Estado
# obtengo cantidad de ganadores y nombre del Estado
d <- restaurant_and_chef |>
filter(rank == "Winner") |>
filter(str_detect(city, ",")) |>
separate_wider_delim(
cols = city,
delim = ", ",
names = c("ciudad", "estado_nombre")
) |>
count(estado_nombre, sort = TRUE)
# mapa de EEUU
usa_sf <- rgeoboundaries::gb_adm1(country = "USA") |>
select("estado_nombre" = shapeName)
# remuevo Hawaii para obtener únicamente la parte continental
d_sf <- inner_join(d, usa_sf, by = join_by(estado_nombre)) |>
filter(estado_nombre != "Hawaii") |>
sf::st_as_sf()
# recorto USA a la extensión
ext <- sf::st_bbox(d_sf) |>
sf::st_as_sfc()
usa_crop_sf <- sf::st_intersection(usa_sf, ext) |>
sf::st_drop_geometry()
# todos los Estados continentales
estados_cont <- inner_join(usa_sf, usa_crop_sf, by = join_by(estado_nombre))
# divido en rangos
d_sf <- full_join(d, estados_cont, by = join_by(estado_nombre)) |>
sf::st_as_sf() |>
sf::st_transform(crs = sf::st_crs("ESRI:102003")) |>
mutate(rango = cut_width(n, 10)) |>
mutate(lim_i = str_extract(rango, "(?<=\(|\[)[-0-9.]+")) |>
mutate(lim_s = str_extract(rango, "(?<=,)[-0-9.]+(?=\]|\))")) |>
mutate(
r = if_else(
lim_i < 0,
paste0("<", lim_s),
paste0(lim_i, "-", lim_s)
)
) |>
mutate(r = fct_reorder(r, n, .na_rm = TRUE, .desc = TRUE))
# figura ------------------------------------------------------------------
# agrego las capitales de Estado
capitales <- maps::us.cities |>
as_tibble() |>
filter(capital == 2) |>
sf::st_as_sf(coords = c("long", "lat"), crs = 4326) |>
sf::st_intersection(ext) |>
sf::st_transform(crs = sf::st_crs("ESRI:102003")) |>
sf::st_as_sfc()
# logo y top 2 Estados
logo <- "https://pbs.twimg.com/profile_images/1138814510528114691/plI3Ufxt_400x400.png"
logo_label <- glue("<img src='{logo}' width=100 />")
ny <- slice(d_sf, 1)
ca <- slice(d_sf, 2)
# subtítulo
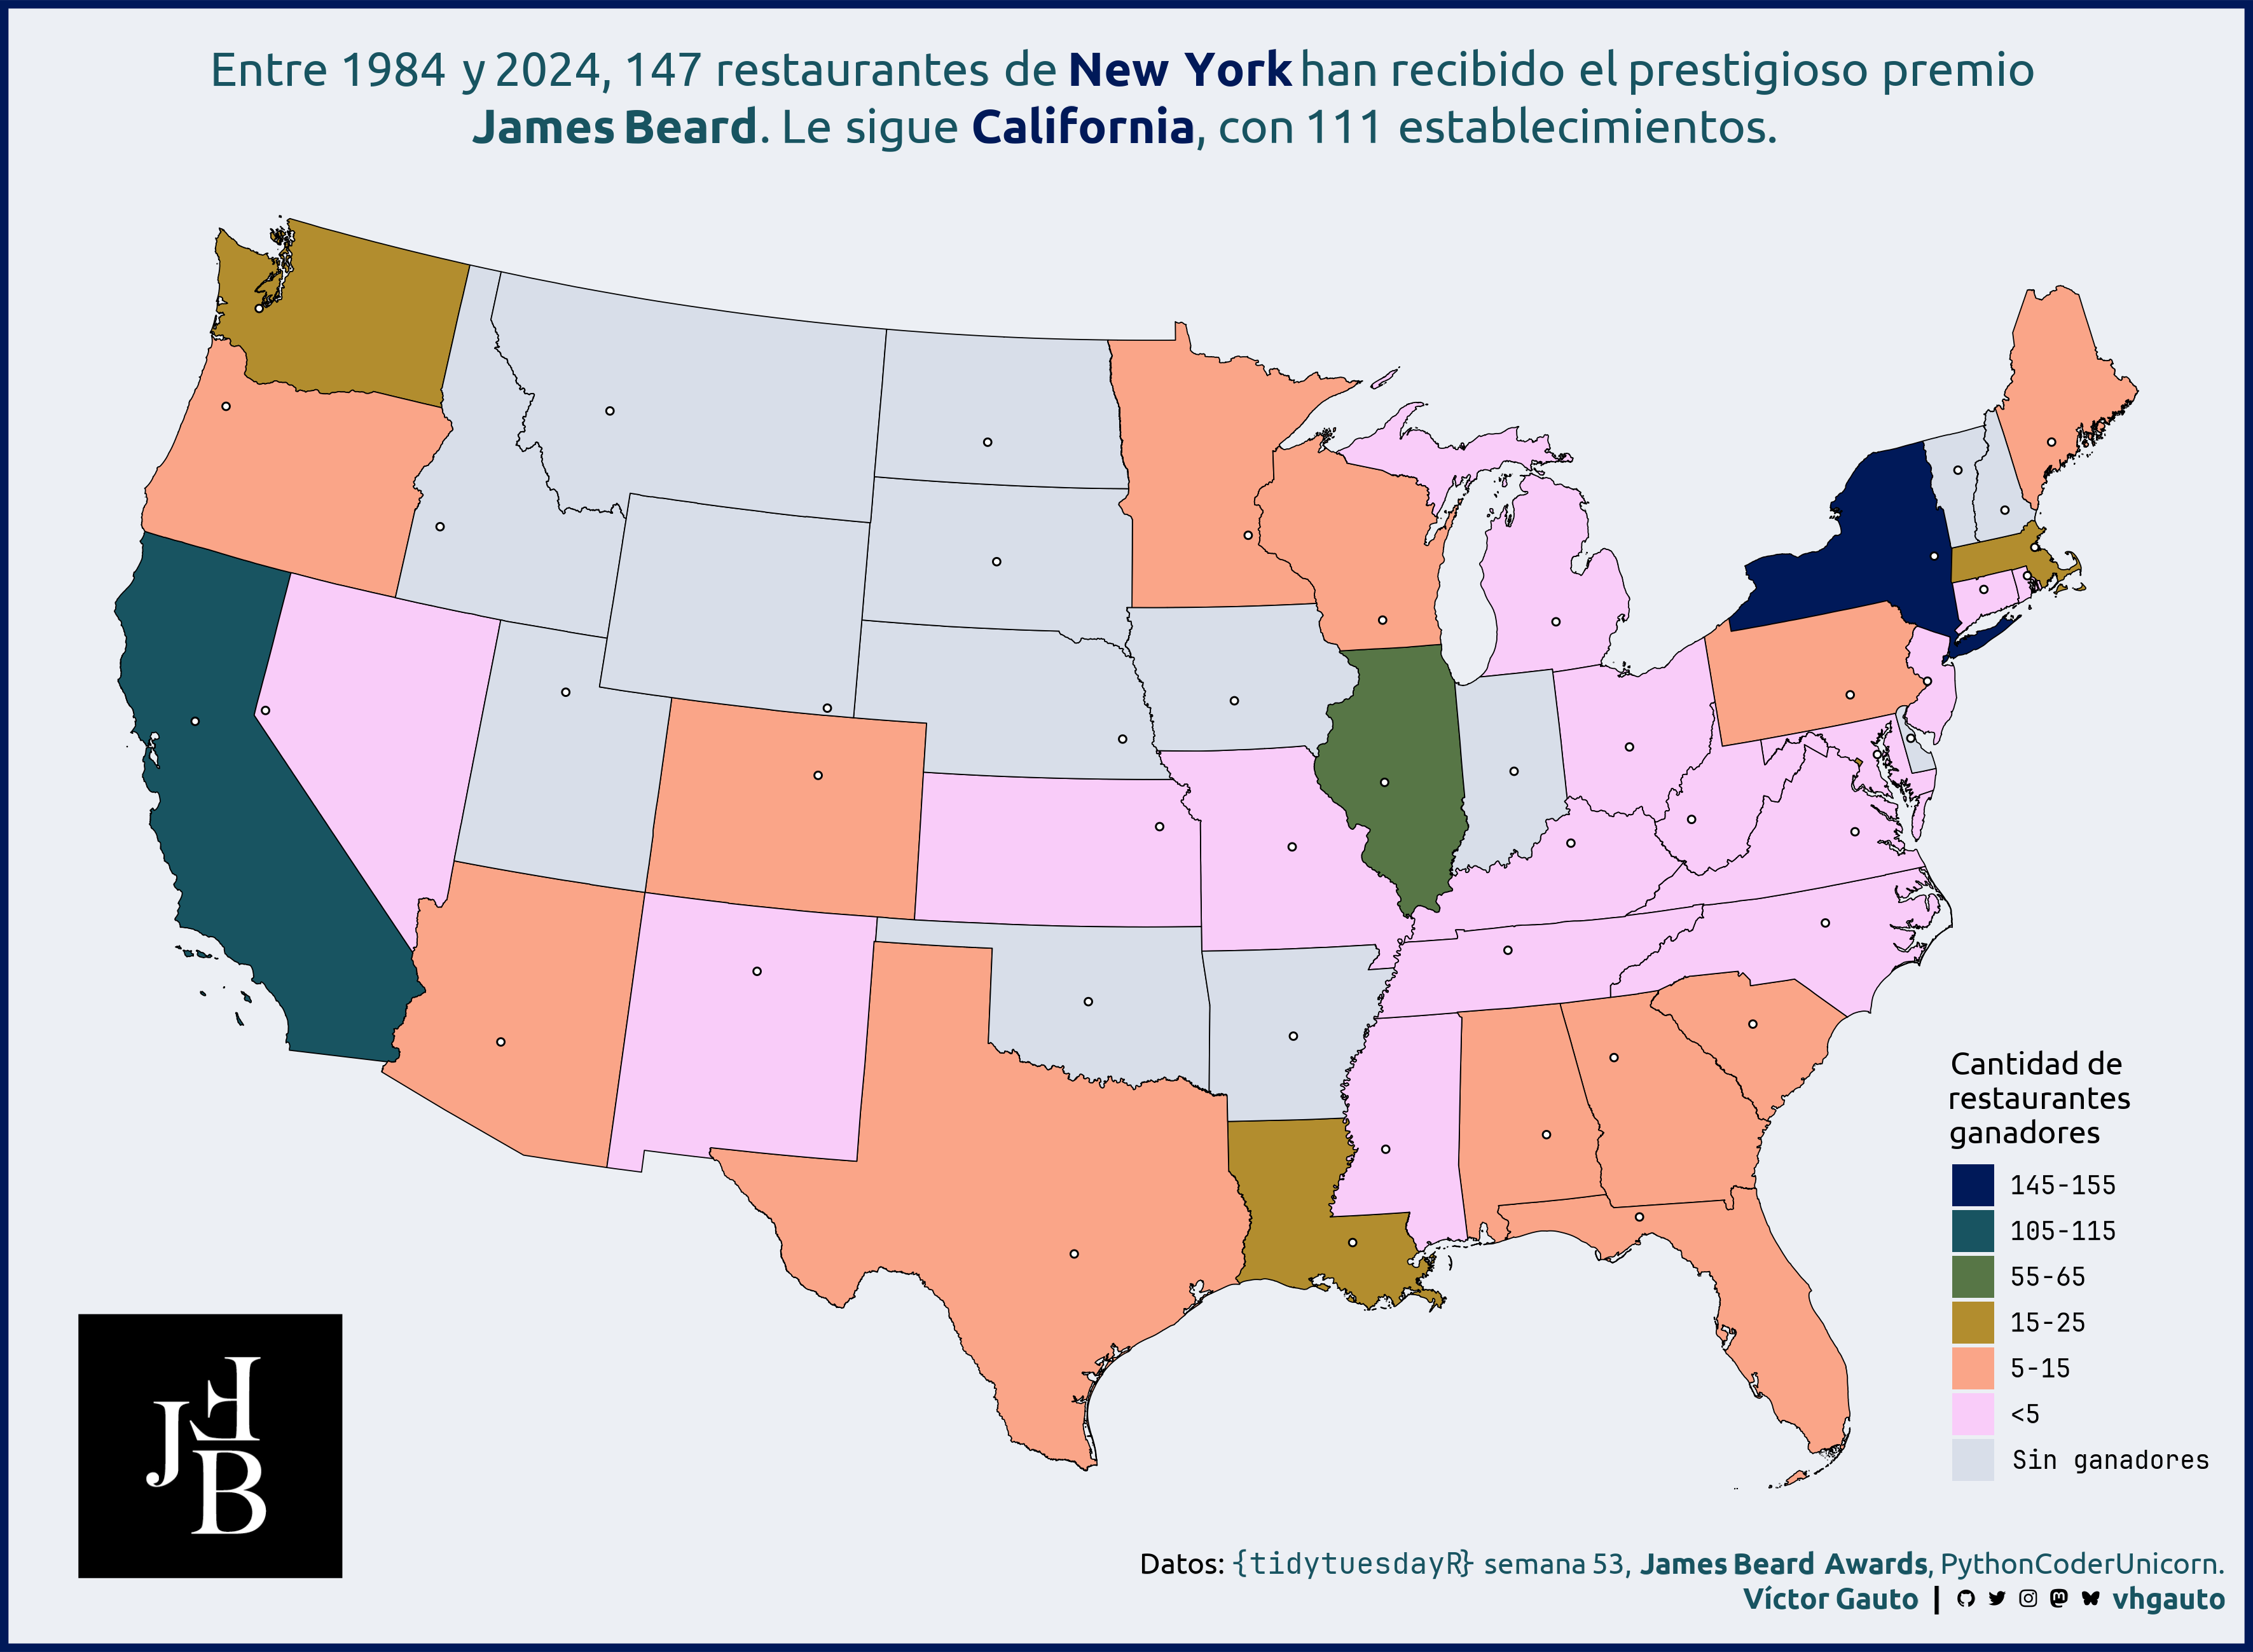
mi_subtitulo <- glue(
"Entre 1984 y 2024, {ny$n} restaurantes de <b style='color:{c6}'>New York</b>
han recibido el prestigioso premio<br> <b>James Beard</b>. Le sigue
<b style='color:{c6}'>California</b>, con {ca$n} establecimientos."
)
# figura
g <- ggplot() +
geom_sf(data = d_sf, aes(fill = r), color = c4) +
geom_sf(
data = capitales, shape = 21, fill = c5, color = c4, size = 1
) +
annotate(
geom = "richtext", x = I(.025), y = -I(.025), label = logo_label, hjust = 0,
vjust = 0, fill = NA, label.color = NA
) +
scico::scale_fill_scico_d(
palette = "batlow",
na.value = c2,
labels = c(as.character(sort(unique(d_sf$r)))[1:6], "Sin ganadores")
) +
coord_sf(clip = "off") +
guides(
fill = guide_legend(override.aes = list(color = NA))
) +
labs(
subtitle = mi_subtitulo,
fill = "Cantidad denrestaurantesnganadores",
caption = mi_caption
) +
theme_void(base_size = 12, base_family = "ubuntu") +
theme(
plot.background = element_rect(fill = c3, color = c6, linewidth = 3),
plot.margin = margin(b = 14.3, l = 5, r = 5, t = 14),
plot.subtitle = element_markdown(
color = c1, size = 18, hjust = .5, lineheight = 1.2
),
plot.caption = element_markdown(
color = c4, lineheight = 1.2, size = 11, margin = margin(r = 5)
),
legend.title = element_text(),
legend.text = element_text(family = "jet"),
legend.position = "inside",
legend.position.inside = c(.87, .05),
legend.justification = c(0, 0)
)
# guardo
ggsave(
plot = g,
filename = "2024/s53/viz.png",
width = 30,
height = 22,
units = "cm"
)
# abro
browseURL(paste0(getwd(), "/2024/s53/viz.png"))