# paquetes ----------------------------------------------------------------
library(glue)
library(ggtext)
library(showtext)
library(tidyverse)
# fuente ------------------------------------------------------------------
# colores
c1 <- "black"
c2 <- "grey30"
c3 <- "grey60"
c4 <- "white"
c5 <- "#F6B40E"
c6 <- "#75AEE0"
c7 <- "#97C124"
# fuente: Ubuntu
font_add(
family = "ubuntu",
regular = "fuente/Ubuntu-Regular.ttf",
bold = "fuente/Ubuntu-Bold.ttf",
italic = "fuente/Ubuntu-Italic.ttf"
)
# monoespacio & íconos
font_add(
family = "jet",
regular = "fuente/JetBrainsMonoNLNerdFontMono-Regular.ttf"
)
showtext_auto()
showtext_opts(dpi = 300)
# caption
fuente <- glue(
"Datos: <span style='color:{c5};'><span style='font-family:jet;'>",
"{{<b>tidytuesdayR</b>}}</span> semana {39}, ",
"<b>International Mathematical Olympiad</b> (IMO).</span>"
)
autor <- glue("<span style='color:{c5};'>**Víctor Gauto**</span>")
icon_twitter <- glue("<span style='font-family:jet;'></span>")
icon_instagram <- glue("<span style='font-family:jet;'></span>")
icon_github <- glue("<span style='font-family:jet;'></span>")
icon_mastodon <- glue("<span style='font-family:jet;'>󰫑</span>")
usuario <- glue("<span style='color:{c5};'>**vhgauto**</span>")
sep <- glue("**|**")
mi_caption <- glue(
"{fuente}<br>{autor} {sep} {icon_github} {icon_twitter} {icon_instagram} ",
"{icon_mastodon} {usuario}"
)
# datos -------------------------------------------------------------------
tuesdata <- tidytuesdayR::tt_load(2024, 39)
individual_results_df <- tuesdata$individual_results_df
# me interesa la cantidad y tipo de premio de Argentina, por año
# orden y etiquetas de los premios
orden_award <- c(
"Honourable mention", "Bronze medal", "Silver medal", "Gold medal"
)
etq_award <- c("Menciónnde honor", "Bronce", "Plata", "Oro")
# obtengo los datos de Argentina y resumo por año
d <- individual_results_df |>
filter(country == "Argentina") |>
count(year, award) |>
drop_na() |>
mutate(
award = factor(award, levels = orden_award, labels = etq_award)
) |>
mutate(
n = factor(n)
)
# figura ------------------------------------------------------------------
# bandera y logo del IMO
bandera <- "https://upload.wikimedia.org/wikipedia/commons/thumb/1/1a/Flag_of_Argentina.svg/640px-Flag_of_Argentina.svg.png"
imo <- "https://upload.wikimedia.org/wikipedia/commons/thumb/1/17/IMO_logo.svg/640px-IMO_logo.svg.png"
# función para hacer una separación entre la bandera y el logo
f_espacio <- function(n) {
str_flatten(rep("_", n))
}
# nombre para shape y size
etq <- "Cantidadnde premios"
# subtítulo y título
mi_subtitulo <- glue(
"<img src={bandera} width=120 />",
"<span style='color:{c2}'>",
"{f_espacio(85)}</span>",
"<img src={imo} width=120 />"
)
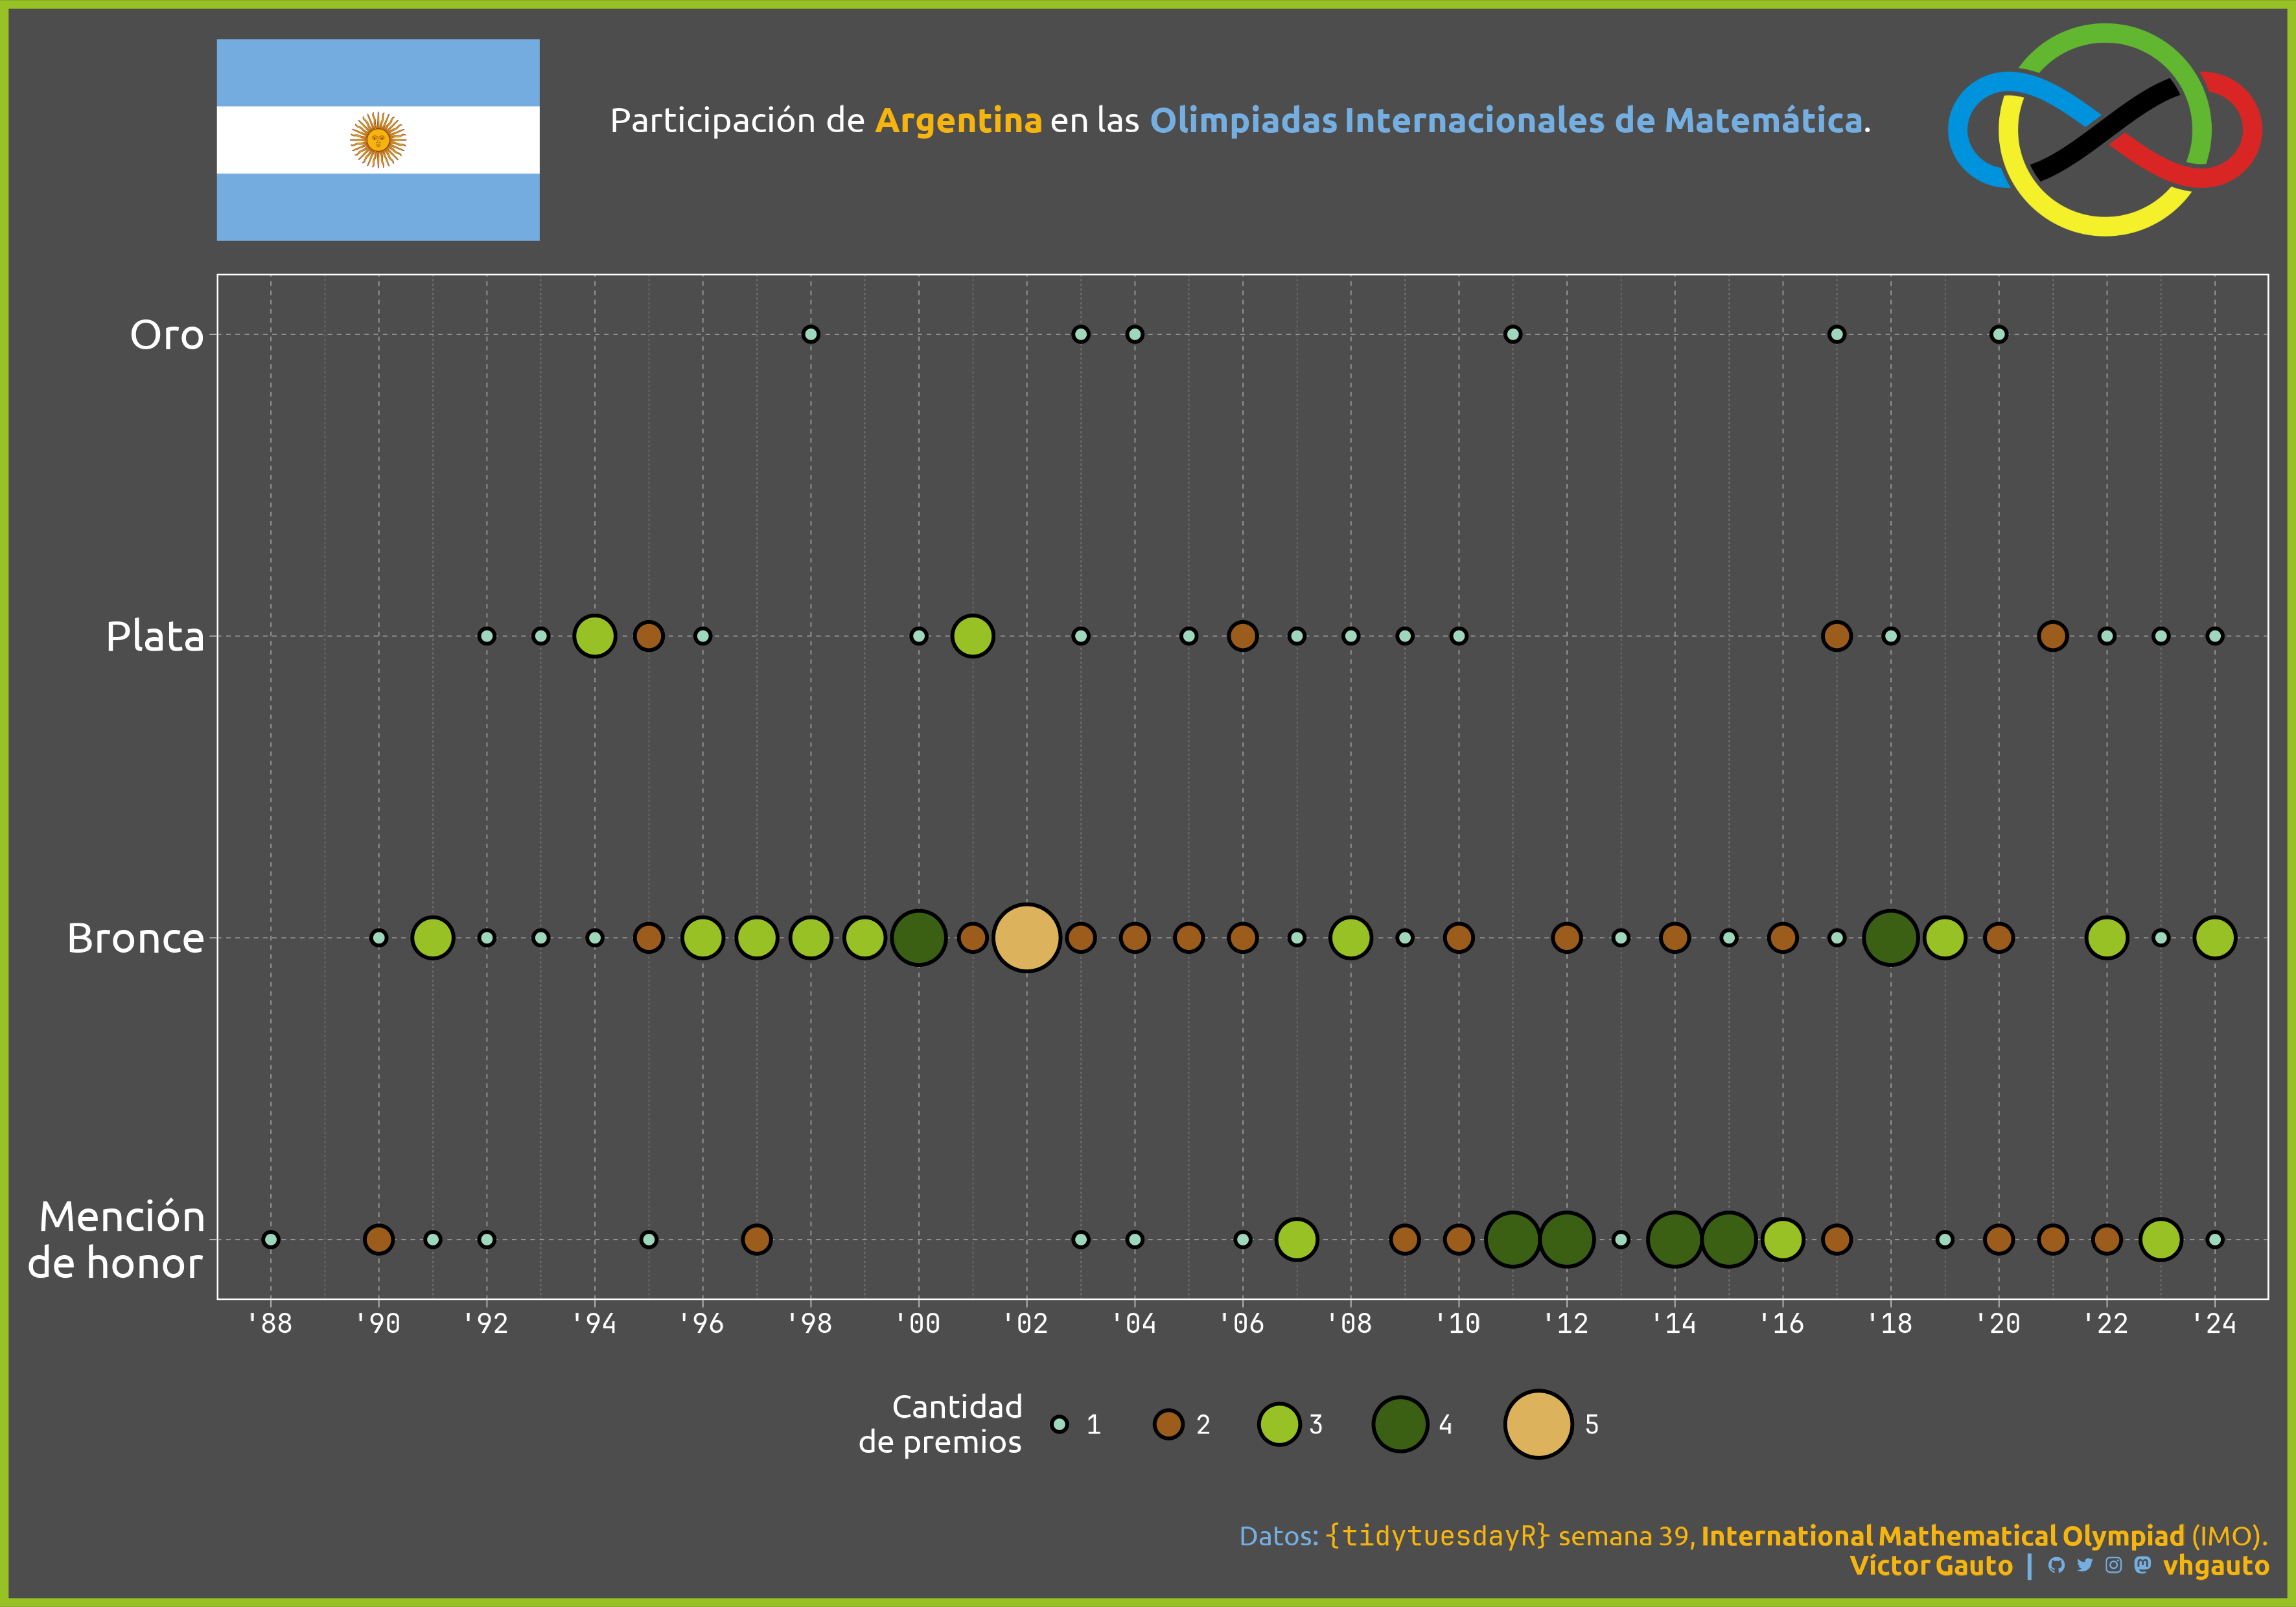
mi_titulo <- glue(
"Participación de <b style='color:{c5}'>Argentina</b> ",
"en las <b style='color:{c6};'>Olimpiadas Internacionales de Matemática</b>."
)
# figura
g <- ggplot(d, aes(year, award, size = n, fill = n)) +
geom_point(shape = 21, color = c1, stroke = 1) +
scale_x_continuous(
breaks = scales::breaks_width(2),
labels = (x) glue("'{str_sub(x, 3, 4)}"),
expand = c(0, 1)
) +
scale_y_discrete(expand = c(0, .2)) +
scale_fill_manual(
values = MoMAColors::moma.colors(palette_name = "Liu", n = 5)
) +
scale_size_manual(
values = seq(2, 11, length.out = 5)
) +
labs(
x = NULL, y = NULL, fill = etq, size = etq, title = mi_titulo,
subtitle = mi_subtitulo, caption = mi_caption) +
ggthemes::theme_pander() +
theme(
aspect.ratio = .5,
plot.background = element_rect(fill = c2, color = c7, linewidth = 3),
plot.margin = margin(t = 40, b = 10, l = 10, r = 10),
plot.title = element_markdown(
size = 13, family = "ubuntu", face = "plain", hjust = .5, color = c4
),
plot.subtitle = element_markdown(margin = margin(t = -50, b = 10)),
plot.caption = element_markdown(
color = c6, family = "ubuntu", size = 10, lineheight = unit(1.1, "line"),
margin = margin(t = 16.5)
),
panel.grid = element_line(color = c3),
axis.text = element_text(color = c4),
axis.text.x = element_text(family = "jet", size = 10),
axis.text.y = element_text(family = "ubuntu", size = 16),
legend.position = "bottom",
legend.title = element_text(
family = "ubuntu", size = 12, face = "plain", hjust = 1, color = c4
),
legend.background = element_blank(),
legend.text = element_text(
margin = margin(l = 2, r = 10), color = c4, family = "jet"
)
)
# guardo
ggsave(
plot = g,
filename = "2024/s39/viz.png",
width = 30,
height = 21,
units = "cm")
# abro
browseURL(glue("{getwd()}/2024/s39/viz.png"))