# paquetes ----------------------------------------------------------------
library(tidyverse)
library(here)
library(glue)
library(patchwork)
library(showtext)
library(fontawesome)
library(ggtext)
# fuentes -----------------------------------------------------------------
font_add(family = "radikal", regular = here("fuente/Nootype - Radikal.otf")) # títulos
font_add_google(name = "Share Tech Mono", family = "share") # números
font_add_google(name = "Heebo", family = "heebo") # resto del texto
showtext_auto()
showtext_opts(dpi = 300)
# íconos
font_add("fa-reg", "icon/Font Awesome 5 Free-Regular-400.otf")
font_add("fa-brands", "icon/Font Awesome 5 Brands-Regular-400.otf")
font_add("fa-solid", "icon/Font Awesome 5 Free-Solid-900.otf")
# caption
icon_twitter <- "<span style='font-family:fa-brands; color:#e50312;'></span>"
icon_github <- "<span style='font-family:fa-brands; color:#e50312;'></span>"
fuente <- "<span style='color:#e50312;'>Datos:</span> <span style='color:#ffee01;'><span style='font-family:mono;'>{**tidytuesdayR**}</span> semana 14</span>"
autor <- "<span style='color:#e50312;'>Autor:</span> <span style='color:#ffee01;'>**Víctor Gauto**</span>"
sep <- glue("<span style = 'color:#e50312;'>**|**</span>")
usuario <- glue("<span style = 'color:#ffee01;'>**vhgauto**</span>")
mi_caption <- glue("{fuente} {sep} {autor} {sep} {icon_github} {icon_twitter} {usuario}")
# datos -------------------------------------------------------------------
browseURL(glue("https://github.com/rfordatascience/tidytuesday/blob/master/data/
2023/2023-04-04/readme.md"))
futbol <- readr::read_csv('https://raw.githubusercontent.com/rfordatascience/tidytuesday/master/data/2023/2023-04-04/soccer21-22.csv')
futbol <- futbol |>
janitor::clean_names()
# por árbitro -------------------------------------------------------------
datos_ref <- futbol |>
select(referee, ay, ar, hy, hr) |>
group_by(referee) |>
summarise(ay = sum(ay),
ar = sum(ar),
hy = sum(hy),
hr = sum(hr)) |>
ungroup() |>
mutate(AMARILLA = hy + ay,
ROJA = hr + ar) |>
mutate(tot_tar = AMARILLA + ROJA) |>
select(-ay, -ar, -hy, -hr) |>
left_join(count(futbol, referee), by = "referee") |>
mutate(
AMARILLA = AMARILLA/n,
ROJA = ROJA/n,
tot_tar = tot_tar/n
) |>
select(-n) |>
pivot_longer(cols = AMARILLA:ROJA,
values_to = "valor",
names_to = "tarjeta") |>
select(referee, tarjeta, valor, tot_tar) |>
mutate(tarjeta = factor(tarjeta, levels = c("ROJA", "AMARILLA"))) |>
pivot_wider(names_from = tarjeta,
values_from = valor) |>
mutate(ROJA_x = ROJA) |>
mutate(AMARILLA_x = AMARILLA) |>
mutate(across(AMARILLA:ROJA, ~ format(round(.x, 1), nsmall = 1))) |>
mutate(referee = fct_reorder(referee, AMARILLA)) |>
mutate(ROJA = str_replace(ROJA, "0", ""))
# por equipos -------------------------------------------------------------
local_tar <- futbol |>
select(home_team, hy, hr) |>
group_by(equipo = home_team) |>
summarise(AMARILLA = sum(hy),
ROJA = sum(hr))
visit_tar <- futbol |>
select(away_team, ay, ar) |>
group_by(equipo = away_team) |>
summarise(AMARILLA = sum(ay),
ROJA = sum(ar))
path_logos <- "2023/semana_14/logo_png/"
datos_equ <- bind_rows(local_tar,
visit_tar) |>
group_by(equipo) |>
summarise(AMARILLA = sum(AMARILLA),
ROJA = sum(ROJA)) |>
pivot_longer(cols = AMARILLA:ROJA,
values_to = "valor",
names_to = "tarjeta") |>
group_by(equipo) |>
mutate(tot_tar = sum(valor)) |>
ungroup() |>
mutate(tarjeta = factor(tarjeta, levels = c("ROJA", "AMARILLA"))) |>
# mutate(equipo = fct_reorder(equipo, tot_tar)) |>
pivot_wider(names_from = tarjeta,
values_from = valor) |>
mutate(equipo_png = glue("{equipo}.png")) |>
mutate(equipo_label = glue("<img src='{paste0(path_logos, {equipo_png})}' width='30'>")) |>
mutate(equipo = fct_reorder(equipo, AMARILLA)) |>
mutate(equipo_label = fct_reorder(equipo_label, AMARILLA))
# figuras -----------------------------------------------------------------
# parámetros de la figura
tamaño_tarjeta <- 7
tamaño_nro <- 8
desp_equ <- 9
desp_ref <- .45
logo_a <- "2023/semana_14/logo_a.png"
logo_r <- "2023/semana_14/logo_r.png"
# tema p/ambas figuras
theme_set(
theme_minimal() +
theme(aspect.ratio = 3,
text = element_text(color = "white"),
axis.text.y.left = element_markdown(color = "white", family = "radikal",
size = 19, margin = margin(5, 20, 5, 5)),
axis.text.x = element_blank(),
axis.title.x = element_text(family = "heebo", size = 20,
hjust = .5, margin = margin(5, 0, 5, 40)),
plot.background = element_rect(fill = NA, color = NA),
plot.title = element_text(hjust = .5, size = 20,
family = "radikal"),
panel.background = element_rect(fill = NA, color = NA),
panel.grid = element_blank()
)
)
# figura EQUIPOS
g_equ <- ggplot(data = datos_equ, aes(y = equipo)) +
# linea punteada
geom_segment(aes(x = ROJA + 17, xend = AMARILLA - 6, yend = equipo),
color = "white", linetype = 2, linewidth = .25) +
# tarjeta ROJA
geom_label(aes(x = ROJA, label = " "), color = "#e50312",
fill = "#e50312", size = tamaño_tarjeta, hjust = 0) +
geom_text(aes(x = ROJA, label = ROJA), color = "#e50312",
size = tamaño_nro,
nudge_x = desp_equ, hjust = 0, family = "share") +
# tarjeta AMARILLA
geom_label(aes(x = AMARILLA, label = " "), color = "#ffee01",
fill = "#ffee01", size = tamaño_tarjeta, hjust = 0) +
geom_text(aes(x = AMARILLA, label = AMARILLA), color = "#ffee01",
size = tamaño_nro,
nudge_x = desp_equ, hjust = 0, family = "share") +
# logo equipos
geom_richtext(aes(x = -15, y = equipo, label = equipo_label), fill = NA,
color = NA, size = 6) +
# manual
scale_x_continuous(limits = c(-20, 117), expand = c(0, 0)) +
scale_y_discrete(labels = (x) str_to_upper(x)) +
scale_fill_manual(breaks = c("AMARILLA", "ROJA"),
values = c("#ffee01", "#e50312")) +
coord_cartesian(clip = "off") +
# ejes
labs(x = "Cantidad total de tarjetas",
y = NULL)
# figura ÁRBITROS
g_ref <- ggplot(data = datos_ref, aes(y = referee,)) +
# linea punteada
geom_segment(aes(x = ROJA_x + 1.1, xend = AMARILLA_x - .3, yend = referee),
color = "white", linetype = 2, linewidth = .25) +
# tarjeta ROJA
geom_label(aes(x = ROJA_x, label = " "), color = "#e50312",
fill = "#e50312", size = tamaño_tarjeta, hjust = 0) +
geom_text(aes(x = ROJA_x, label = ROJA), color = "#e50312",
size = tamaño_nro,
nudge_x = desp_ref, hjust = 0, family = "share") +
# tarjeta AMARILLA
geom_label(aes(x = AMARILLA_x, label = " "), color = "#ffee01",
fill = "#ffee01", size = tamaño_tarjeta, hjust = 0) +
geom_text(aes(x = AMARILLA_x, label = AMARILLA), color = "#ffee01",
size = tamaño_nro,
nudge_x = desp_ref, hjust = 0, family = "share") +
# manual
scale_x_continuous(limits = c(-.1, 6), expand = c(0, 0)) +
scale_y_discrete(labels = (x) str_replace(x, " ", ". ")) +
scale_fill_manual(breaks = c("AMARILLA", "ROJA"),
values = c("#ffee01", "#e50312")) +
coord_cartesian(clip = "off") +
# ejes
labs(x = "Cantidad promedio de tarjetas,npor partido",
y = NULL)
# figura compuesta
g_comp <- g_equ + plot_spacer() + g_ref +
# distribución figuras
plot_layout(widths = c(.8, .2, .8)) &
plot_annotation(
title = glue(
"<img src='{logo_r}' width='55'> PREMIER LEAGUE
<img src='{logo_a}' width='55'>"
),
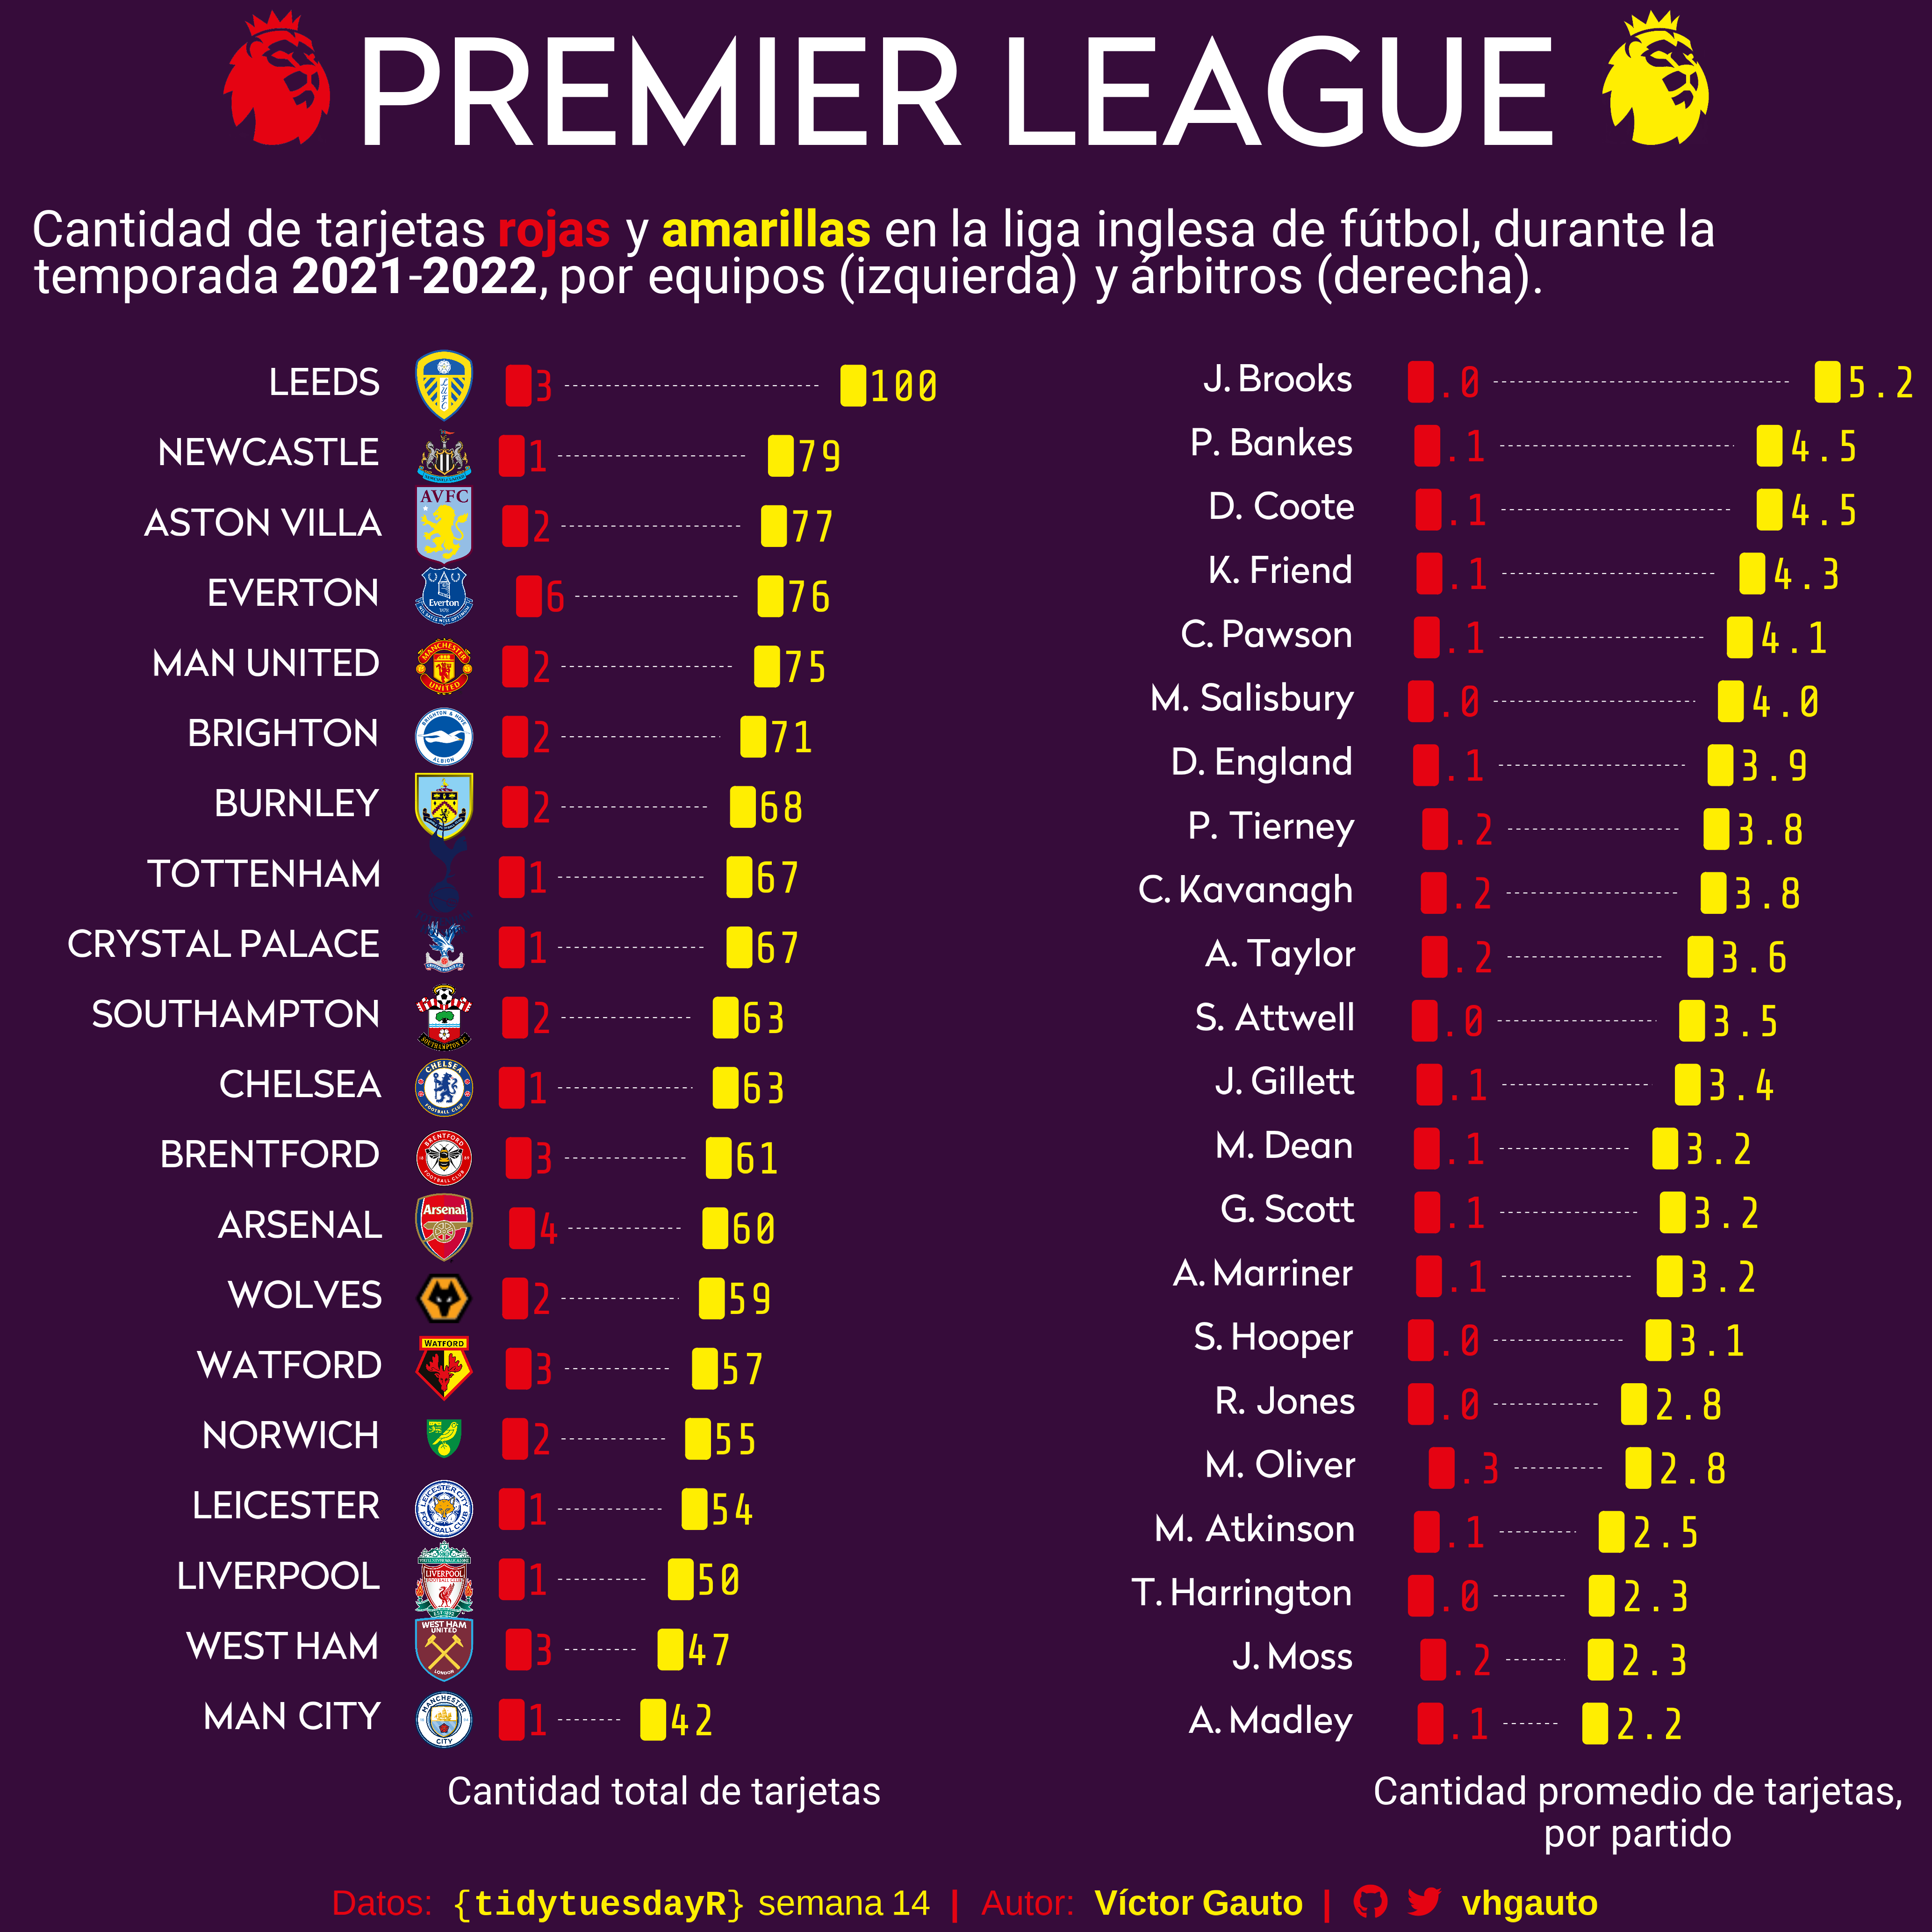
subtitle = "Cantidad de tarjetas <span style='color:#e50312;'>**rojas**</span>
y <span style='color:#ffee01;'>**amarillas**</span> en la liga inglesa de
fútbol, durante la<br>temporada **2021**-**2022**, por equipos (izquierda) y
árbitros (derecha).",
caption = mi_caption,
theme = theme(
plot.title = element_markdown(
family = "radikal", size = 75, hjust = .5, color = "white"),
plot.title.position = "plot",
plot.subtitle = element_markdown(
color = "white", size = 26, family = "heebo", margin = margin(10, 0, 15, 0)),
plot.background = element_rect(fill = "#360c3a", color = NA),
plot.margin = margin(5, 12, 5, 12),
plot.caption = element_markdown(hjust = .5, size = 18),
axis.text.x = element_blank(),
panel.background = element_rect(fill = "#360c3a", color = NA),
)
)
# guardo
ggsave(
plot = g_comp,
filename = here("2023/semana_14/viz.png"),
width = 35,
height = 35,
units = "cm",
dpi = 300)
# abro
browseURL(here("2023/semana_14/viz.png"))