# paquetes ----------------------------------------------------------------
library(glue)
library(ggtext)
library(showtext)
library(sf)
library(patchwork)
library(tidyverse)
# fuente ------------------------------------------------------------------
# colores
c1 <- "#3274DA"
c2 <- "#F05440"
c3 <- "#1B9E77"
c4 <- "#D95F02"
c5 <- "#7570B3"
c6 <- "grey95"
c7 <- "grey90"
c8 <- "grey80"
c9 <- "grey40"
c10 <- "black"
c11 <- "white"
# fuente: Ubuntu
font_add(
family = "ubuntu",
regular = "fuente/Ubuntu-Regular.ttf",
bold = "fuente/Ubuntu-Bold.ttf",
italic = "fuente/Ubuntu-Italic.ttf")
# fuente: Victor
font_add(
family = "victor",
regular = "fuente/VictorMono-ExtraLight.ttf",
bold = "fuente/VictorMono-VariableFont_wght.ttf",
italic = "fuente/VictorMono-ExtraLightItalic.ttf")
# íconos
font_add("fa-brands", "icon/Font Awesome 6 Brands-Regular-400.otf")
showtext_auto()
showtext_opts(dpi = 300)
# caption
fuente <- glue(
"Datos: <span style='color:{c2};'><span style='font-family:mono;'>",
"{{<b>tidytuesdayR</b>}}</span> semana {6}. ",
"UNESCO World Heritage Sites.</span>")
autor <- glue("<span style='color:{c2};'>**Víctor Gauto**</span>")
icon_twitter <- glue("<span style='font-family:fa-brands;'></span>")
icon_github <- glue("<span style='font-family:fa-brands;'></span>")
icon_mastodon <- glue("<span style='font-family:fa-brands;'></span>")
usuario <- glue("<span style='color:{c2};'>**vhgauto**</span>")
sep <- glue("**|**")
mi_caption <- glue(
"{fuente}<br>{autor} {sep} {icon_github} {icon_twitter} {icon_mastodon}
{usuario}")
# datos -------------------------------------------------------------------
tuesdata <- tidytuesdayR::tt_load(2024, 6)
heritage <- tuesdata$heritage |>
rename(pais = country)
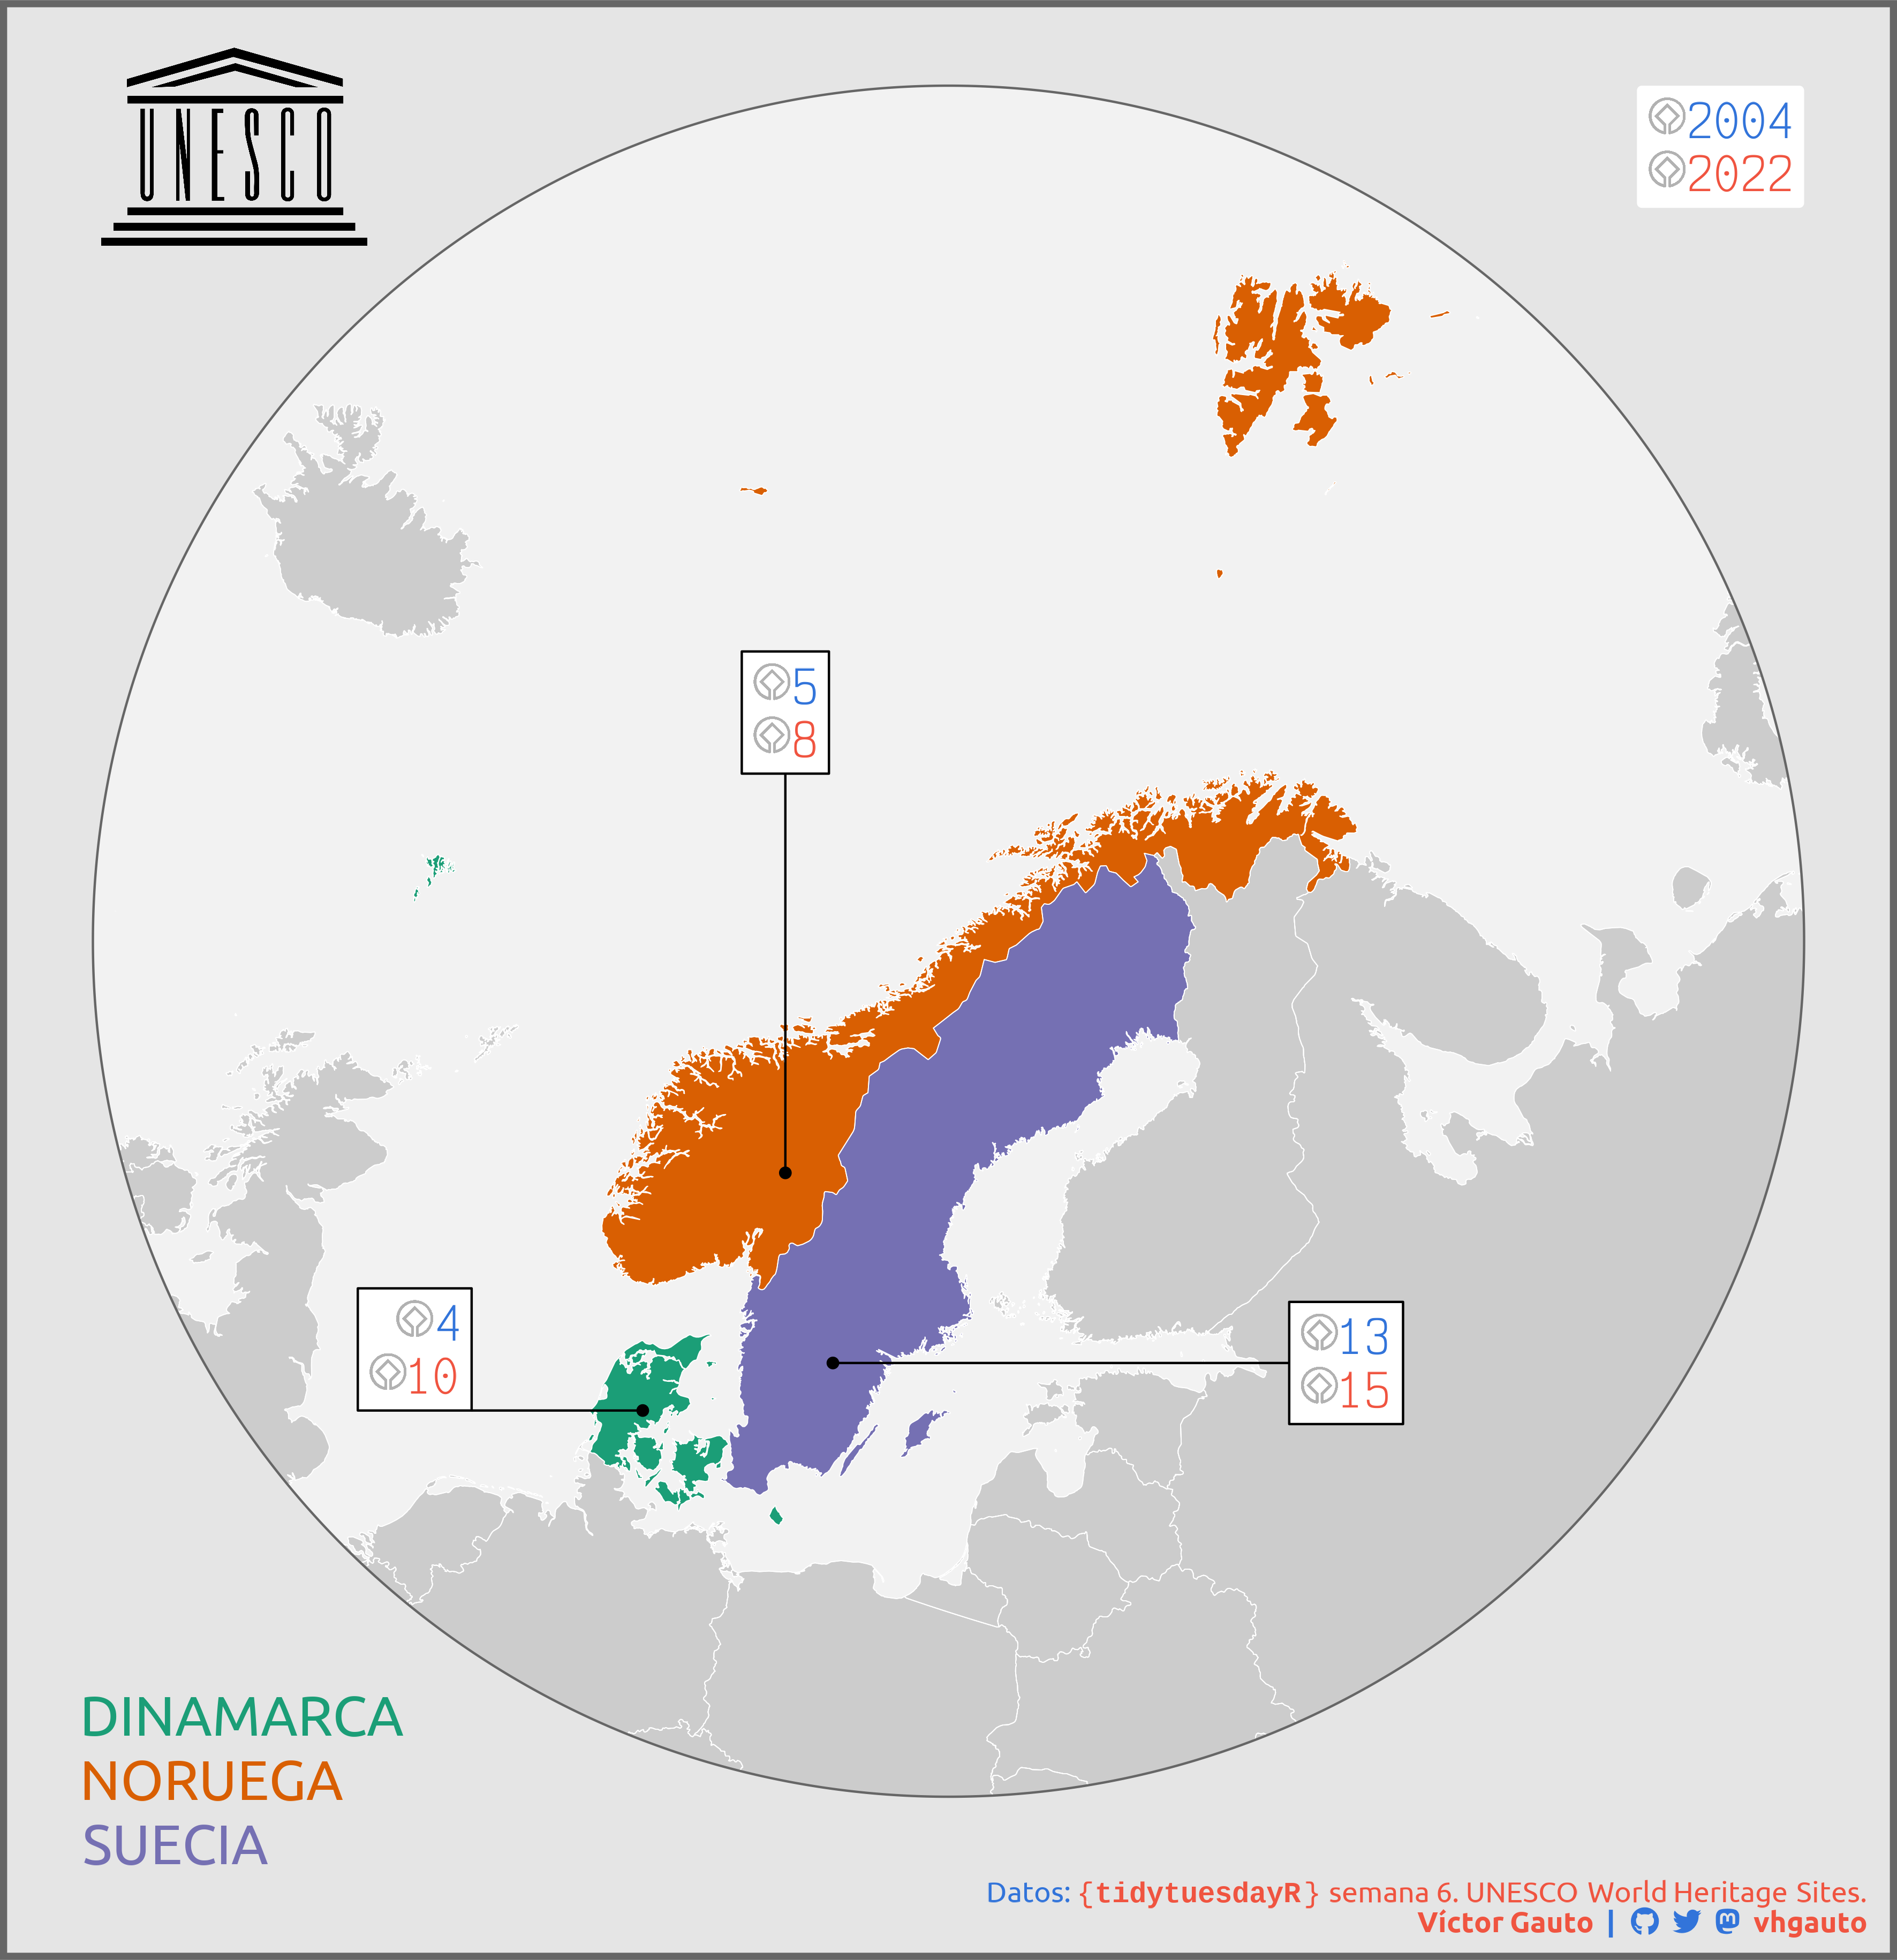
# quiero visualizar la geografía de Europa, con los países resaltados y la
# cantidad de sitios, por año, por país
# creo un buffer alrededor del centroide de Noruega
noruega <- rnaturalearth::ne_countries(
country = "Norway",
scale = "medium",
returnclass = "sf") |>
select(pais = sovereignt) |>
st_make_valid() |>
st_transform(crs = 7005)
noruega_centro <- st_union(noruega) |>
st_make_valid() |>
st_centroid()
centro_buffer <- st_buffer(noruega_centro, dist = 1.8e6, nQuadSegs = 5000) |>
st_transform(crs = 7005) |>
st_make_valid() |>
terra::vect()
# vector de países de Europa
europa <- rnaturalearth::ne_countries(
continent = "europe",
scale = "large",
returnclass = "sf") |>
select(pais = sovereignt) |>
st_transform(crs = 7005) |>
st_make_valid() |>
terra::vect()
# obtengo un recorte de Europa al buffer
europa_crop <- terra::crop(europa, centro_buffer) |>
st_as_sf() |>
# remuevo Francia, para evitar problemas con sus territorios de ultramar
filter(pais != "France") |>
group_by(pais) |>
summarise(geometry = st_union(geometry))
# logo de patrimonios de UNESCO
logo <- "<img src='2024/s06/logo.png' width=20></img>"
# combino los datos de Europa y heritage
d <- inner_join(heritage, europa_crop, by = join_by(pais)) |>
mutate(color = c(c1, c2, c3)) |>
st_as_sf()
d_centro <- d |>
mutate(centro = st_centroid(geometry, of_largest_polygon = FALSE)) |>
as_tibble() |>
select(-geometry) |>
st_as_sf()
# sitios de los que salen las líneas
d_capitales <- tibble(
pais = d_centro$pais) |>
mutate(
x = c(-1e6, -1.3e6, -.9e6),
y = c(7.1e6, 6.6e6, 6.7e6)) |>
st_as_sf(coords = c("x", "y")) |>
st_set_crs(value = 7005)
# longitud de las líneas
largo_linea <- 1.2e6
# anotaciones de las cantidades de patrimonios de UNESCO
d_lineas <- d_capitales |>
st_coordinates() |>
as_tibble() |>
mutate(pais = d_capitales$pais, .before = 1) |>
mutate(
xend = case_match(
pais,
"Norway" ~ X,
"Denmark" ~ X - largo_linea*.3,
"Sweden" ~ X + largo_linea*.8)) |>
mutate(
yend = case_match(
pais,
"Norway" ~ Y + largo_linea*.7,
"Denmark" ~ Y,
"Sweden" ~ Y)) |>
mutate(
año_2004 = d$`2004`,
año_2022 = d$`2022`) |>
mutate(label = glue(
"{logo}<span style='color:{c1}'>{año_2004}</span><br>",
"{logo}<span style='color:{c2}'>{año_2022}</span>")) |>
mutate(
hjust = c(.5, 1, 0),
vjust = c(0, 0, .5))
# figura ------------------------------------------------------------------
# etiquetas de los países, leyenda
label_pais <- c("Dinamarca", "Noruega", "Suecia") |> str_to_upper()
label_color <- c(c3, c4, c5)
label_leyenda <- glue("<p style='color:{label_color}'>{label_pais}</p>")
# anotación de los años
bb <- st_bbox(centro_buffer)
label_año <- glue(
"{logo}<span style='color:{c1}'>2004</span><br>",
"{logo}<span style='color:{c2}'>2022</span>")
# logo UNESCO
logo_unesco <- "<img src='2024/s06/unesco_logo.png' width=120></img>"
# figura
g <- ggplot() +
# océano
geom_sf(
data = st_as_sf(centro_buffer), fill = c6, color = NA) +
# Europa
geom_sf(data = europa_crop, fill = c8, color = c11) +
# Noruega, Dinamarca, Suecia
geom_sf(data = d, aes(fill = pais), color = NA) +
# Europa, contorno
geom_sf(data = europa_crop, fill = NA, color = c11) +
# círculo externo
geom_sf(
data = st_as_sf(centro_buffer), fill = NA, color = c9, linewidth = .5) +
# puntos origen de las líneas
geom_sf(data = d_capitales, size = 2) +
# líneas
geom_segment(
data = d_lineas, aes(X, Y, xend = xend, yend = yend), color = c10) +
# heritage
geom_richtext(
data = d_lineas,
aes(xend, yend, label = label, hjust = hjust, vjust = vjust),
fill = c11, label.color = c10, size = 7, family = "victor",
label.r = unit(0, "mm"), label.size = unit(.5, "mm")) +
# años
annotate(
geom = "richtext", x = bb["xmax"], y = bb["ymax"], label = label_año,
fill = c11, label.color = NA, hjust = 1, vjust = 1, family = "victor",
size = 7) +
# logo UNESCO
annotate(
geom = "richtext", x = bb["xmin"], y = bb["ymax"], label = logo_unesco,
fill = NA, label.color = NA, hjust = 0, vjust = .8,
size = 13) +
scale_fill_brewer(palette = "Dark2", labels = label_leyenda) +
coord_sf(clip = "off") +
labs(caption = mi_caption, fill = NULL) +
guides(fill = guide_legend(override.aes = list(fill = NA))) +
theme_void() +
theme(
aspect.ratio = 1,
plot.margin = margin(r = 3.3, l = 3.3),
plot.background = element_rect(fill = c7, color = c9, linewidth = 3),
plot.caption = element_markdown(
family = "ubuntu", color = c1, size = 13,
margin = margin(b = 10, r = 10)),
legend.position = c(0, 0),
legend.justification = c(0, 0),
legend.direction = "vertical",
legend.text = element_markdown(family = "ubuntu", color = c10, size = 25),
legend.key.size = unit(2, "line")
)
# guardo
ggsave(
plot = g,
filename = "2024/s06/viz.png",
width = 30,
height = 31,
units = "cm")
# abro
browseURL("2024/s06/viz.png")