Ocultar código
library(glue)
library(ggtext)
library(showtext)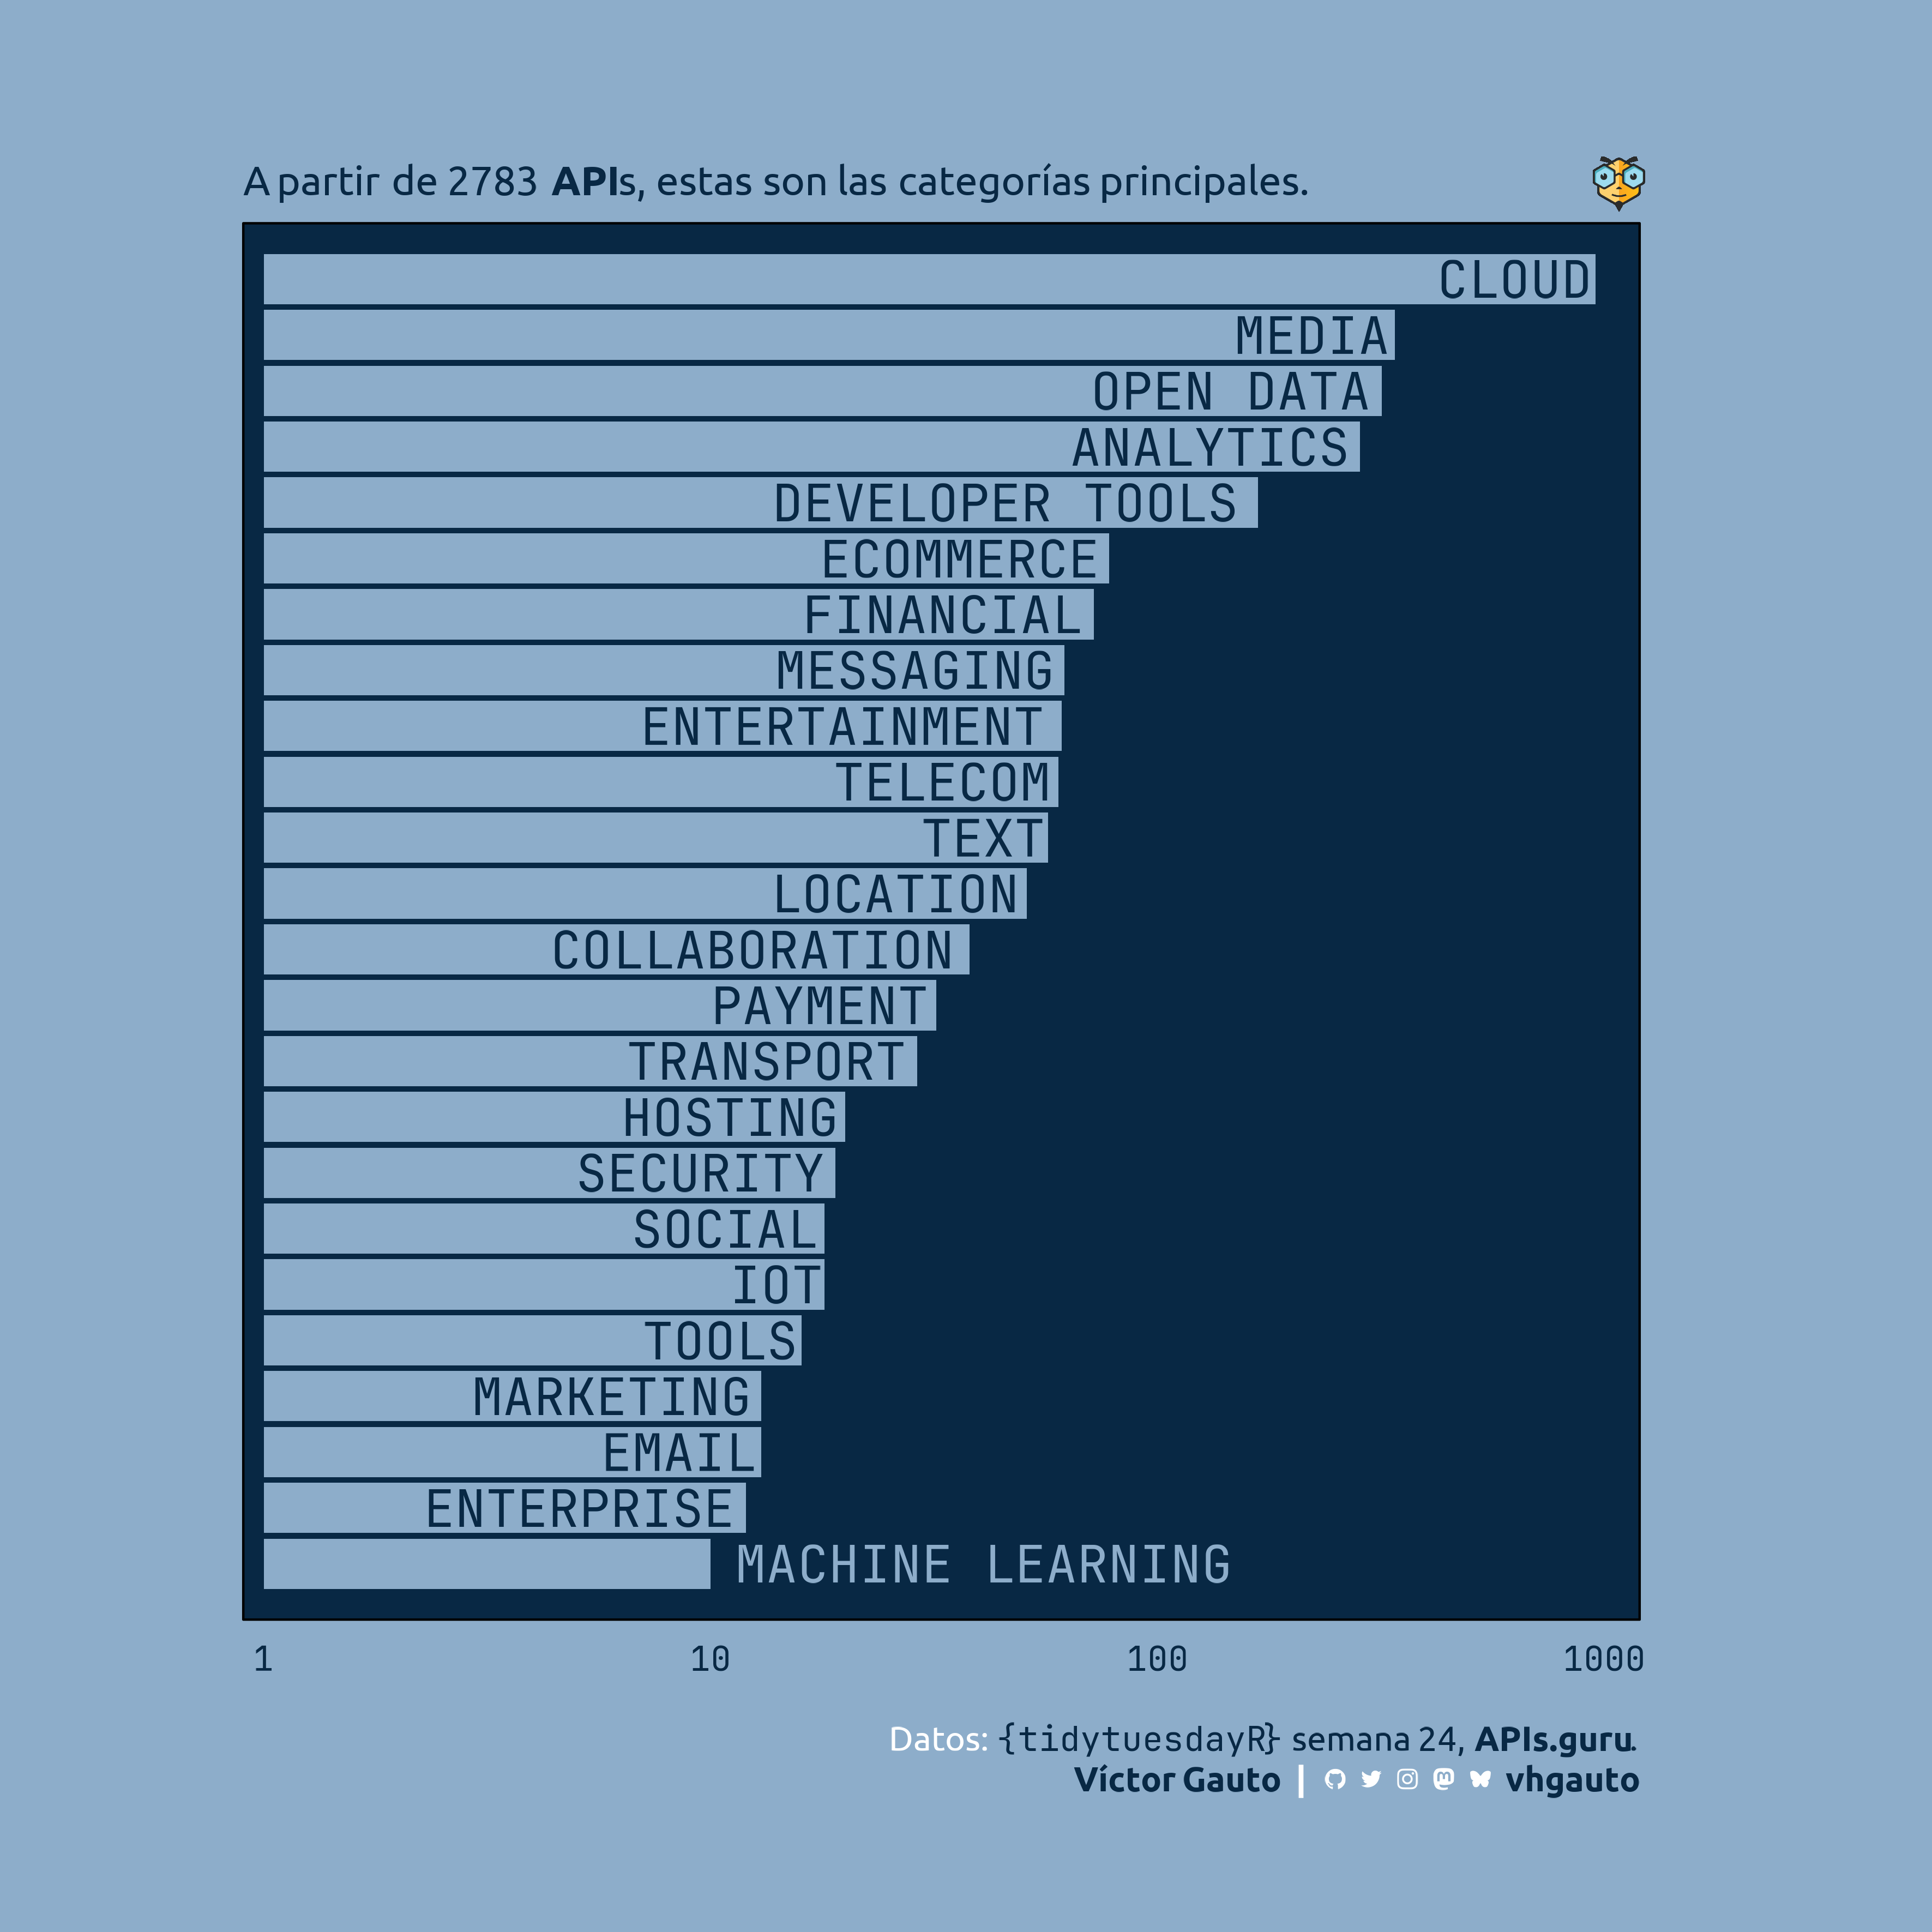
library(tidyverse)Cantidad de APIs por categoría.
library(glue)
library(ggtext)
library(showtext)
library(tidyverse)Colores.
c1 <- "#082844"
c2 <- "#8DADCA"
c3 <- "white"
Fuentes: Ubuntu y JetBrains Mono.
font_add(
  family = "ubuntu",
  regular = "././fuente/Ubuntu-Regular.ttf",
  bold = "././fuente/Ubuntu-Bold.ttf",
  italic = "././fuente/Ubuntu-Italic.ttf"
)

font_add(
  family = "jet",
  regular = "././fuente/JetBrainsMonoNLNerdFontMono-Regular.ttf"
)

showtext_auto()
showtext_opts(dpi = 300)fuente <- glue(
"Datos: <span style='color:{c1};'><span style='font-family:jet;'>",
"{{<b>tidytuesdayR</b>}}</span> semana 24, ",
"<b>APIs.guru</b>.</span>"
)
autor <- glue("<span style='color:{c1};'>**Víctor Gauto**</span>")
icon_twitter <- glue("<span style='font-family:jet;'></span>")
icon_instagram <- glue("<span style='font-family:jet;'></span>")
icon_github <- glue("<span style='font-family:jet;'></span>")
icon_mastodon <- glue("<span style='font-family:jet;'>󰫑</span>")
icon_bsky <- glue("<span style='font-family:jet;'></span>")
usuario <- glue("<span style='color:{c1};'>**vhgauto**</span>")
sep <- glue("**|**")
mi_caption <- glue(
"{fuente}<br>{autor} {sep} {icon_github} {icon_twitter} {icon_instagram} ",
"{icon_mastodon} {icon_bsky} {usuario}"
)tuesdata <- tidytuesdayR::tt_load(2025, 24)
api_categories <- tuesdata$api_categoriesMe interesan las categorías de las API.
d <- count(api_categories, apisguru_category, sort = TRUE) |>
  filter(n >= 10) |>
  mutate(
    categoria = str_replace_all(apisguru_category, "_", " ") |> toupper()
  ) |>
  mutate(
    categoria = fct_reorder(categoria, n)
  ) |>
  mutate(hjust = if_else(n > 10, 1.05, -.05)) |>
mutate(color = if_else(n > 10, c1, c2))Logo y título.
mi_titulo <- glue(
  "Categorías principales a partir de {nrow(api_categories)} **API**s."
)

logo_link <- "https://apis.guru/assets/images/logo.svg"
logo_svg <- paste(readLines(logo_link), collapse = "\n")
Figura.
g <- ggplot(d, aes(n, categoria)) +
  geom_col(fill = c2, color = NA) +
  geom_text(
    aes(label = categoria, hjust = hjust, color = color),
    family = "jet",
    size = 8
  ) +
  ggsvg::geom_point_svg(
    x = I(.985),
    y = I(25.7),
    svg = logo_svg,
    size = 10,
    inherit.aes = FALSE
  ) +
  scale_x_log10() +
  scale_color_identity() +
  coord_cartesian(
    ylim = c(0, nrow(d) + 1),
    xlim = c(.9, 1200),
    expand = FALSE,
    clip = "off"
  ) +
  labs(x = NULL, y = NULL, title = mi_titulo, caption = mi_caption) +
  ggthemes::theme_par(base_size = 15, base_family = "jet") +
  theme(
    aspect.ratio = 1,
    plot.background = element_rect(fill = c2, color = NA),
    plot.title = element_markdown(
      family = "ubuntu",
      color = c1,
      hjust = 0,
      face = "plain"
    ),
    plot.caption = element_markdown(
      family = "ubuntu",
      color = c3,
      margin = margin(t = 20),
      lineheight = 1.2,
      size = 15
    ),
    panel.background = element_rect(fill = c1, color = NA),
    axis.line = element_blank(),
    axis.ticks = element_blank(),
    axis.text.x = element_text(color = c1),
    axis.text.y = element_blank()
  )
Guardo.
ggsave(
  plot = g,
  filename = "tidytuesday/2025/semana_24.png",
  width = 30,
  height = 30,
  units = "cm"
)