# paquetes ----------------------------------------------------------------
library(glue)
library(ggtext)
library(showtext)
library(tidyverse)
# fuente ------------------------------------------------------------------
# colores
c1 <- "#F4FAFE"
c2 <- "#A41400"
c3 <- "#00B7A7"
c4 <- "#C1DBEC"
c5 <- "#7FABD3"
c6 <- "#273871"
# fuente: Ubuntu
font_add(
family = "ubuntu",
regular = "fuente/Ubuntu-Regular.ttf",
bold = "fuente/Ubuntu-Bold.ttf",
italic = "fuente/Ubuntu-Italic.ttf")
# monoespacio & íconos
font_add(
family = "jet",
regular = "fuente/JetBrainsMonoNLNerdFontMono-Regular.ttf")
showtext_auto()
showtext_opts(dpi = 300)
# caption
fuente <- glue(
"Datos: <span style='color:{c3};'><span style='font-family:mono;'>",
"{{<b>tidytuesdayR</b>}}</span> semana {20}, ",
"Great American Coffee Taste Test.</span>")
autor <- glue("<span style='color:{c3};'>**Víctor Gauto**</span>")
icon_twitter <- glue("<span style='font-family:jet;'></span>")
icon_instagram <- glue("<span style='font-family:jet;'></span>")
icon_github <- glue("<span style='font-family:jet;'></span>")
icon_mastodon <- glue("<span style='font-family:jet;'>󰫑</span>")
usuario <- glue("<span style='color:{c3};'>**vhgauto**</span>")
sep <- glue("**|**")
mi_caption <- glue(
"{fuente}<br>{autor} {sep} {icon_github} {icon_twitter} {icon_instagram} ",
"{icon_mastodon} {usuario}")
# datos -------------------------------------------------------------------
coffee_survey <- readr::read_csv('https://raw.githubusercontent.com/rfordatascience/tidytuesday/master/data/2024/2024-05-14/coffee_survey.csv')
# me interesa ver la diferencia entre los que conocen el origen del café. y el
# dinero que están dispuestos a pagar
# factores de precios
precio <- c(
"Less than $2", "$2-$4", "$4-$6", "$6-$8", "$8-$10", "$10-$15", "$15-$20",
"More than $20")
precio_label <- c(
"< $2", "$2-$4", "$4-$6", "$6-$8", "$8-$10", "$10-$15", "$15-$20",
"> $20") |>
str_replace("-", "~")
# íconos
icono_si <- glue("<span style='font-family:jet; color: {c2}'></span>")
icono_no <- glue("<span style='font-family:jet; color: {c3}'></span>")
# líneas verticales
verticales <- c(1:10, (1:10)*10, (1:10)*100) |> unique()
# datos
d <- coffee_survey |>
select(know_source, most_paid) |>
drop_na() |>
mutate(
most_paid = factor(most_paid, levels = precio, labels = precio_label)
) |>
count(know_source, most_paid) |>
mutate(color = if_else(
know_source == "No",
c3,
c2
)) |>
mutate(label = if_else(
know_source == "No",
icono_no,
icono_si
))
# figura ------------------------------------------------------------------
# íconos de café, con transparencia
cafe1 <- glue("<span style='font-family:jet; color: {c5}66'></span>")
cafe2 <- glue("<span style='font-family:jet; color: {c2}66'></span>")
cafe3 <- glue("<span style='font-family:jet; color: {c6}66'></span>")
cafe4 <- glue("<span style='font-family:jet; color: {c3}66'></span>")
cafe_tbl <- tibble(
x = c(3, 10, 3, 10),
y = c(4, 4, 5, 5),
label = c(cafe1, cafe2, cafe3, cafe4)
)
# subtítulo
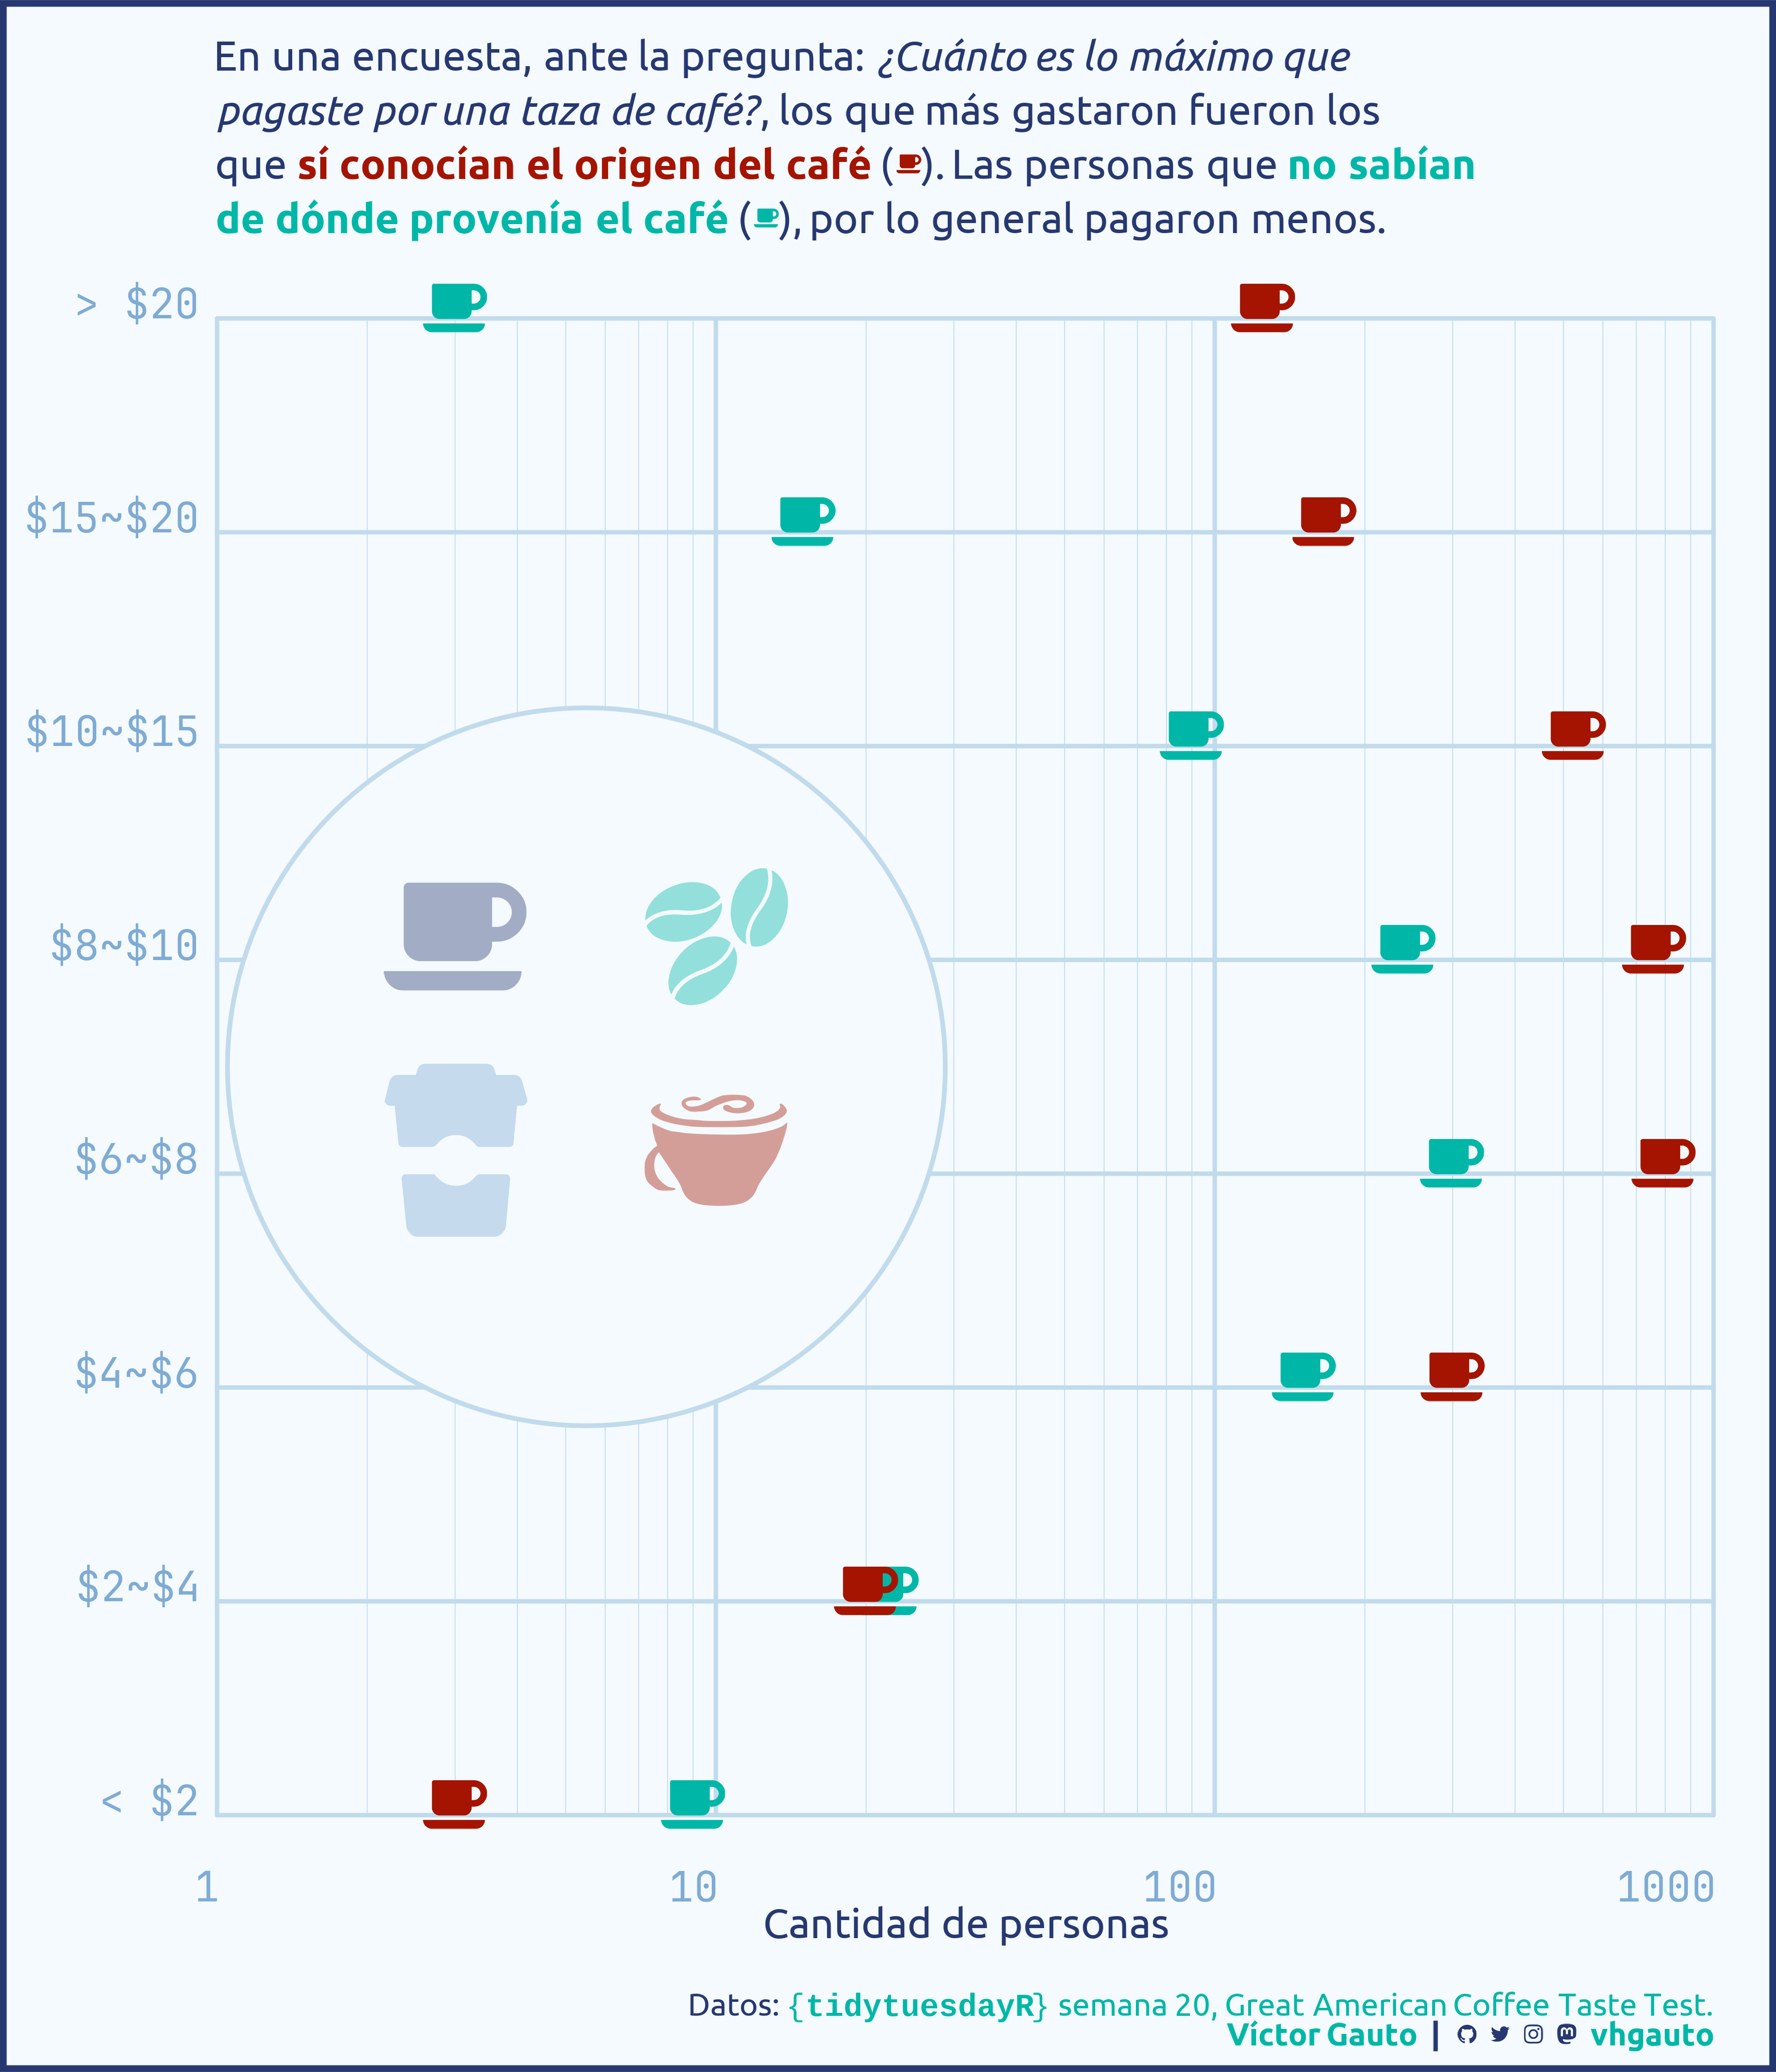
mi_subtitle <- glue(
"En una encuesta, ante la pregunta: <i>¿Cuánto es lo máximo que<br>",
"pagaste por una taza de café?</i>, los que más gastaron fueron los<br>",
"que <b style='color: {c2}'>sí conocían el origen del café</b> ",
"({icono_si}). Las personas que <b style='color: {c3}'>no sabían<br>",
"de dónde provenía el café</b> ({icono_no}), por lo general ",
"pagaron menos."
)
# figura
g <- ggplot(d, aes(n, most_paid)) +
geom_richtext(
aes(label = label), fill = NA, label.color = NA, size = 18) +
# punto con íconos
annotate(
geom = "point", x = 5.5, y = 4.5, size = 160, fill = c1, shape = 21,
color = c4, stroke = 1.6
) +
# íconos café
geom_richtext(
data = cafe_tbl, aes(x, y, label = label), inherit.aes = FALSE, size = 40,
fill = NA, label.color = NA
) +
scale_x_log10(
limits = c(1, 1000), guide = "axis_logticks", minor_breaks = verticales,
expand = c(0, 0)
) +
scale_y_discrete(expand = c(0, 0)) +
scale_color_manual(values = c(c3, c2)) +
coord_cartesian(clip = "off") +
labs(
y = NULL, x = "Cantidad de personas", subtitle = mi_subtitle,
caption = mi_caption
) +
theme_void() +
theme(
aspect.ratio = 1,
plot.margin = margin(r = 30, l = 10, t = 20),
plot.background = element_rect(fill = c1, color = c6, linewidth = 3),
plot.title.position = "panel",
plot.subtitle = element_markdown(
family = "ubuntu", color = c6, size = 20, hjust = 0,
margin = margin(b = 37.3), lineheight = unit(1.3, "line")),
plot.caption = element_markdown(
family = "ubuntu", color = c6, size = 15, margin = margin(t = 25, b = 10)),
panel.grid.major = element_line(
color = c4, linewidth = 1, linetype = 1),
panel.grid.minor = element_line(
color = c4, linewidth = .2, linetype = 1),
axis.title.x = element_text(family = "ubuntu", color = c6, size = 20),
axis.text.y = element_text(
family = "jet", color = c5, hjust = 1, size = 20, vjust = 0,
margin = margin(r = 10)),
axis.text.x = element_text(
family = "jet", color = c5, size = 20, margin = margin(t = 25), hjust = 1)
)
# guardo
ggsave(
plot = g,
filename = "2024/s20/viz.png",
width = 30,
height = 35,
units = "cm")
# abro
browseURL("2024/s20/viz.png")