# paquetes ----------------------------------------------------------------
library(tidyverse)
library(glue)
library(showtext)
library(ggtext)
library(ggpath)
# fuente ------------------------------------------------------------------
# colores
c1 <- "#E1C8AF"
c2 <- "#E1E1E1"
c3 <- "#EDDAEB"
c4 <- "#647D96"
c5 <- "#3B4252"
c6 <- "#2E87C9"
c7 <- "#4C566A"
# texto gral, títulos de eje
font_add_google(name = "Ubuntu", family = "ubuntu")
# eje horizontal & vertical
font_add_google(name = "Victor Mono", family = "victor", db_cache = FALSE)
# temporada
font_add_google(name = "Bebas Neue", family = "bebas", db_cache = FALSE)
# fuck's
font_add_google(name = "Permanent Marker", family = "marker")
# íconos
font_add("fa-brands", "icon/Font Awesome 6 Brands-Regular-400.otf")
font_add("fa-solids", "icon/Font Awesome 6 Free-Solid-900.otf")
showtext_auto()
showtext_opts(dpi = 300)
# caption
fuente <- glue("Datos: <span style='color:{c3};'><span style='font-family:victor;'>{{<b>tidytuesdayR</b>}}</span> semana 39. <span style='font-family:victor;'>{{richmondway}}</span>, **Deepsha Menghani**</span>")
autor <- glue("Autor: <span style='color:{c3};'>**Víctor Gauto**</span>")
icon_twitter <- glue("<span style='font-family:fa-brands;'></span>")
icon_github <- glue("<span style='font-family:fa-brands;'></span>")
usuario <- glue("<span style='color:{c3};'>**vhgauto**</span>")
sep <- glue("**|**")
mi_caption <- glue("{fuente}<br>{autor} {sep} {icon_github} {icon_twitter} {usuario}")
# datos -------------------------------------------------------------------
browseURL("https://github.com/rfordatascience/tidytuesday/blob/master/data/2023/2023-09-26/readme.md")
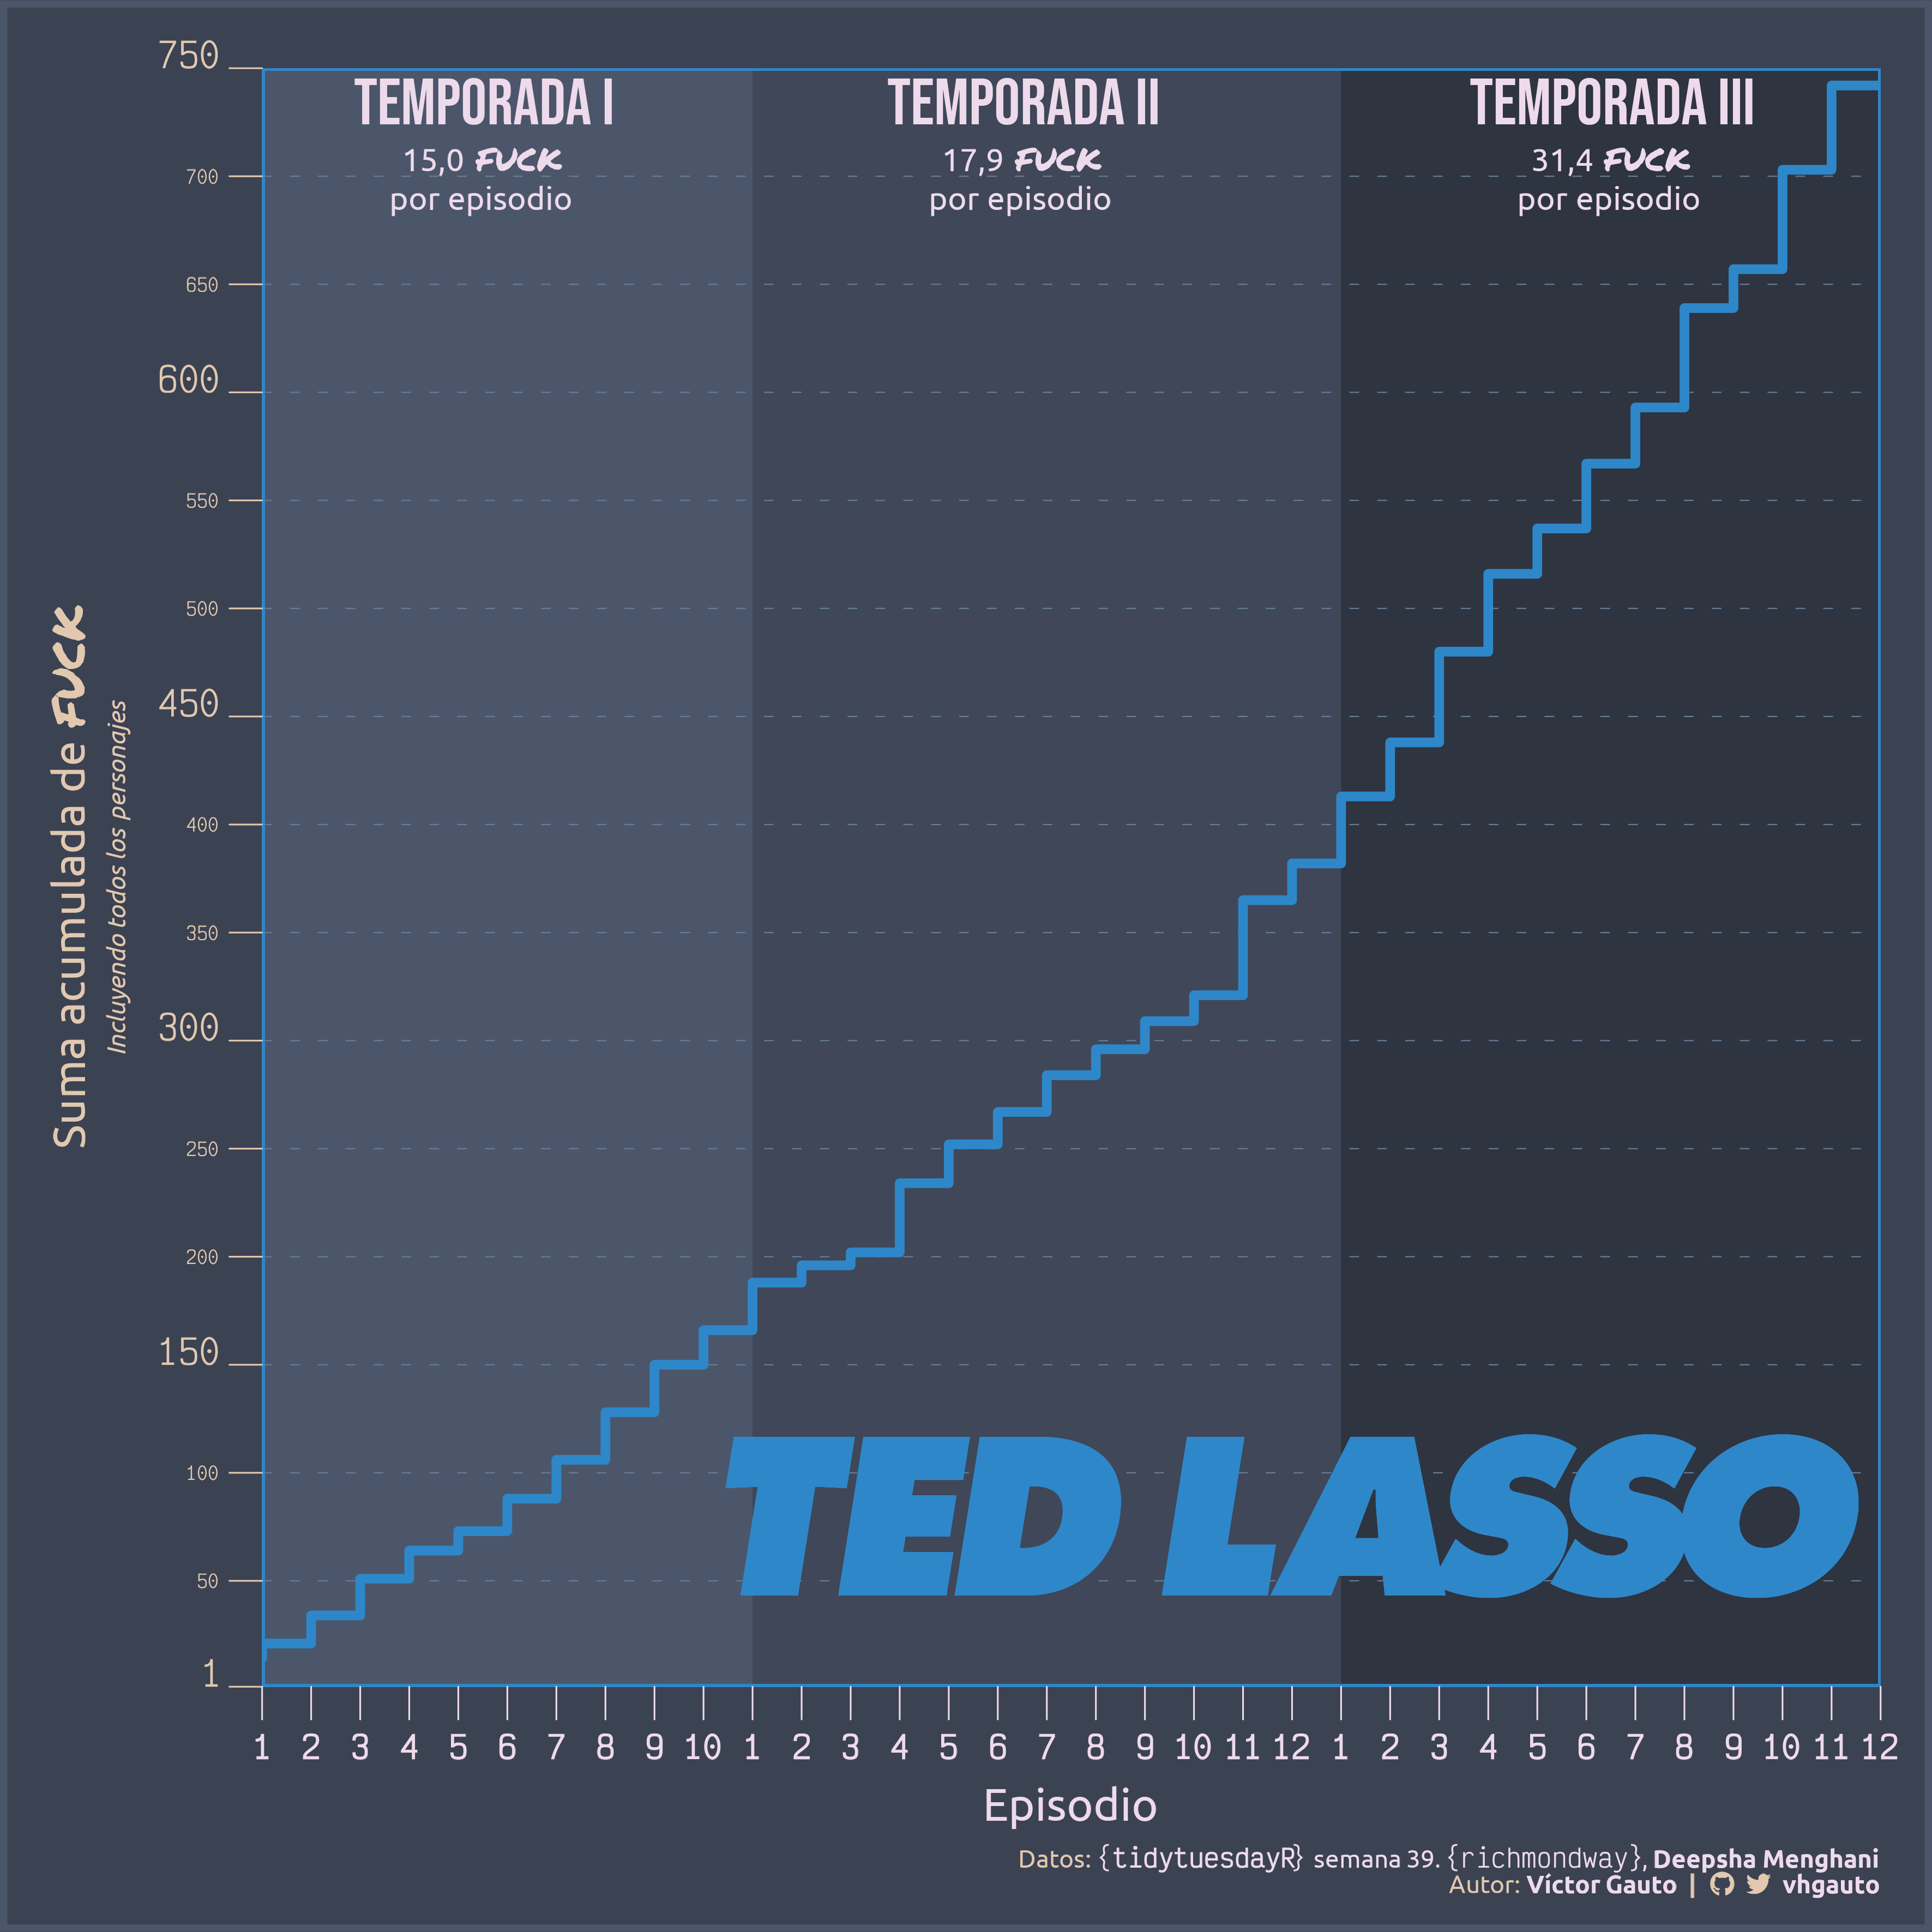
datos <- richmondway::richmondway
fuck <- "<b style='font-family:marker'>FUCK</b>"
# me interesa el conteo acumulado de 'fuck' a lo largo de todos los episodios
# posición de los finales de temporada, para indicar los límites de las áreas
v <- datos |>
group_by(Season) |>
slice_max(Episode) |>
mutate(Episode_order = if_else(
Episode_order != max(datos$Episode_order),
Episode_order + 1,
Episode_order)) |>
pull(Episode_order)
# ubicación de texto 'Temporada' en la parte superior
e <- datos |>
mutate(m = median(Episode), ult = max(Episode), .by = Season) |>
slice_min(Episode) |>
mutate(eje_x = Episode_order + m - 1) |>
select(eje_x, Episode_order) |>
mutate(label = glue("Temporada {c('I', 'II', 'III')}")) |>
mutate(v1 = v)
# promedio de 'fuck' por episodio, por temporada
h <- datos |>
summarise(prom = sum(F_count_total)/n(), .by = Season) |>
mutate(prom = gt::vec_fmt_number(prom, decimals = 1, sep_mark = "", dec_mark = ",")) |>
mutate(eje_x = e$eje_x) |>
mutate(label = glue("{prom} {fuck}<br>por episodio"))
# figura ------------------------------------------------------------------
# logo de Ted Lasso
logo <- "2023/semana_39/logo.png"
# tibble para ubicar el logo
l <- tibble(
x = 22,
y = 80,
path = logo
)
# límite del eje vertical, para ubicar el texto de 'Temporada' y los promedios
lim_eje_y <- 750
# título del eje vertical
tit_eje_y <- glue(
"Suma acumulada de {fuck}<br>",
"<span style='font-size:15px'>*Incluyendo todos los personajes*</span>")
# figura
g <- ggplot(datos, aes(Episode_order, cum_total_overall)) +
# rectángulos que delimitan las temporadas
geom_rect(
data = e,
aes(xmin = Episode_order, xmax = v1, ymin = 1, ymax = lim_eje_y, fill = label),
show.legend = FALSE, inherit.aes = FALSE) +
# líneas horizontales
geom_hline(
yintercept = seq(50, lim_eje_y, 50), linetype = "8f", color = c4,
linewidth = .25) +
# texto 'Temporada' en la parte superior
geom_text(
data = e, aes(x = eje_x, y = lim_eje_y - 5, label = label),
vjust = 1, hjust = .5, color = c3, family = "bebas", size = 10) +
# texto de promedio de 'fuck' por episodio, por temporada
geom_richtext(
data = h, aes(x = eje_x, y = lim_eje_y - 33, label = label),
color = c3, family = "ubuntu", size = 5, fill = NA, label.color = NA,
vjust = 1) +
# escalera
geom_step(color = c6, direction = "vh", linewidth = 2) +
# logo
geom_from_path(data = l, aes(x, y, path = path), width = .7) +
# recuadro del panel
geom_rect(
aes(xmin = 1, xmax = 34, ymin = 1, ymax = lim_eje_y), color = c6,
fill = NA, linewidth = 1) +
# manual
scale_x_continuous(labels = datos$Episode, breaks = seq(1, 34, 1)) +
scale_y_continuous(
breaks = c(1, seq(50, lim_eje_y, 50))) +
nord::scale_fill_nord(palette = "polarnight", reverse = TRUE) +
coord_cartesian(expand = FALSE, clip = "on", ylim = c(1, lim_eje_y)) +
labs(
x = "Episodio",
y = tit_eje_y,
caption = mi_caption) +
theme_void() +
theme(
aspect.ratio = 1,
plot.margin = margin(30, 22.7, 10, 22.7),
axis.ticks.x = element_line(color = c3),
axis.ticks.y = element_line(color = c1),
axis.ticks.length = unit(1, "line"),
plot.background = element_rect(fill = c5, color = c7, linewidth = 3),
plot.caption = element_markdown(
color = c1, family = "ubuntu", size = 11, margin = margin(10, 0, 5, 0)),
axis.text.x = element_text(
family = "victor", color = c3, size = 14, margin = margin(5, 0, 0, 0),
face = "bold"),
axis.text.y = element_text(
color = c1, family = "victor", vjust = c(rep(c(0, .5, .5), 5), 0), hjust = 1,
margin = margin(0, 5, 0, 0), size = c(rep(c(15, 8, 8), 5), 15)),
axis.title.x = element_text(
color = c3, family = "ubuntu", size = 20, margin = margin(10, 0, 0, 0)),
axis.title.y = element_markdown(
color = c1, family = "ubuntu", size = 20, angle = 90,
margin = margin(0, 10, 0, 0))
); ggsave(
plot = g,
filename = "2023/semana_39/viz.png",
width = 30,
height = 30,
units = "cm"
); browseURL("2023/semana_39/viz.png")