# paquetes ----------------------------------------------------------------
library(glue)
library(ggtext)
library(showtext)
library(waffle)
library(tidyverse)
# uso del paquete {waffle}
browseURL("https://github.com/hrbrmstr/waffle/")
# fuente ------------------------------------------------------------------
# colores
c1 <- "grey90"
c2 <- "#F6F2EE"
c3 <- "#003967"
c4 <- "#A82203"
c5 <- "#F1AF3A"
# fuente: Ubuntu
font_add(
family = "ubuntu",
regular = "fuente/Ubuntu-Regular.ttf",
bold = "fuente/Ubuntu-Bold.ttf",
italic = "fuente/Ubuntu-Italic.ttf")
# fuente: Victor
font_add(
family = "victor",
regular = "fuente/VictorMono-ExtraLight.ttf",
bold = "fuente/VictorMono-VariableFont_wght.ttf",
italic = "fuente/VictorMono-ExtraLightItalic.ttf")
# fuente: Bebas Neue
font_add(
family = "bebas",
regular = "fuente/BebasNeue-Regular.ttf")
# íconos
font_add("fa-brands", "icon/Font Awesome 6 Brands-Regular-400.otf")
showtext_auto()
showtext_opts(dpi = 300)
# caption
fuente <- glue(
"Datos: <span style='color:{c3};'><span style='font-family:mono;'>",
"{{<b>tidytuesdayR</b>}}</span> semana {8}. ",
"R Consortium Infrastructure Steering Committee.</span>")
autor <- glue("<span style='color:{c3};'>**Víctor Gauto**</span>")
icon_twitter <- glue("<span style='font-family:fa-brands;'></span>")
icon_instagram <- glue("<span style='font-family:fa-brands;'></span>")
icon_github <- glue("<span style='font-family:fa-brands;'></span>")
icon_mastodon <- glue("<span style='font-family:fa-brands;'></span>")
usuario <- glue("<span style='color:{c3};'>**vhgauto**</span>")
sep <- glue("**|**")
mi_caption <- glue(
"{fuente}<br>{autor} {sep} {icon_github} {icon_twitter} {icon_instagram} ",
"{icon_mastodon} {usuario}")
# datos -------------------------------------------------------------------
tuesdata <- tidytuesdayR::tt_load(2024, 8)
isc_grants <- tuesdata$isc_grants
# me interesan la cantidad de becas por año, y de cuanto dinero
# divido las becas en rangos de 10000 USD
# primero utilizo nros enteros para luego usar labels y transformar a factor a
# partir de esos nros enteros
d <- isc_grants |>
filter(funded != 0) |>
select(year, funded) |>
mutate(
rango = case_when(
funded < 1e4 ~ 1,
between(funded, 1e4, 2e4) ~ 2,
between(funded, 2e4, 3e4) ~ 3,
between(funded, 3e4, 4e4) ~ 4,
between(funded, 4e4, 5e4) ~ 5,
funded > 5e4 ~ 6
)
) |>
mutate(label = case_match(
rango,
1 ~ "< 10.000",
2 ~ "10.000 ~ 20.000",
3 ~ "20.000 ~ 30.000",
4 ~ "30.000 ~ 40.000",
5 ~ "40.000 ~ 50.000",
6 ~ "> 50.000",
)) |>
mutate(label = fct_reorder(label, rango)) |>
count(label, year, rango)
# figura ------------------------------------------------------------------
# valores para usar en el subtítulo
grant_n <- nrow(isc_grants)
grant_s <- sum(isc_grants$funded) |>
format(x = _, big.mark = ".", decimal.mark = ",")
grant_i <- min(isc_grants$year)
grant_f <- max(isc_grants$year)
# subtítulo
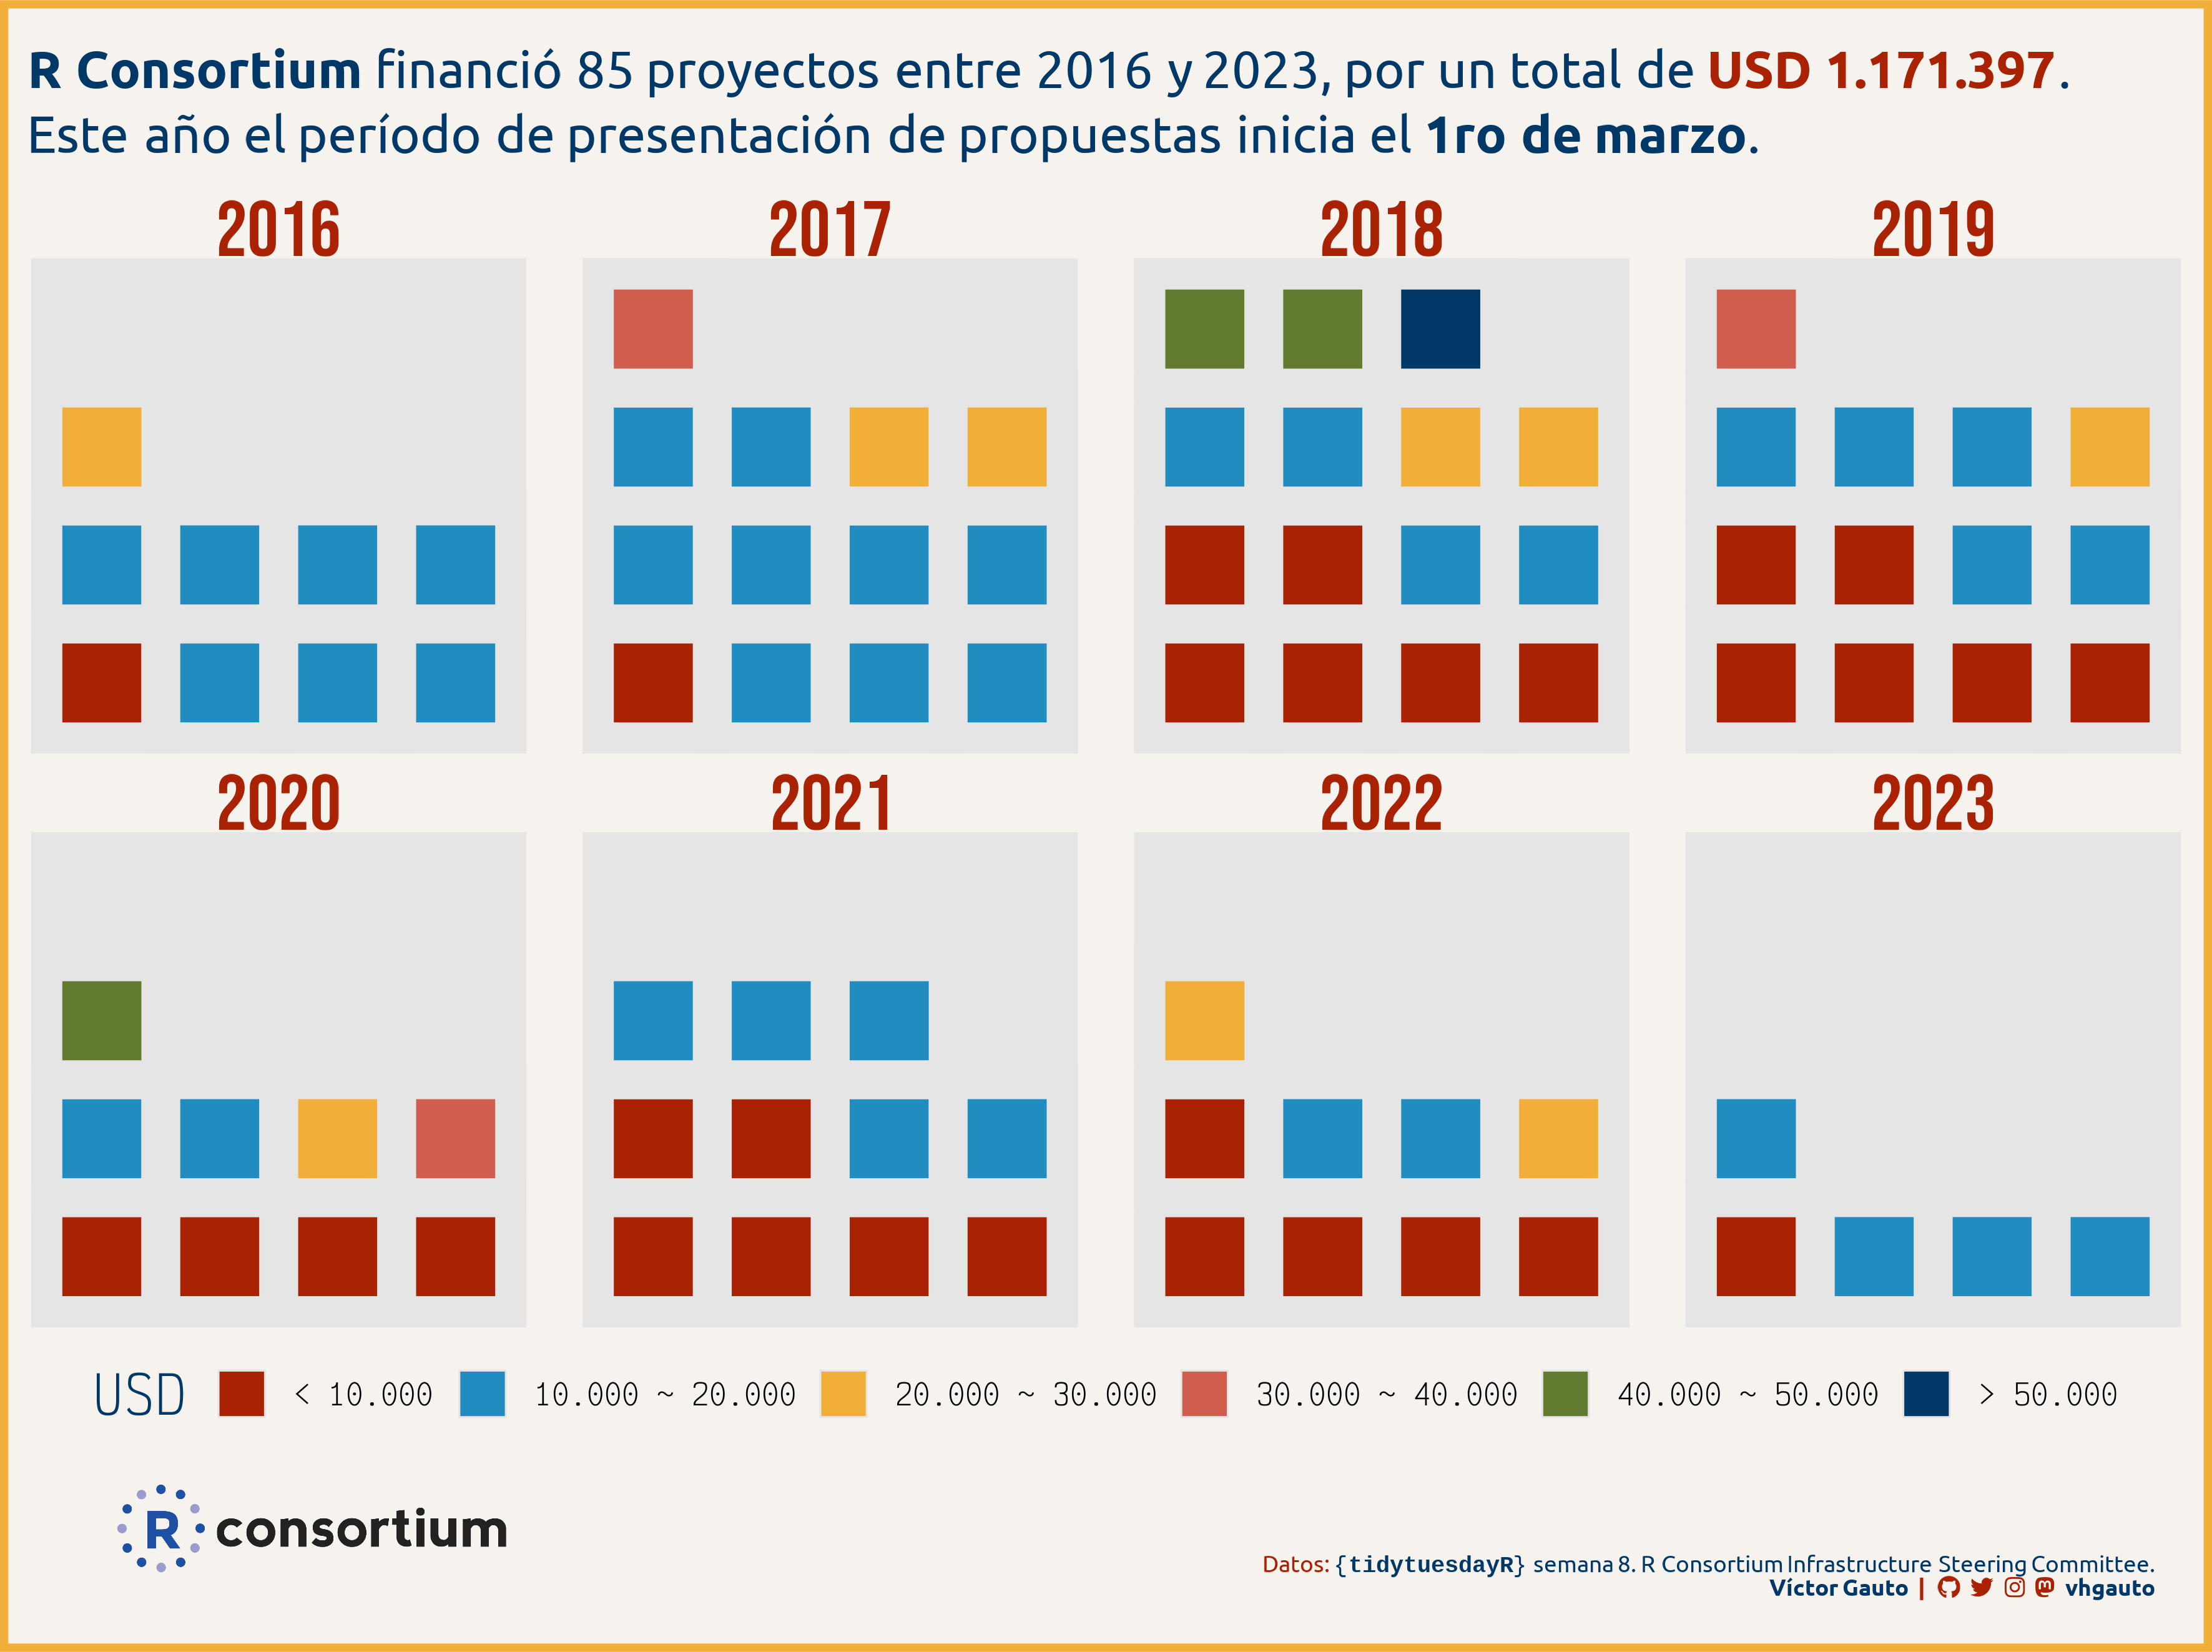
mi_subtitle <- glue(
"**R Consortium** financió {grant_n} proyectos entre {grant_i} y {grant_f}, ",
"por un total de <b style='color:{c4};'>USD {grant_s}</b>.<br>",
"Este año el período de presentación de propuestas inicia el **1ro de marzo**."
)
# logo de R Consortium
logo <- "<img src='2024/s08/logo.png' width='150'></img>"
# epígrafe completo
caption_logo <- glue(
"{logo}",
"<span style='color:{c2};'>{str_flatten(rep('.', 100))}</span>",
"{mi_caption}")
# figura
g <- ggplot(d, aes(fill = label, values = n)) +
# waffle
geom_waffle(
color = c1, size = 7, alpha = 1, flip = TRUE, n_rows = 4) +
# faceta
facet_wrap(vars(year), nrow = 2) +
# ejes
scale_x_continuous(expand = c(0, .1)) +
scale_y_continuous(expand = c(0, .1)) +
MetBrewer::scale_fill_met_d(name = "Juarez") +
coord_equal() +
labs(
fill = "USD", subtitle = mi_subtitle,
caption = caption_logo) +
guides(fill = guide_legend(nrow = 1)) +
theme_void() +
theme(
plot.background = element_rect(fill = c2, color = c5, linewidth = 3),
plot.margin = margin(r = 12, l = 12, t = 20, b = 20),
plot.title.position = "plot",
plot.subtitle = element_markdown(
family = "ubuntu", size = 20, color = c3, margin = margin(b = 13.9),
lineheight = unit(1.25, "line")),
plot.caption = element_markdown(
color = c4, family = "ubuntu", margin = margin(b = 0, r = 10, t = 25)),
panel.background = element_rect(fill = c1, color = NA),
panel.spacing.x = unit(1.5, "line"),
panel.spacing.y = unit(.5, "line"),
strip.text = element_text(size = 30, color = c4, family = "bebas"),
legend.position = "bottom",
legend.direction = "horizontal",
legend.key.size = unit(6, "mm"),
legend.margin = margin(t = 10),
legend.title = element_text(family = "victor", size = 20, color = c3),
legend.text = element_text(size = 11, family = "victor")
)
# guardo
ggsave(
plot = g,
filename = "2024/s08/viz.png",
width = 30,
height = 22.41,
units = "cm"
)
# abro
browseURL("2024/s08/viz.png")