Ocultar código
library(glue)
library(ggtext)
library(showtext)
library(tidyverse)Sitio en construcción
Víctor Gauto
30 de octubre de 2025
Financiamiento de la Biblioteca Británica.

Colores.
Fuentes: Ubuntu y JetBrains Mono.
fuente <- glue(
    "Datos: <span style='color:{c5};'><span style='font-family:jet;'>",
    "{{<b>tidytuesdayR</b>}}</span> semana 28, ",
    "<b>British Library's Annual Report</b>.</span>"
)
autor <- glue("<span style='color:{c5};'>**Víctor Gauto**</span>")
icon_twitter <- glue("<span style='font-family:jet;'></span>")
icon_instagram <- glue("<span style='font-family:jet;'></span>")
icon_github <- glue("<span style='font-family:jet;'></span>")
icon_mastodon <- glue("<span style='font-family:jet;'>󰫑</span>")
icon_bsky <- glue("<span style='font-family:jet;'></span>")
usuario <- glue("<span style='color:{c5};'>**vhgauto**</span>")
sep <- glue("**|**")
mi_caption <- glue(
    "{fuente}<br>{autor} {sep} {icon_github} {icon_twitter} {icon_instagram} ",
    "{icon_mastodon} {icon_bsky} {usuario}"
)Me interesa la financiación anual de la Biblioteca Británica, actualizada al 2000.
set.seed(2025)
d <- bl_funding |> 
  select(year, total_y2000_gbp_millions) |> 
  mutate(total_y2000_gbp_millions = round(total_y2000_gbp_millions/10)) |> 
  mutate(monto = map(total_y2000_gbp_millions, ~0:.x)) |> 
  unnest(monto) %>%
  mutate(
    color = sample(c(c2, c1), size = nrow(.), replace = TRUE)
  ) |> 
  mutate(
    label = glue(
      "<span style='font-family:jet;color: {color}'>󰃀</span>"
    )
  )Ícono de libro, logo y título.
Figura.
g <- d |> 
  ggplot(aes(year, monto)) +
  ggimage::geom_image(
    x = I(.96),
    y = I(.85),
    image = logo,
    size = .055,
    inherit.aes = FALSE
  ) +
  geom_richtext(
    aes(label = label), fill = NA, label.color = NA, size = 12
  ) +
  annotate(
    geom = "richtext",
    x = I(1),
    y = I(1),
    label = glue("{libro} = 10 millones \u00A3, año 2000"),
    hjust = 1,
    vjust = 0,
    fill = NA,
    label.color = NA,
    size = 6,
    family = "ubuntu",
    color = c4
  ) +
  scale_y_continuous(breaks = scales::breaks_width(2)) +
  coord_cartesian(
    xlim = c(1997, 2024), ylim = c(-.2, 14.1), expand = FALSE, clip = "off"
  ) +
  labs(x = NULL, y = NULL, title = mi_titulo, caption = mi_caption) +
  theme_void(base_size = 16, base_family = "ubuntu") +
  theme(
    plot.margin = margin(20, 20, 20, 20),
    plot.background = element_rect(fill = c3, color = NA),
    plot.title = element_markdown(
      margin = margin(b = 25), color = c4, size = 25
    ),
    plot.caption = element_markdown(
      color = c4, size = rel(.8), lineheight = 1.2, margin = margin(t = 20)
    ),
    axis.text = element_text(
      family = "jet", size = rel(1.1), color = c4, margin = margin(t = 20)
    ),
    panel.grid.major = element_line(linewidth = .1, color = c4, linetype = "FF")
  )
ggsave(
  plot = g,
  filename = "tidytuesday/2025/semana_28.png",
  width = 30,
  height = 30,
  units = "cm"
)Guardo.
---
format:
  html:
    code-fold: show
    code-summary: "Ocultar código"
    code-line-numbers: false
    code-annotations: false
    code-link: true
    code-tools:
        source: true
        toggle: true
        caption: "Código"
    code-overflow: scroll
    page-layout: full
editor_options:
  chunk_output_type: console
categories:
  - geom_image
  - geom_richtext
execute:
  eval: false
  echo: true
  warning: false
title: "Semana 28"
date: last-modified
author: Víctor Gauto
---
Financiamiento de la [Biblioteca Británica](https://www.bl.uk/).

## Paquetes
```{r}
library(glue)
library(ggtext)
library(showtext)
library(tidyverse)
```
## Estilos
Colores.
```{r}
c1 <- "#0069B3"
c2 <- scales::col_darker(c1, 5)
c3 <- scales::col_lighter(c1, 20)
c4 <- "white"
c5 <- "#DB002A"
```
Fuentes: Ubuntu y JetBrains Mono.
```{r}
font_add(
  family = "ubuntu",
  regular = "././fuente/Ubuntu-Regular.ttf",
  bold = "././fuente/Ubuntu-Bold.ttf",
  italic = "././fuente/Ubuntu-Italic.ttf"
)
font_add(
  family = "jet",
  regular = "././fuente/JetBrainsMonoNLNerdFontMono-Regular.ttf"
)
showtext_auto()
showtext_opts(dpi = 300)
```
## Epígrafe
```{r}
fuente <- glue(
    "Datos: <span style='color:{c5};'><span style='font-family:jet;'>",
    "{{<b>tidytuesdayR</b>}}</span> semana 28, ",
    "<b>British Library's Annual Report</b>.</span>"
)
autor <- glue("<span style='color:{c5};'>**Víctor Gauto**</span>")
icon_twitter <- glue("<span style='font-family:jet;'></span>")
icon_instagram <- glue("<span style='font-family:jet;'></span>")
icon_github <- glue("<span style='font-family:jet;'></span>")
icon_mastodon <- glue("<span style='font-family:jet;'>󰫑</span>")
icon_bsky <- glue("<span style='font-family:jet;'></span>")
usuario <- glue("<span style='color:{c5};'>**vhgauto**</span>")
sep <- glue("**|**")
mi_caption <- glue(
    "{fuente}<br>{autor} {sep} {icon_github} {icon_twitter} {icon_instagram} ",
    "{icon_mastodon} {icon_bsky} {usuario}"
)
```
## Datos
```{r}
tuesdata <- tidytuesdayR::tt_load(2025, 28)
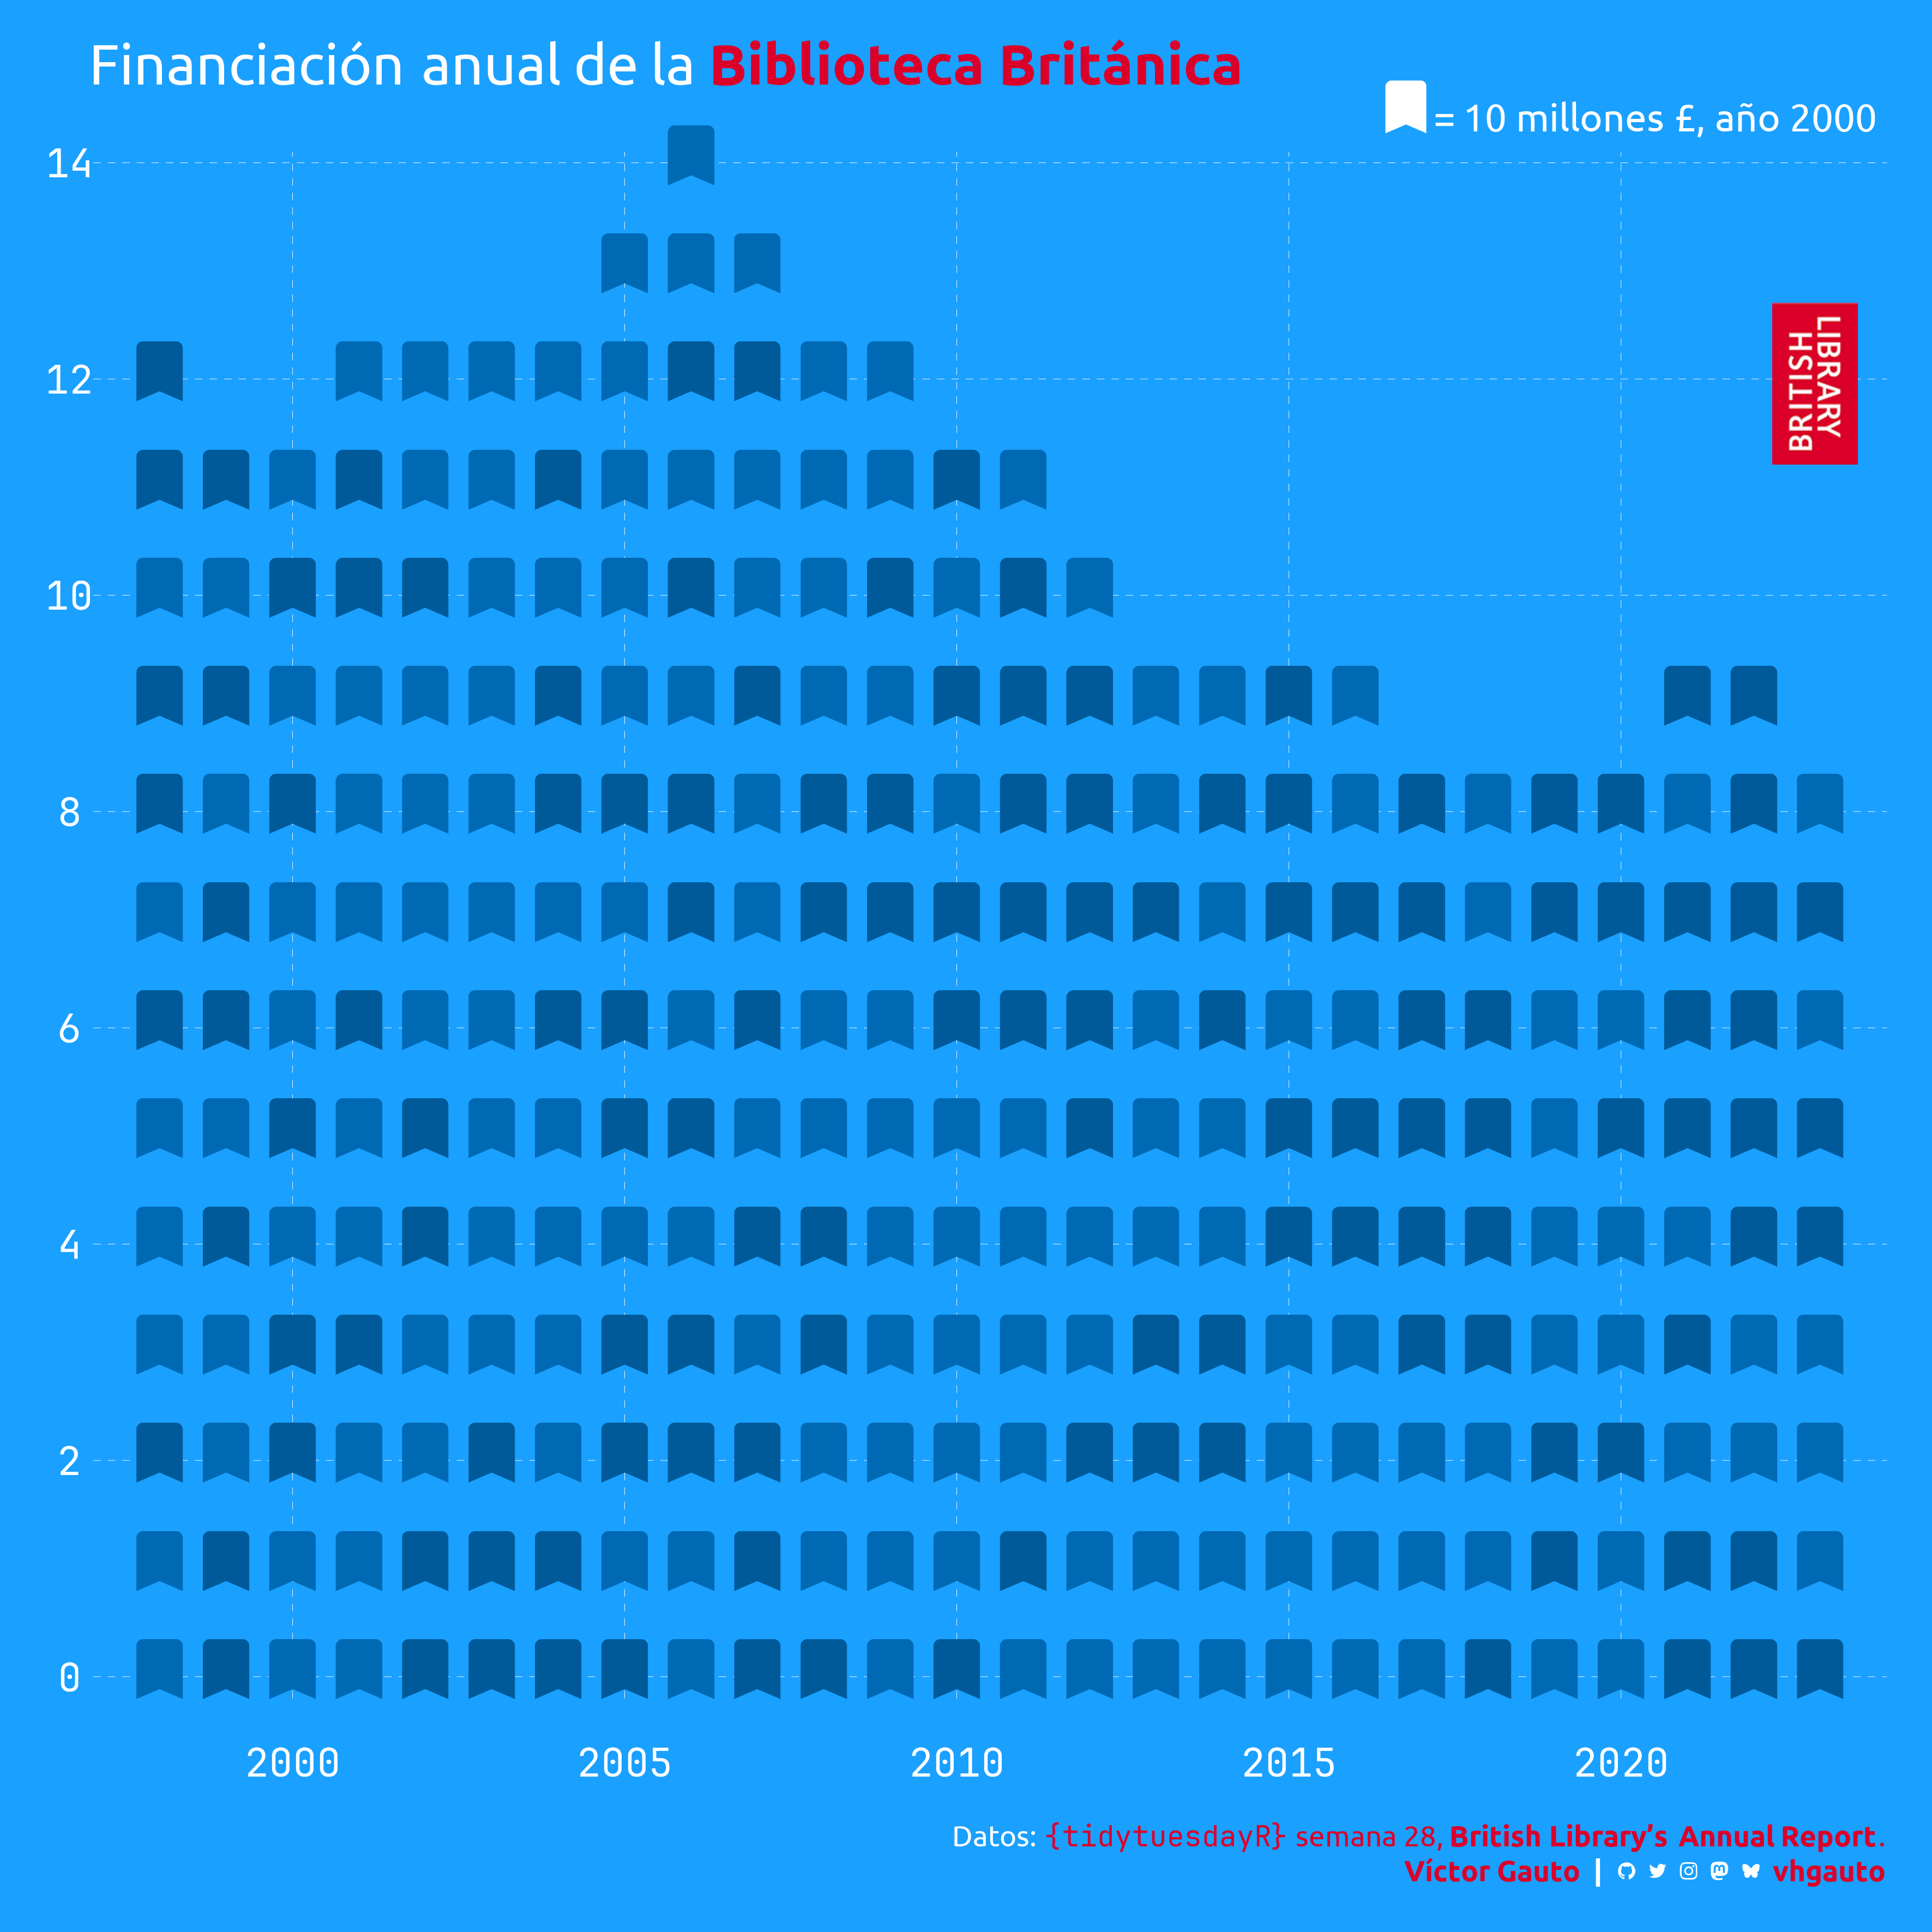
bl_funding <- tuesdata$bl_funding
```
## Procesamiento
Me interesa la financiación anual de la Biblioteca Británica, actualizada al 2000.
```{r}
set.seed(2025)
d <- bl_funding |> 
  select(year, total_y2000_gbp_millions) |> 
  mutate(total_y2000_gbp_millions = round(total_y2000_gbp_millions/10)) |> 
  mutate(monto = map(total_y2000_gbp_millions, ~0:.x)) |> 
  unnest(monto) %>%
  mutate(
    color = sample(c(c2, c1), size = nrow(.), replace = TRUE)
  ) |> 
  mutate(
    label = glue(
      "<span style='font-family:jet;color: {color}'>󰃀</span>"
    )
  )
```
## Figura
Ícono de libro, logo y título.
```{r}
libro <- glue(
  "<span style='font-family:jet; font-size: 30pt;'>󰃀</span>"
)
mi_titulo <- glue(
  "Financiación anual de la <b style='color: {c5}'>Biblioteca Británica</b>"
)
logo <- "https://www.imagesonline.bl.uk/wp-content/uploads/2020/07/BL-Logo_RGB-resized.jpg"
```
Figura.
```{r}
g <- d |> 
  ggplot(aes(year, monto)) +
  ggimage::geom_image(
    x = I(.96),
    y = I(.85),
    image = logo,
    size = .055,
    inherit.aes = FALSE
  ) +
  geom_richtext(
    aes(label = label), fill = NA, label.color = NA, size = 12
  ) +
  annotate(
    geom = "richtext",
    x = I(1),
    y = I(1),
    label = glue("{libro} = 10 millones \u00A3, año 2000"),
    hjust = 1,
    vjust = 0,
    fill = NA,
    label.color = NA,
    size = 6,
    family = "ubuntu",
    color = c4
  ) +
  scale_y_continuous(breaks = scales::breaks_width(2)) +
  coord_cartesian(
    xlim = c(1997, 2024), ylim = c(-.2, 14.1), expand = FALSE, clip = "off"
  ) +
  labs(x = NULL, y = NULL, title = mi_titulo, caption = mi_caption) +
  theme_void(base_size = 16, base_family = "ubuntu") +
  theme(
    plot.margin = margin(20, 20, 20, 20),
    plot.background = element_rect(fill = c3, color = NA),
    plot.title = element_markdown(
      margin = margin(b = 25), color = c4, size = 25
    ),
    plot.caption = element_markdown(
      color = c4, size = rel(.8), lineheight = 1.2, margin = margin(t = 20)
    ),
    axis.text = element_text(
      family = "jet", size = rel(1.1), color = c4, margin = margin(t = 20)
    ),
    panel.grid.major = element_line(linewidth = .1, color = c4, linetype = "FF")
  )
ggsave(
  plot = g,
  filename = "tidytuesday/2025/semana_28.png",
  width = 30,
  height = 30,
  units = "cm"
)
```
Guardo.
```{r}
ggsave(
  plot = g,
  filename = "tidytuesday/2025/semana_28.png",
  width = 30,
  height = 30,
  units = "cm"
)
```