# paquetes ----------------------------------------------------------------
library(glue)
library(ggtext)
library(showtext)
library(tidyverse)
# fuente ------------------------------------------------------------------
# colores
c1 <- "grey20"
c2 <- "grey95"
c3 <- "#FAB255"
c4 <- "#43B284"
# fuente: Ubuntu
font_add(
family = "ubuntu",
regular = "fuente/Ubuntu-Regular.ttf",
bold = "fuente/Ubuntu-Bold.ttf",
italic = "fuente/Ubuntu-Italic.ttf"
)
# monoespacio & íconos
font_add(
family = "jet",
regular = "fuente/JetBrainsMonoNLNerdFontMono-Regular.ttf"
)
# fuente de los nombres de los libros
font_add_google(
name = "Updock",
family = "updock",
db_cache = FALSE
)
showtext_auto()
showtext_opts(dpi = 300)
# caption
fuente <- glue(
"Datos: <span style='color:{c3};'><span style='font-family:jet;'>",
"{{<b>tidytuesdayR</b>}}</span> semana {38}, ",
"<b>shakespeare.mit.edu.</b></span>"
)
autor <- glue("<span style='color:{c3};'>**Víctor Gauto**</span>")
icon_twitter <- glue("<span style='font-family:jet;'></span>")
icon_instagram <- glue("<span style='font-family:jet;'></span>")
icon_github <- glue("<span style='font-family:jet;'></span>")
icon_mastodon <- glue("<span style='font-family:jet;'>󰫑</span>")
usuario <- glue("<span style='color:{c3};'>**vhgauto**</span>")
sep <- glue("**|**")
mi_caption <- glue(
"{fuente}<br>{autor} {sep} {icon_github} {icon_twitter} {icon_instagram} ",
"{icon_mastodon} {usuario}"
)
# datos -------------------------------------------------------------------
tuesdata <- tidytuesdayR::tt_load(2024, 38)
hamlet <- tuesdata$hamlet
macbeth <- tuesdata$macbeth
romeo_juliet <- tuesdata$romeo_juliet
# me interesa señalar las líneas habladas por los personajes principales
# funciones para generar las posiciones de los tiles de cada línea de cada libro
f_datos <- function(libro, nombre_libro) {
libro_n <- libro |>
drop_na() |>
nrow()
alto <- ceiling(libro_n/ancho)
d_d <- tibble(n = libro_n) |>
mutate(
x = map(n, ~ rep(1:ancho, length.out = .x)),
y = map(n, ~ rep(1:alto, length.out = .x, each = ancho))
) |>
unnest(cols = c(x, y)) |>
mutate(book = nombre_libro)
return(d_d)
}
# función para indicar las líneas habladas por los personajes ppales, por libro
f_personaje <- function(libro, nombre_libro, personaje) {
d_c <- libro |>
drop_na() |>
mutate(l = row_number()) |>
mutate(character = if_else(
character == personaje,
personaje,
NA
)) |>
select(character)
d_e <- bind_cols(
select(f_datos(libro, nombre_libro), x, y),
d_c
) |>
drop_na() |>
mutate(book = nombre_libro)
return(d_e)
}
# tiles de ancho
ancho <- 40
# indico el orden los los libros y personajes
orden_libros <- c("Romeo & Julieta", "Hamlet", "Macbeth")
orden_personajes <- c("Romeo", "Juliet", "Hamlet", "Macbeth")
# obtengo los tiles por libro, y señalo los personajes
hamlet_d <- f_datos(hamlet, "Hamlet")
hamlet_c <- f_personaje(hamlet, "Hamlet", "Hamlet")
macbeth_d <- f_datos(macbeth, "Macbeth")
macbeth_c <- f_personaje(macbeth, "Macbeth", "Macbeth")
romeo_juliet_d <- f_datos(romeo_juliet, "Romeo & Julieta")
romeo_juliet_c_romeo <- f_personaje(romeo_juliet, "Romeo & Julieta", "Romeo")
romeo_juliet_c_julieta <- f_personaje(romeo_juliet, "Romeo & Julieta", "Juliet")
# unifico los datos
d <- bind_rows(hamlet_d, macbeth_d, romeo_juliet_d) |>
mutate(book = factor(book, orden_libros))
d_c <- bind_rows(
hamlet_c, macbeth_c, romeo_juliet_c_romeo, romeo_juliet_c_julieta
) |>
mutate(character = factor(character, orden_personajes))
# figura ------------------------------------------------------------------
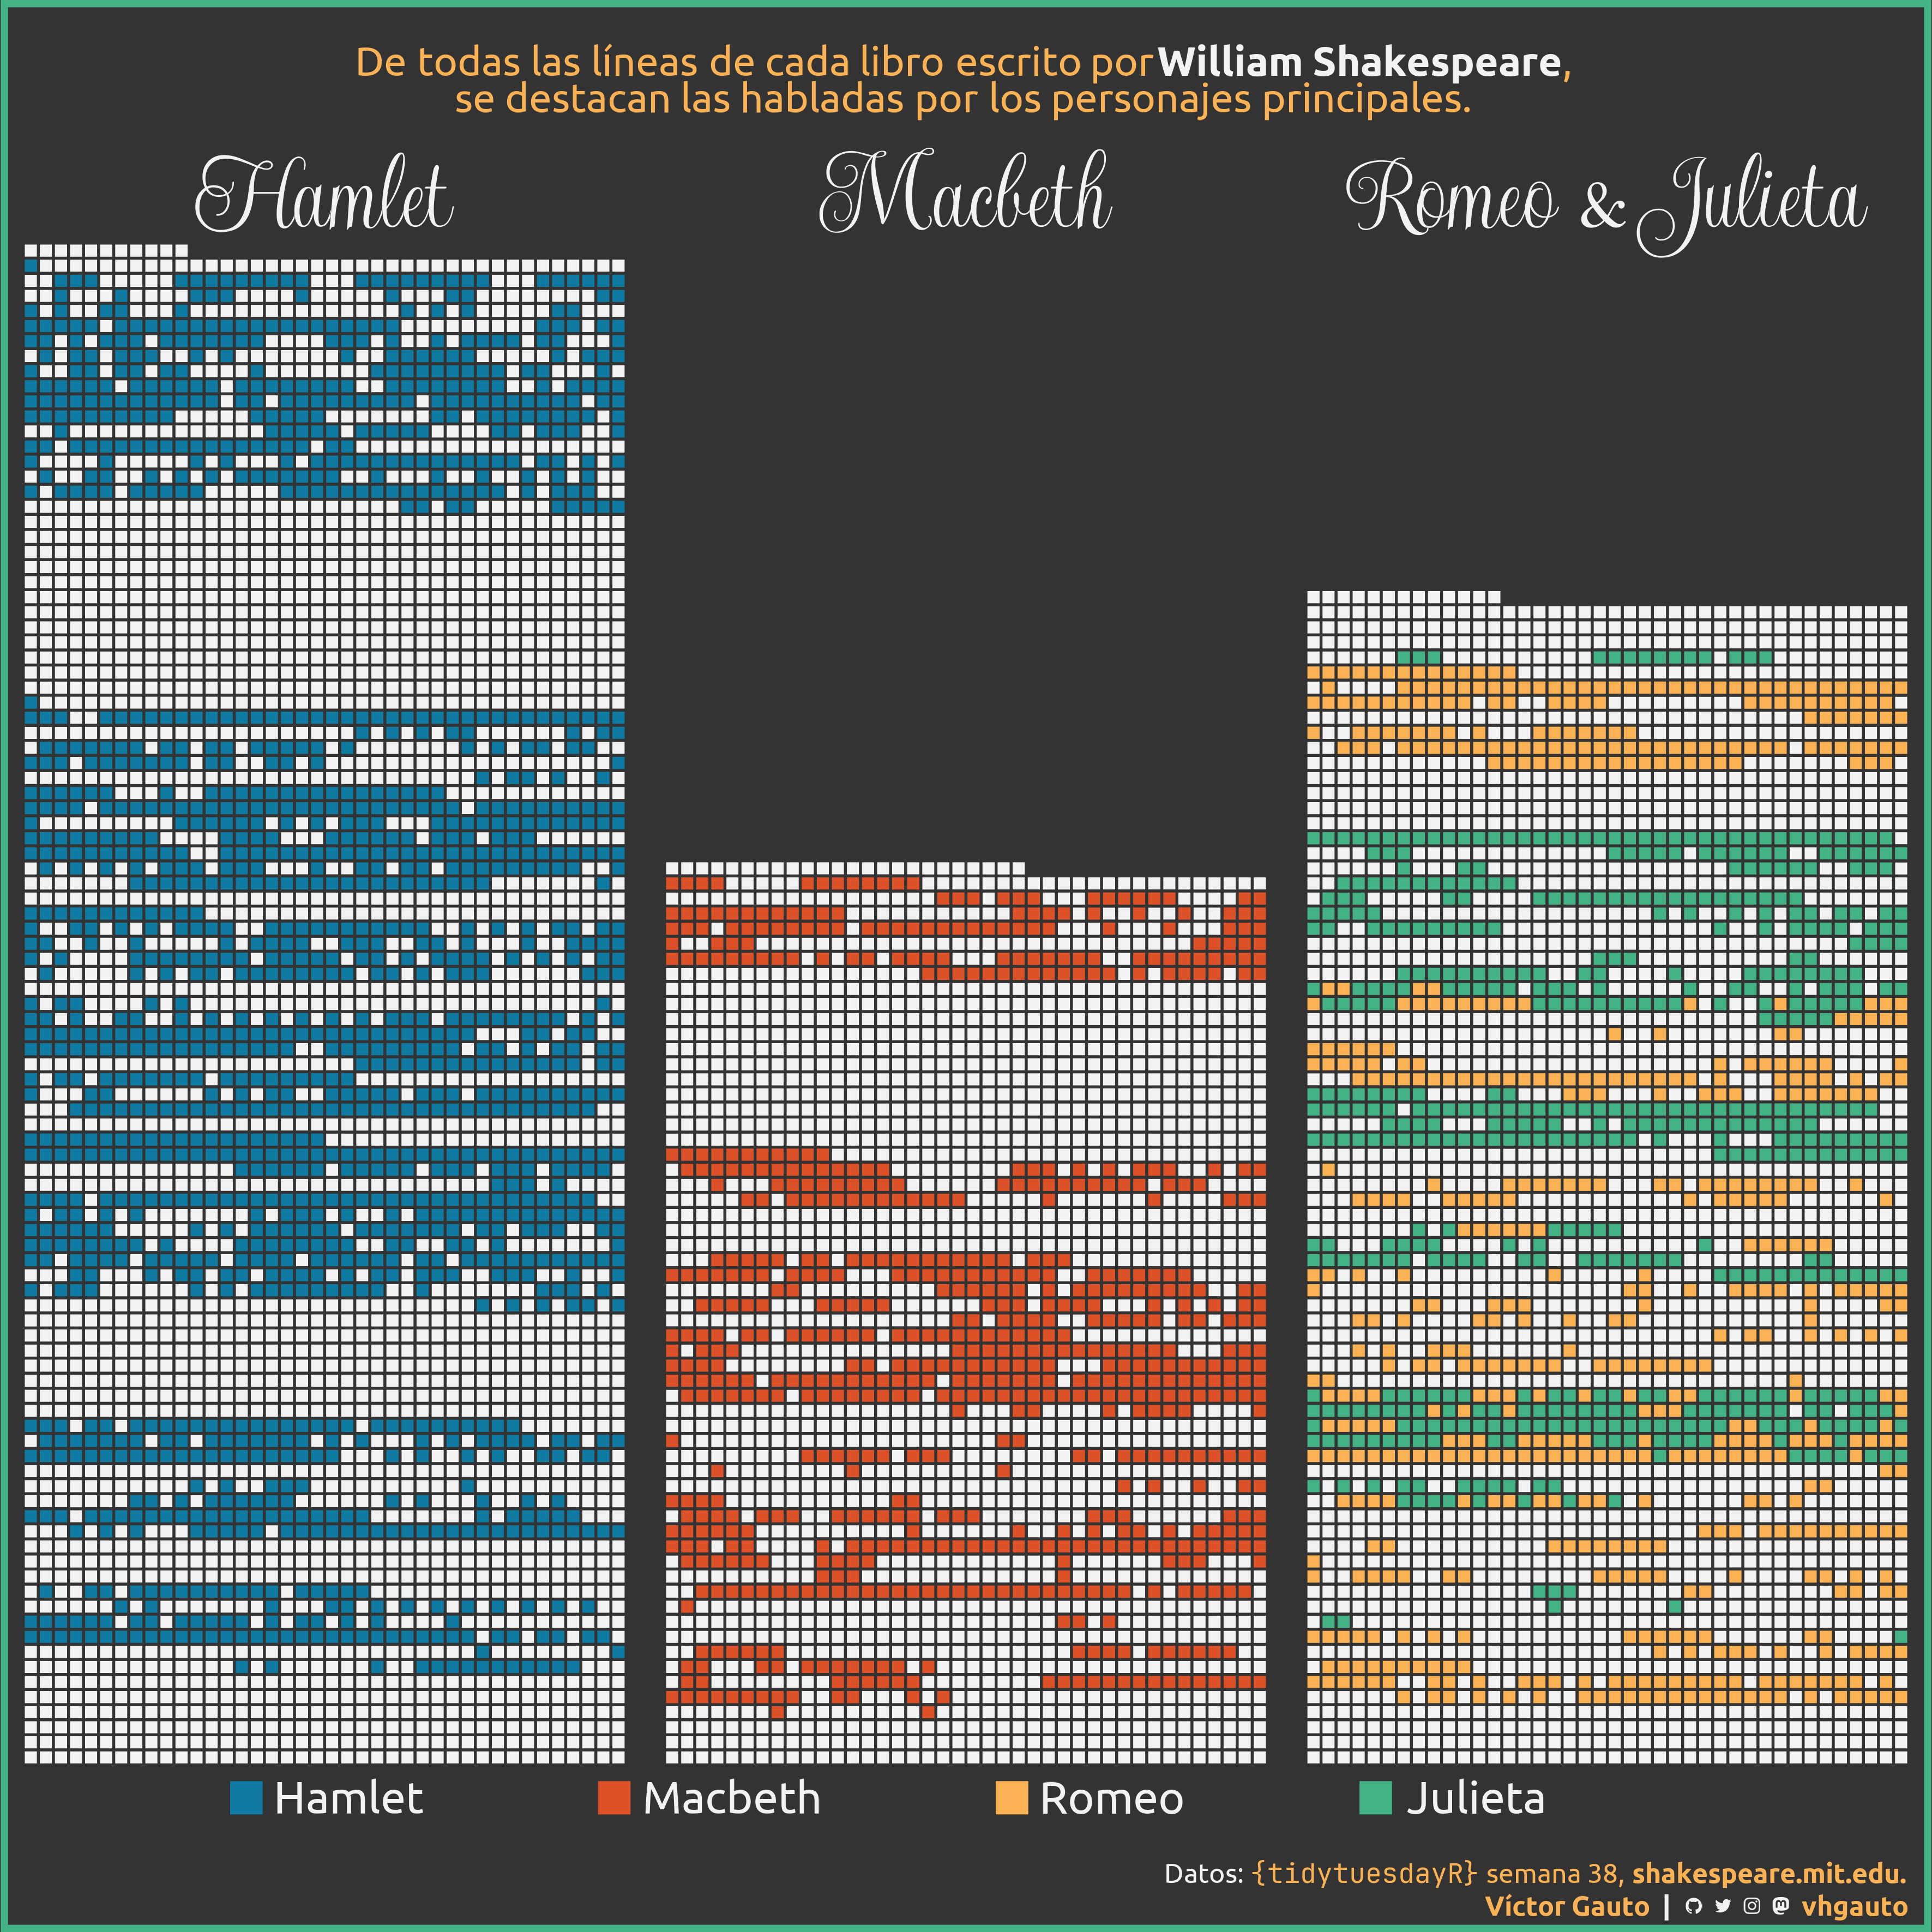
mi_subtitulo <- glue(
"De todas las líneas de cada libro escrito por",
"<b style='color: {c2}'>William Shakespeare</b>,<br>",
"se destacan las habladas por los personajes principales."
)
g <- ggplot(d, aes(x, y)) +
geom_tile(color = c1, fill = c2, linewidth = .6) +
geom_tile(
data = d_c, aes(fill = character), color = c1, linewidth = .6) +
facet_wrap(vars(book), nrow = 1) +
scale_x_continuous(breaks = scales::breaks_width(1)) +
scale_y_continuous(breaks = scales::breaks_width(1)) +
scale_fill_manual(
values = MetBrewer::met.brewer("Egypt", direction = -1),
breaks = c("Hamlet", "Macbeth", "Romeo", "Juliet"),
labels = c("Hamlet", "Macbeth", "Romeo", "Julieta")
) +
coord_equal(expand = FALSE, clip = "off") +
labs(fill = NULL, caption = mi_caption, subtitle = mi_subtitulo) +
theme_void(base_size = 7) +
theme(
plot.margin = margin(l = 10, r = 10, b = 5, t = 21),
plot.background = element_rect(fill = c1, color = c4, linewidth = 3),
plot.subtitle = element_markdown(
family = "ubuntu", size = 18, hjust = .5, color = c3,
margin = margin(b = 5)
),
plot.caption = element_markdown(
color = c2, family = "ubuntu", size = 12, margin = margin(t = 20),
lineheight = unit(1.2, "line")
),
panel.spacing.x = unit(.6, "cm"),
legend.position = "bottom",
legend.text = element_text(
family = "ubuntu", size = 20, margin = margin(r = 70, l = 5),
color = c2
),
strip.text = element_text(
family = "updock", size = 50, color = c2, face = "bold"
)
)
# guardo
ggsave(
plot = g,
filename = "2024/s38/viz.png",
width = 30,
height = 30,
units = "cm")
# abro
browseURL(glue("{getwd()}/2024/s38/viz.png"))