# paquetes ----------------------------------------------------------------
library(glue)
library(ggtext)
library(showtext)
library(ggthemes)
library(tidyverse)
# fuente ------------------------------------------------------------------
# colores
c1 <- "#841859"
c2 <- "#005600"
c3 <- "#533600"
c4 <- "grey30"
c5 <- "grey95"
# fuente: Ubuntu
font_add(
family = "ubuntu",
regular = "fuente/Ubuntu-Regular.ttf",
bold = "fuente/Ubuntu-Bold.ttf",
italic = "fuente/Ubuntu-Italic.ttf"
)
# monoespacio & íconos
font_add(
family = "jet",
regular = "fuente/JetBrainsMonoNLNerdFontMono-Regular.ttf"
)
showtext_auto()
showtext_opts(dpi = 300)
# caption
fuente <- glue(
"Datos: <span style='color:{c1};'><span style='font-family:jet;'>",
"{{<b>tidytuesdayR</b>}}</span> semana {33}, ",
"<b>List of world expositions</b>, Wikipedia.</span>"
)
autor <- glue("<span style='color:{c1};'>**Víctor Gauto**</span>")
icon_twitter <- glue("<span style='font-family:jet;'></span>")
icon_instagram <- glue("<span style='font-family:jet;'></span>")
icon_github <- glue("<span style='font-family:jet;'></span>")
icon_mastodon <- glue("<span style='font-family:jet;'>󰫑</span>")
usuario <- glue("<span style='color:{c1};'>**vhgauto**</span>")
sep <- glue("**|**")
mi_caption <- glue(
"{fuente}<br>{autor} {sep} {icon_github} {icon_twitter} {icon_instagram} ",
"{icon_mastodon} {usuario}"
)
# datos -------------------------------------------------------------------
tuesdata <- tidytuesdayR::tt_load(2024, 33)
worlds_fairs <- tuesdata$worlds_fairs
# me interesa la relación entre tamaño de la feria y cantidad de asistentes
d <- worlds_fairs |>
mutate(
inicio = make_date(start_year, start_month, 1),
fin = make_date(end_year, end_month, 1)) |>
mutate(duracion = fin - inicio) |>
mutate(duracion_dias = as.numeric(duracion)) |>
select(area, visitors, category, duracion_dias) |>
drop_na() |>
filter(duracion_dias != 0)
# feria con máxima cantidad de personas y tamaño
d_max <- d |>
slice_max(order_by = area, n = 1) |>
inner_join(worlds_fairs, by = join_by(area, visitors, category))
d_max_inicio <- format(
make_date(d_max$start_year, d_max$start_month, 1), "%B/%Y"
) |>
toupper()
d_max_fin <- format(
make_date(d_max$end_year, d_max$end_month, 1), "%B/%Y"
) |>
toupper()
d_max_label <- glue(
"<b style='color: {c1}'>Ciudad</b>: {d_max$city}",
"<b style='color: {c1}'>Inicio</b>: {d_max_inicio}",
"<b style='color: {c1}'>Cierre</b>: {d_max_fin}",
"<b style='color: {c1}'>Asistentes</b>: {format(d_max$visitors, decimal.mark = ',')} millones",
"<b style='color: {c1}'>Superficie</b>: {d_max$area} ha",
.sep = "<br>"
)
# figura -----------------------------------------------------------------
# traducción de las categorías
categorias <- c("Exposición Mundial", "Exposición Especializada")
names(categorias) <- unique(d$category)
# títulos de eje
eje_x <- "Superficie<br><span style='font-size: 13px'>(en hectáreas)</span>"
eje_y <- "Asistentes<br><span style='font-size: 13px'>(en millones)</span>"
eje_fill <- "Duración de<br>la Feria<br><span style='font-size: 13px'>(en días)</span>"
# ícono y subtítulo
icono <- glue("<span style='font-family:jet;'></span>")
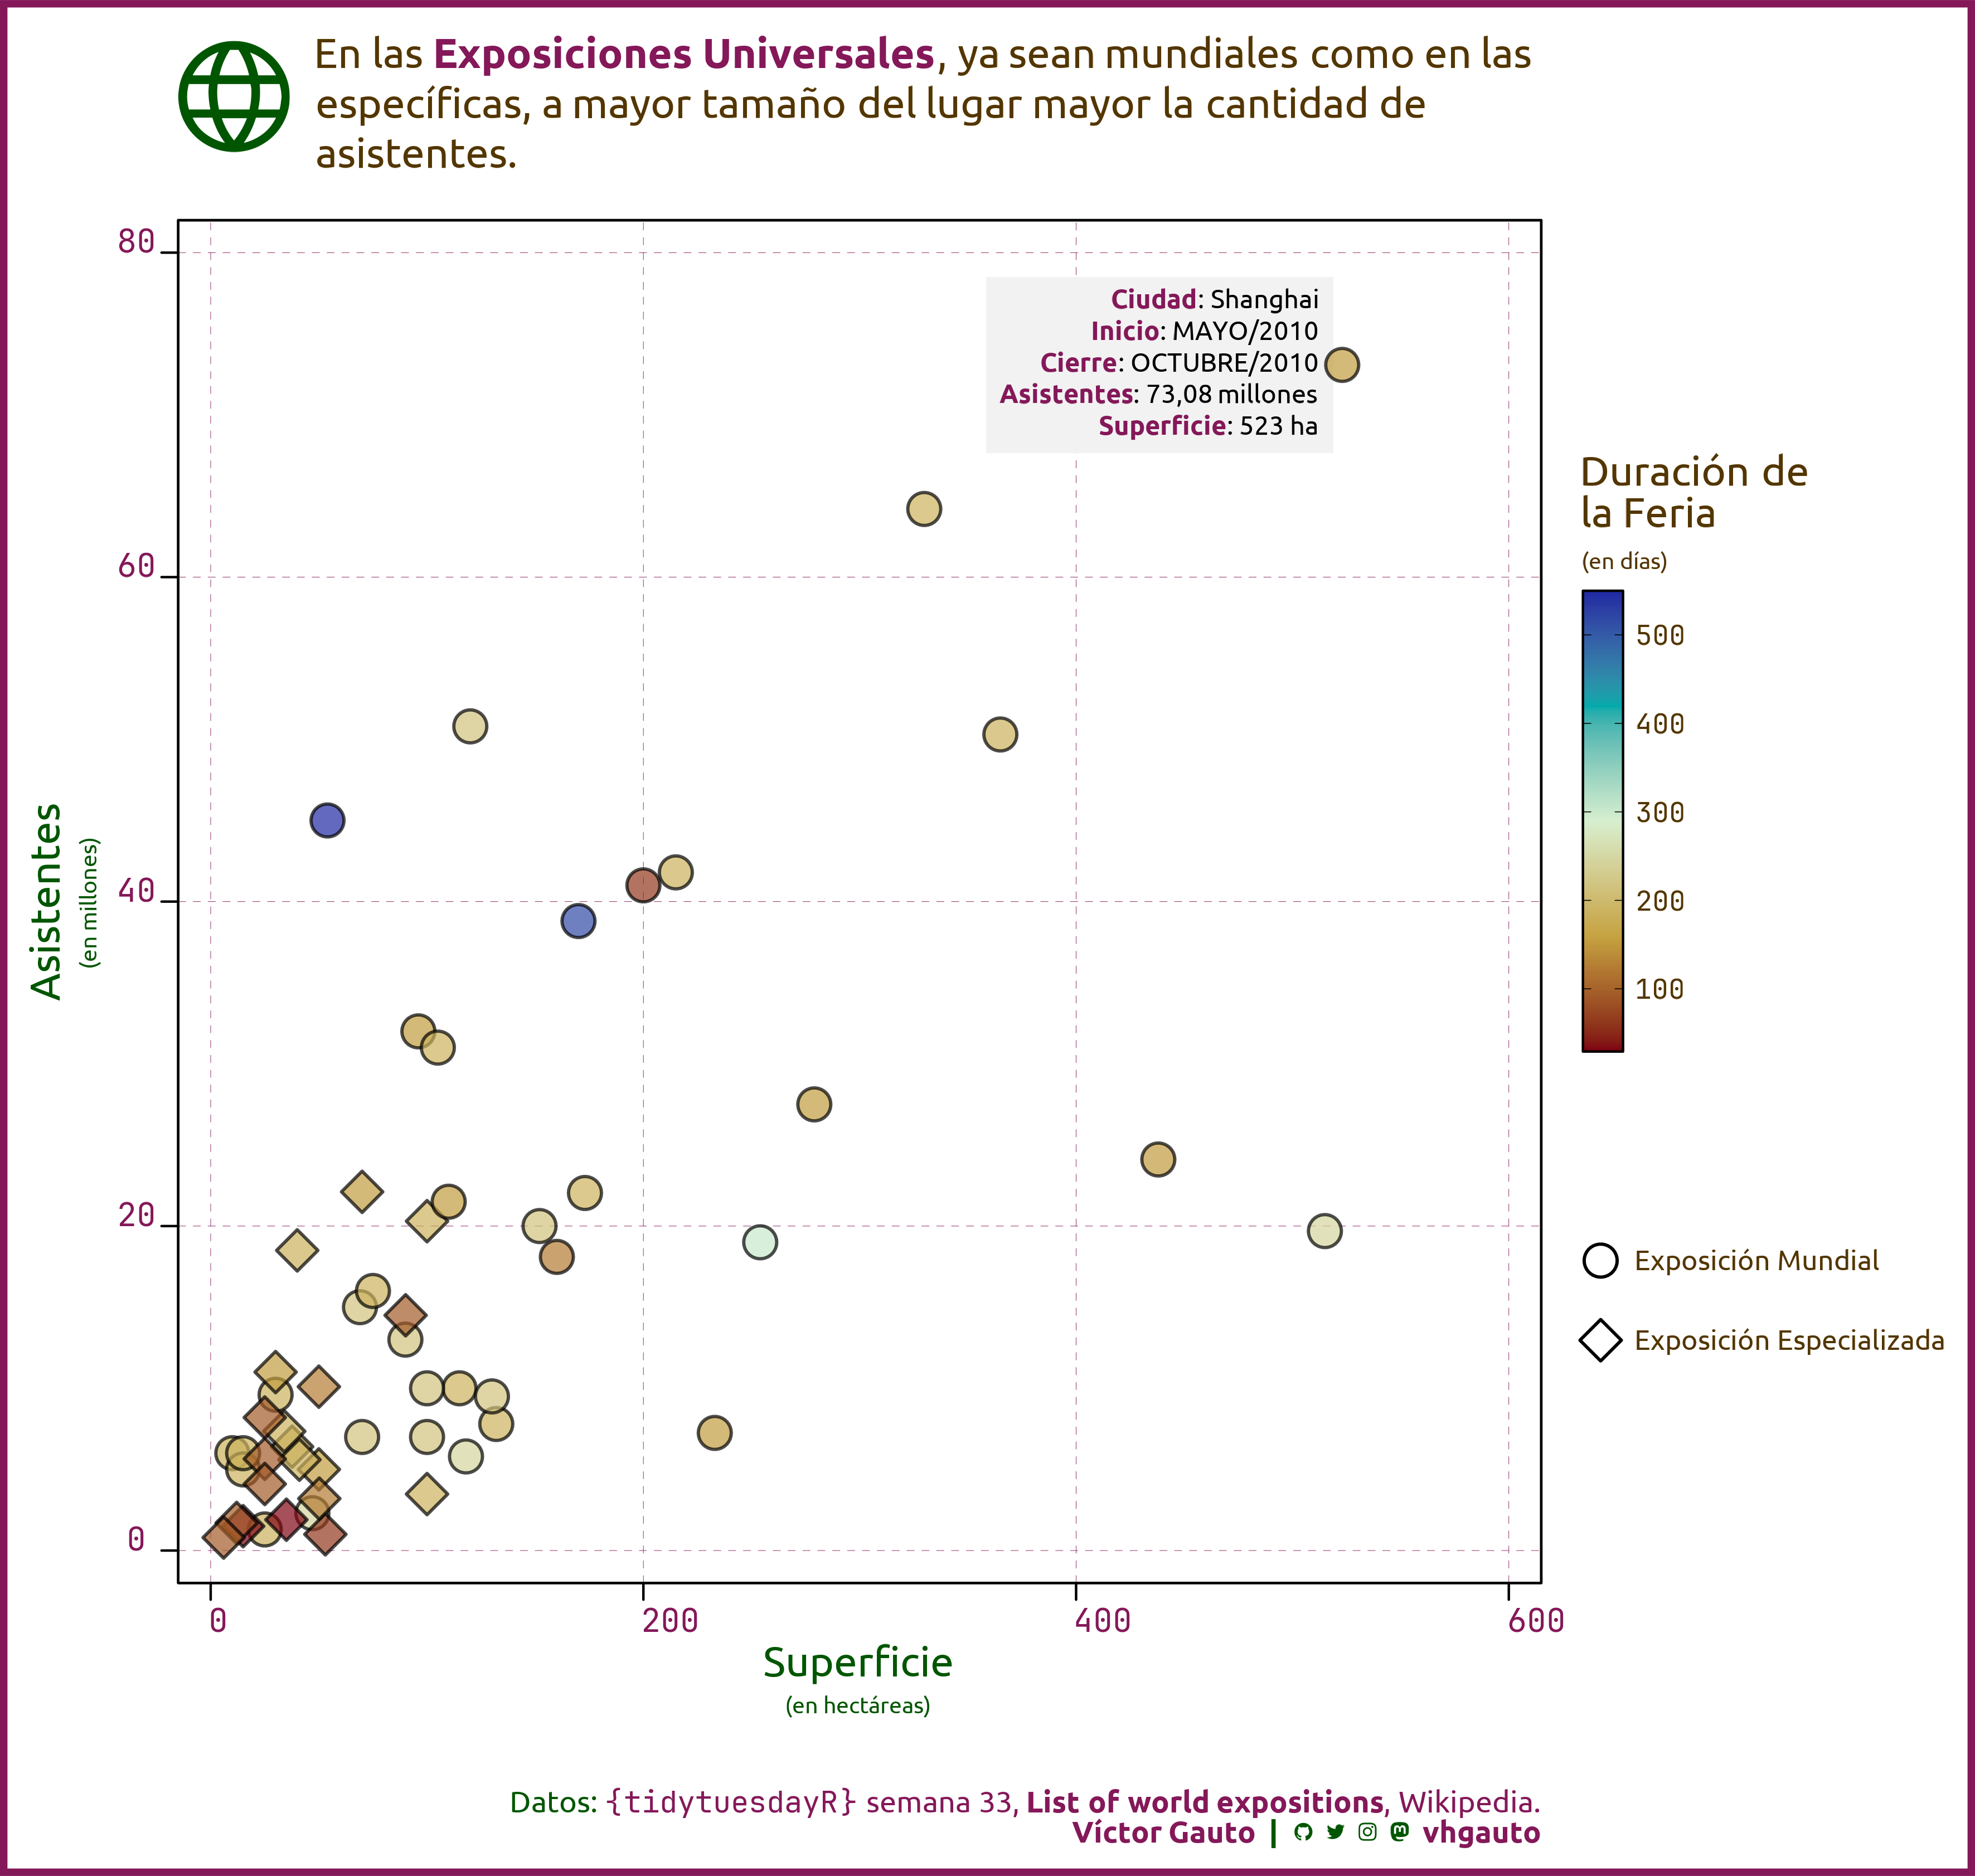
mi_subtitulo <- glue(
"En las <b style='color: {c1}'>Exposiciones Universales</b>, ya sean mundiales como en las",
"específicas, a mayor tamaño del lugar mayor la cantidad de asistentes.",
.sep = " "
)
# figura
g <- ggplot(
d,
aes(area, visitors, shape = category, fill = duracion_dias)
) +
# feria máxima
annotate(
geom = "richtext", x = d_max$area-4, y = d_max$visitors,
label = d_max_label, family = "ubuntu", hjust = 1, vjust = .5,
label.color = NA, fill = c5, label.padding = unit(2, "mm"), size = 4,
label.r = unit(0, "mm")
) +
geom_point(alpha = .7, color = "black", size = 6, stroke = 1) +
scale_x_continuous(limits = c(0, 600), expand = c(.025, 0)) +
scale_y_continuous(limits = c(0, 80), expand = c(.025, 0)) +
scale_fill_gradientn(colors = hcl.colors(n = 5, palette = "Roma")) +
scale_shape_manual(
values = c(21, 23), breaks = names(categorias), labels = categorias
) +
scale_radius(limits = c(30, 600), range = c(1, 10)) +
coord_cartesian(clip = "off") +
labs(
x = eje_x, y = eje_y, shape = NULL, fill = eje_fill, caption = mi_caption,
title = icono, subtitle = mi_subtitulo
) +
guides(
shape = guide_legend(
override.aes = list(stroke = 1, alpha = 1),
theme = theme(
legend.text = element_text(family = "ubuntu"),
legend.key.spacing.y = unit(.6, "cm"),
legend.margin = margin(t = 70, l = 5)
)
),
fill = guide_colorbar(
frame.colour = "black", ticks.colour = "black",
theme = theme(
legend.key.height = unit(7, "cm")
)
)
) +
theme_par() +
theme(
aspect.ratio = 1,
plot.margin = margin(t = 12, b = 12, r = 13.3, l = 13.3),
plot.background = element_rect(color = c1, linewidth = 3),
plot.title = element_markdown(
size = 80, color = c2, hjust = 0, margin = margin(b = -60),
),
plot.subtitle = element_textbox_simple(
family = "ubuntu", size = 18, margin = margin(b = 30, l = 60), color = c3
),
plot.caption = element_markdown(
family = "ubuntu", size = 13, color = c2, margin = margin(t = 30)
),
axis.text = element_text(family = "jet", size = 14, color = c1),
axis.text.x = element_text(hjust = 0),
axis.text.y = element_text(vjust = 0),
axis.title = element_markdown(
family = "ubuntu", size = 18, lineheight = unit(.3, "line"), color = c2
),
panel.grid.major = element_line(
linetype = "FF", linewidth = .1, color = c1
),
legend.title = element_markdown(family = "ubuntu", size = 18, color = c3),
legend.text = element_text(family = "jet", color = c3)
)
# guardo
ggsave(
plot = g,
filename = "2024/s33/viz.png",
width = 30,
height = 28.5,
units = "cm")
# abro
browseURL(glue("{getwd()}/2024/s33/viz.png"))