# paquetes ----------------------------------------------------------------
library(glue)
library(ggtext)
library(showtext)
library(tidyverse)
# fuente ------------------------------------------------------------------
# colores
c1 <- "grey90"
c2 <- "#A82203"
c3 <- "#003967"
c4 <- "#ABA366"
# fuente: Ubuntu
font_add(
family = "ubuntu",
regular = "fuente/Ubuntu-Regular.ttf",
bold = "fuente/Ubuntu-Bold.ttf",
italic = "fuente/Ubuntu-Italic.ttf")
# fuente: Victor
font_add(
family = "victor",
regular = "fuente/VictorMono-ExtraLight.ttf",
bold = "fuente/VictorMono-VariableFont_wght.ttf",
italic = "fuente/VictorMono-ExtraLightItalic.ttf")
# íconos
font_add(
family = "jet",
regular = "fuente/JetBrainsMonoNLNerdFontMono-Regular.ttf")
showtext_auto()
showtext_opts(dpi = 300)
# caption
fuente <- glue(
"Datos: <span style='color:{c3};'><span style='font-family:mono;'>",
"{{<b>tidytuesdayR</b>}}</span> semana {16}. ",
"ShinyConf2024.</span>")
autor <- glue("<span style='color:{c3};'>**Víctor Gauto**</span>")
icon_twitter <- glue("<span style='font-family:jet;'></span>")
icon_instagram <- glue("<span style='font-family:jet;'></span>")
icon_github <- glue("<span style='font-family:jet;'></span>")
icon_mastodon <- glue("<span style='font-family:jet;'>󰫑</span>")
usuario <- glue("<span style='color:{c3};'>**vhgauto**</span>")
sep <- glue("**|**")
mi_caption <- glue(
"{fuente}<br>{autor} {sep} {icon_github} {icon_twitter} {icon_instagram} ",
"{icon_mastodon} {usuario}")
# datos -------------------------------------------------------------------
tuesdata <- tidytuesdayR::tt_load(2024, 16)
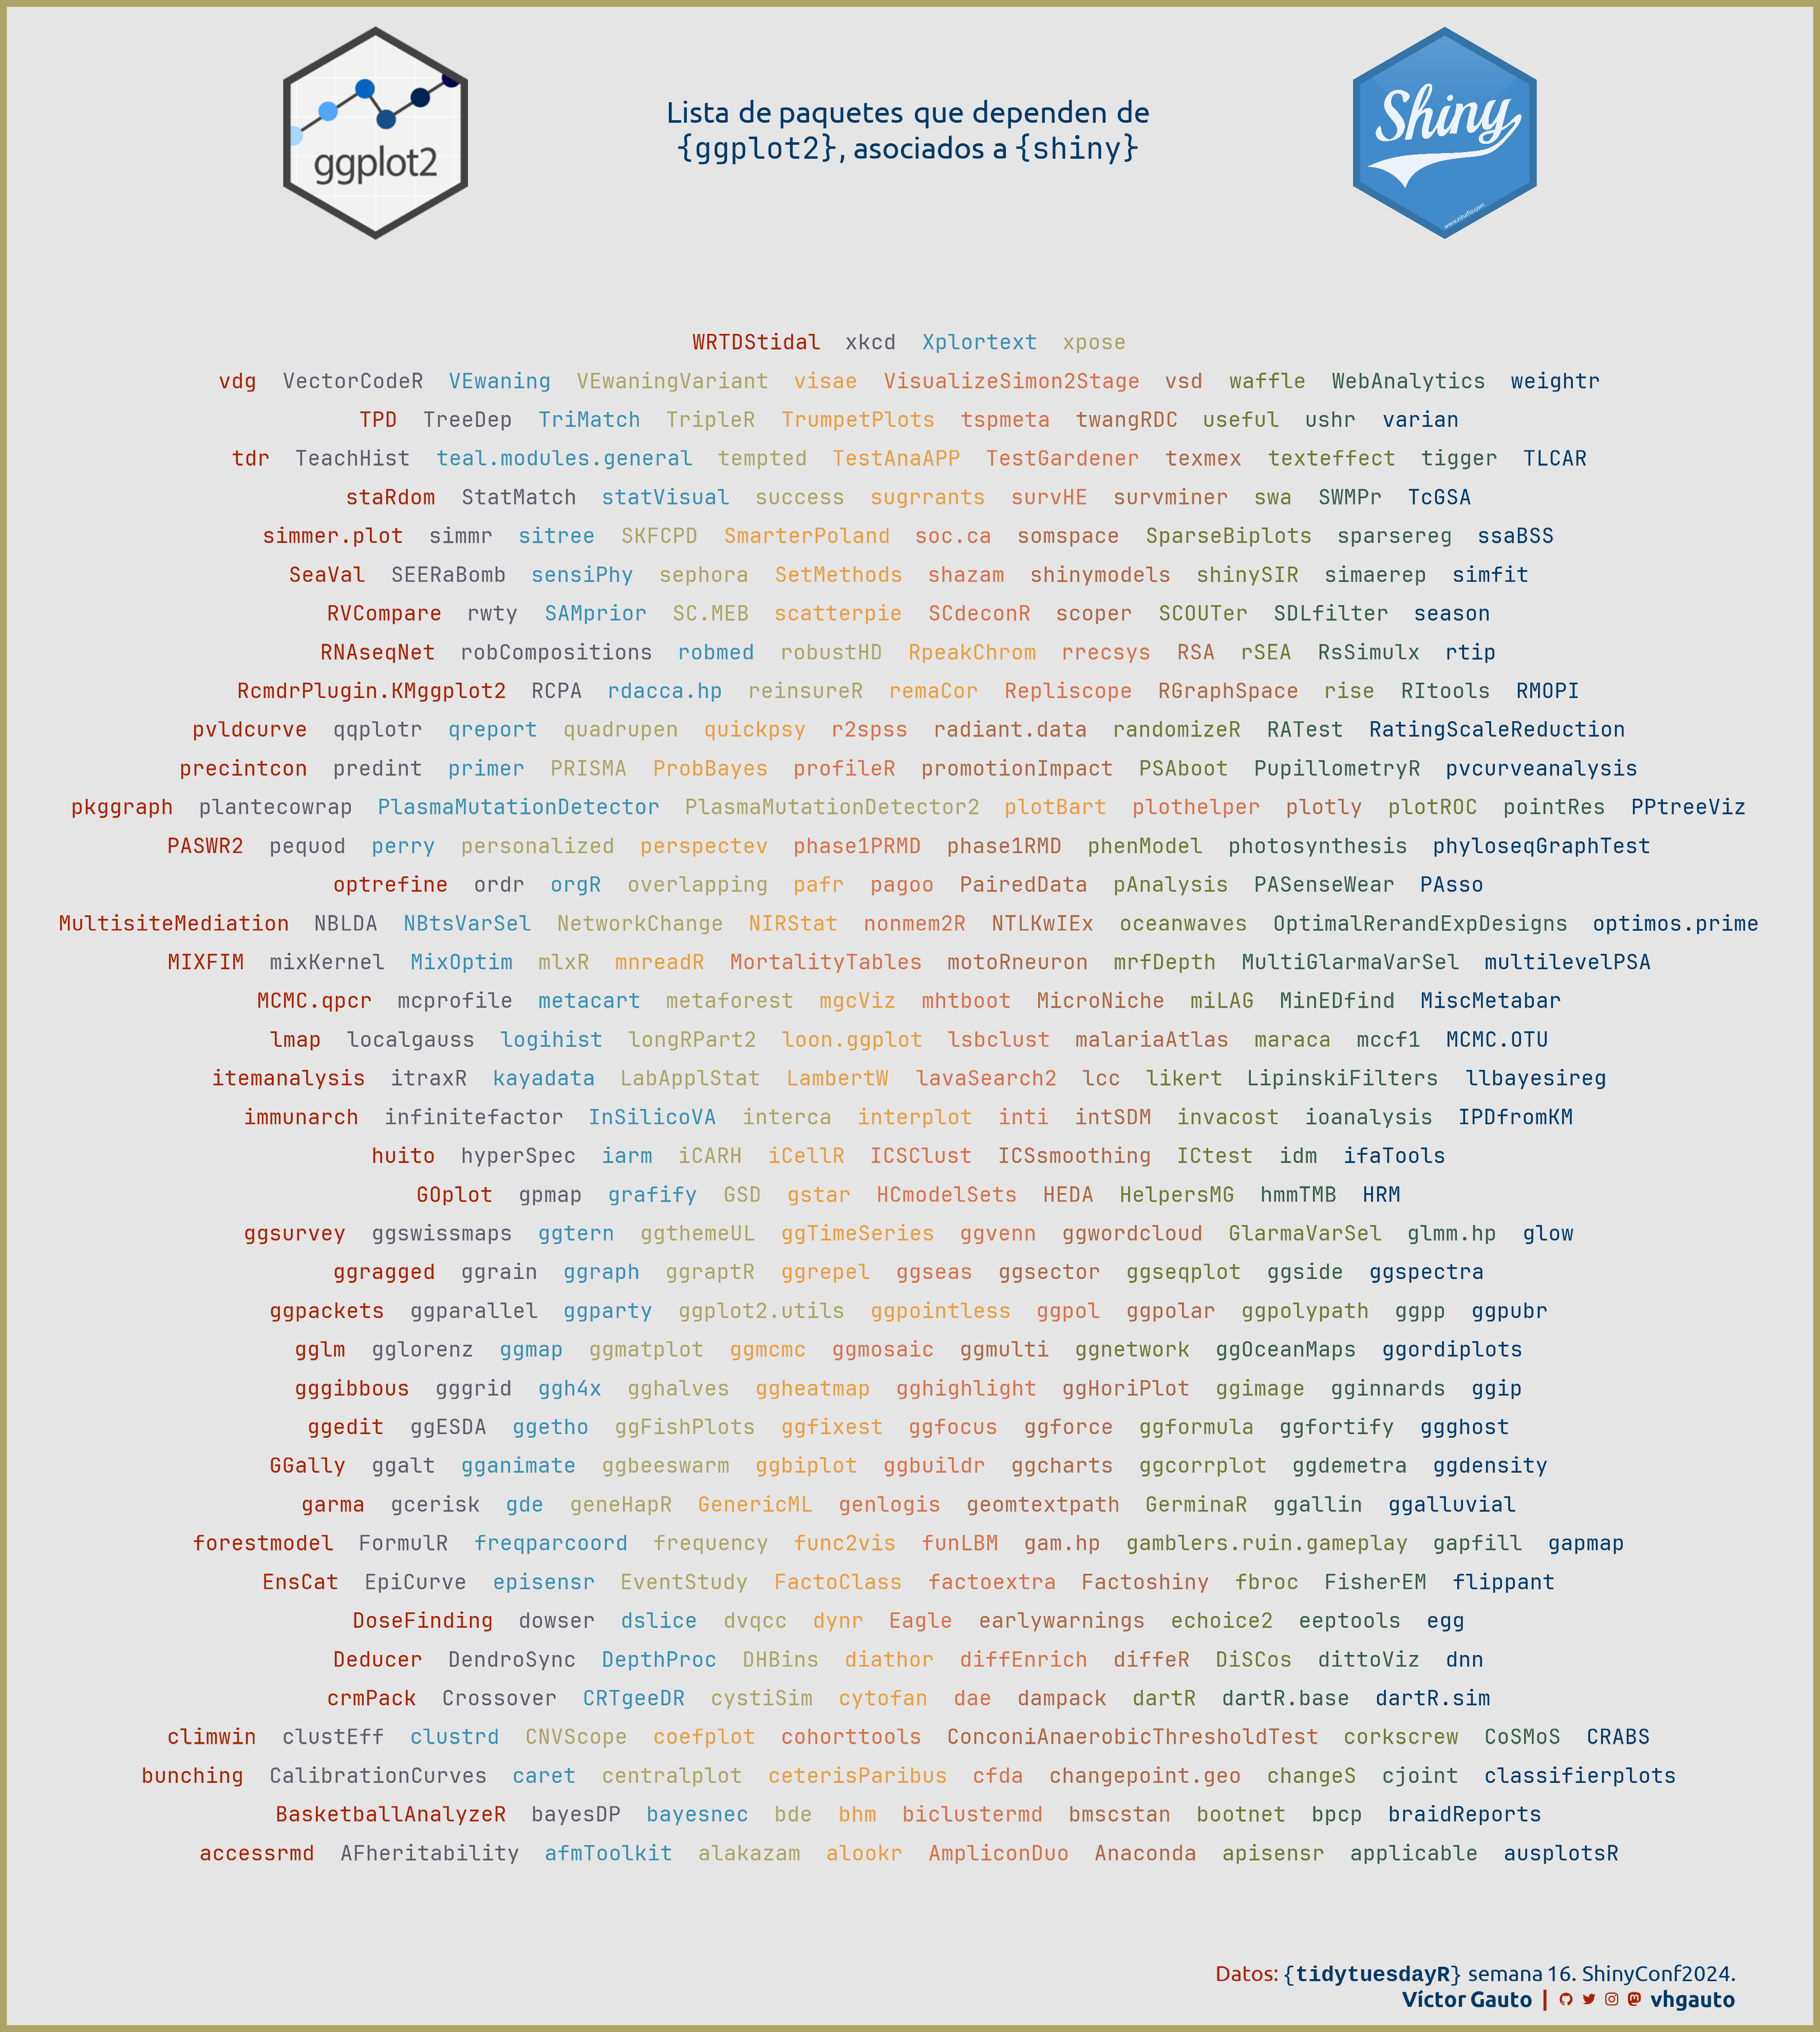
# me interesan los paquetes que dependen de {ggplot2}
package_details <- tuesdata$package_details
# selecciono los paquetes
p <- package_details |>
filter(str_detect(Depends, "ggplot2")) |>
select(Package)
# cantidad de paquetes
nrow(p) # 400
# cantidad de filas y columnas
eje_x <- 10
eje_y <- 400/eje_x
# paleta de colores
paleta <- MetBrewer::met.brewer(name = "Juarez", n = eje_x)
# agrego colores y formo las filas con los nombres de los paquetes
d <- p |>
mutate(x = rep(1:eje_x, length.out = nrow(p))) |>
mutate(y = rep(1:eje_y, each = 400/eje_y, length.out = nrow(p))) |>
mutate(color = rep(paleta, length.out = nrow(p))) |>
mutate(label = glue("<b style='color:{color}'>{Package}</b>")) |>
reframe(
l = str_flatten(label, " "),
.by = y
)
# figura ------------------------------------------------------------------
# logos de {shiny} y {ggplot2}
logo_shiny <- "https://raw.githubusercontent.com/rstudio/shiny/main/man/figures/logo.png"
logo_ggplot2 <- "https://raw.githubusercontent.com/tidyverse/ggplot2/main/man/figures/logo.png"
# título y subtítulo
mi_title <- glue(
"<img src='{logo_ggplot2}' height=100></img>.........................",
"<img src='{logo_shiny}' height=100></img>")
mi_subtitle <- glue(
"Lista de paquetes que dependen de<br>",
"<span style='font-family:jet'>{{ggplot2}</span>, asociados a ",
"<span style='font-family:jet'>{{shiny}}</span>"
)
# figura
g <- ggplot(d, aes(0, y/1.3, label = l)) +
geom_richtext(
family = "jet", size = 3.5, hjust = .5, fill = NA, label.color = NA,
fontface = "bold") +
coord_cartesian(
xlim = c(-2, 2), ylim = c(0, 29), expand = TRUE, clip = "off") +
labs(title = mi_title, subtitle = mi_subtitle, caption = mi_caption) +
theme_void() +
theme(
aspect.ratio = 1,
plot.margin = margin(l = 50, r = 50, t = 2.4),
plot.background = element_rect(fill = c1, color = c4, linewidth = 3),
plot.title = element_markdown(
hjust = .5, size = 50, color = c1, margin = margin(t = 10)),
plot.subtitle = element_markdown(
family = "ubuntu", color = c3, size = 14, hjust = .5,
margin = margin(t = -75), lineheight = unit(1.2, "line")),
plot.caption = element_markdown(
color = c2, family = "ubuntu", size = 10, lineheight = unit(1.2, "line"),
margin = margin(r = -10, b = 10))
)
# guardo
ggsave(
plot = g,
filename = "2024/s16/viz.png",
width = 30,
height = 33.5,
units = "cm"
)
# abro
browseURL("2024/s16/viz.png")