# paquetes ----------------------------------------------------------------
library(glue)
library(ggtext)
library(showtext)
library(tidyverse)
# fuente ------------------------------------------------------------------
# colores
c1 <- "#4FB6CA"
c2 <- "#178F92"
c3 <- "#175F5D"
c4 <- "#054544"
c5 <- "#4E3810"
c6 <- "grey30"
c7 <- "#EDE2CC"
arcoiris <- c("#E40303", "#FF8C00", "#FFED00", "#008026", "#24408E", "#732982")
# fuente: Ubuntu
font_add(
family = "ubuntu",
regular = "fuente/Ubuntu-Regular.ttf",
bold = "fuente/Ubuntu-Bold.ttf",
italic = "fuente/Ubuntu-Italic.ttf")
# monoespacio & íconos
font_add(
family = "jet",
regular = "fuente/JetBrainsMonoNLNerdFontMono-Regular.ttf")
# bebas neue
font_add(
family = "bebas",
regular = "fuente/BebasNeue-Regular.ttf"
)
showtext_auto()
showtext_opts(dpi = 300)
# caption
fuente <- glue(
"Datos: <span style='color:{c3};'><span style='font-family:jet;'>",
"{{<b>tidytuesdayR</b>}}</span> semana {24}, ",
"Campus Pride Index.</span>")
autor <- glue("<span style='color:{c3};'>**Víctor Gauto**</span>")
icon_twitter <- glue("<span style='font-family:jet;'></span>")
icon_instagram <- glue("<span style='font-family:jet;'></span>")
icon_github <- glue("<span style='font-family:jet;'></span>")
icon_mastodon <- glue("<span style='font-family:jet;'>󰫑</span>")
usuario <- glue("<span style='color:{c3};'>**vhgauto**</span>")
sep <- glue("**|**")
mi_caption <- glue(
"{fuente}<br>{autor} {sep} {icon_github} {icon_twitter} {icon_instagram} ",
"{icon_mastodon} {usuario}")
# datos -------------------------------------------------------------------
tuesdata <- tidytuesdayR::tt_load(2024, 24)
pride_index <- tuesdata$pride_index
pride_index_tags <- tuesdata$pride_index_tags
# me interesa analizar el índice agrupado por estado, y la cantidad de
# estudiantes
d <- inner_join(
pride_index_tags,
pride_index,
by = join_by(campus_name, campus_location)
) |>
mutate(
estado = str_sub(campus_location, start = -2, end = -1), .before = 2
) |>
select(rating, estado, students) |>
reframe(
r = median(rating),
s = sum(students),
.by = estado
) |>
mutate(estado = fct_reorder(estado, r)) |>
arrange(estado) |>
mutate(
label_x = if_else(
row_number() %% 2 == 0,
r - .17,
r + .17
)
)
# figura ------------------------------------------------------------------
# estrellas en el eje horizontal
estrella <- glue(
"<span style='font-family:jet;'></span>")
eje_x <- seq(1, 5, 1)
eje_x_nombres <- c(
estrella,
glue("{str_flatten(rep(estrella, 2))}"),
glue("{str_flatten(rep(estrella, 3))}"),
glue("{str_flatten(rep(estrella, 4))}"),
glue("{str_flatten(rep(estrella, 5))}")
)
names(eje_x) <- eje_x_nombres
# subtítulo
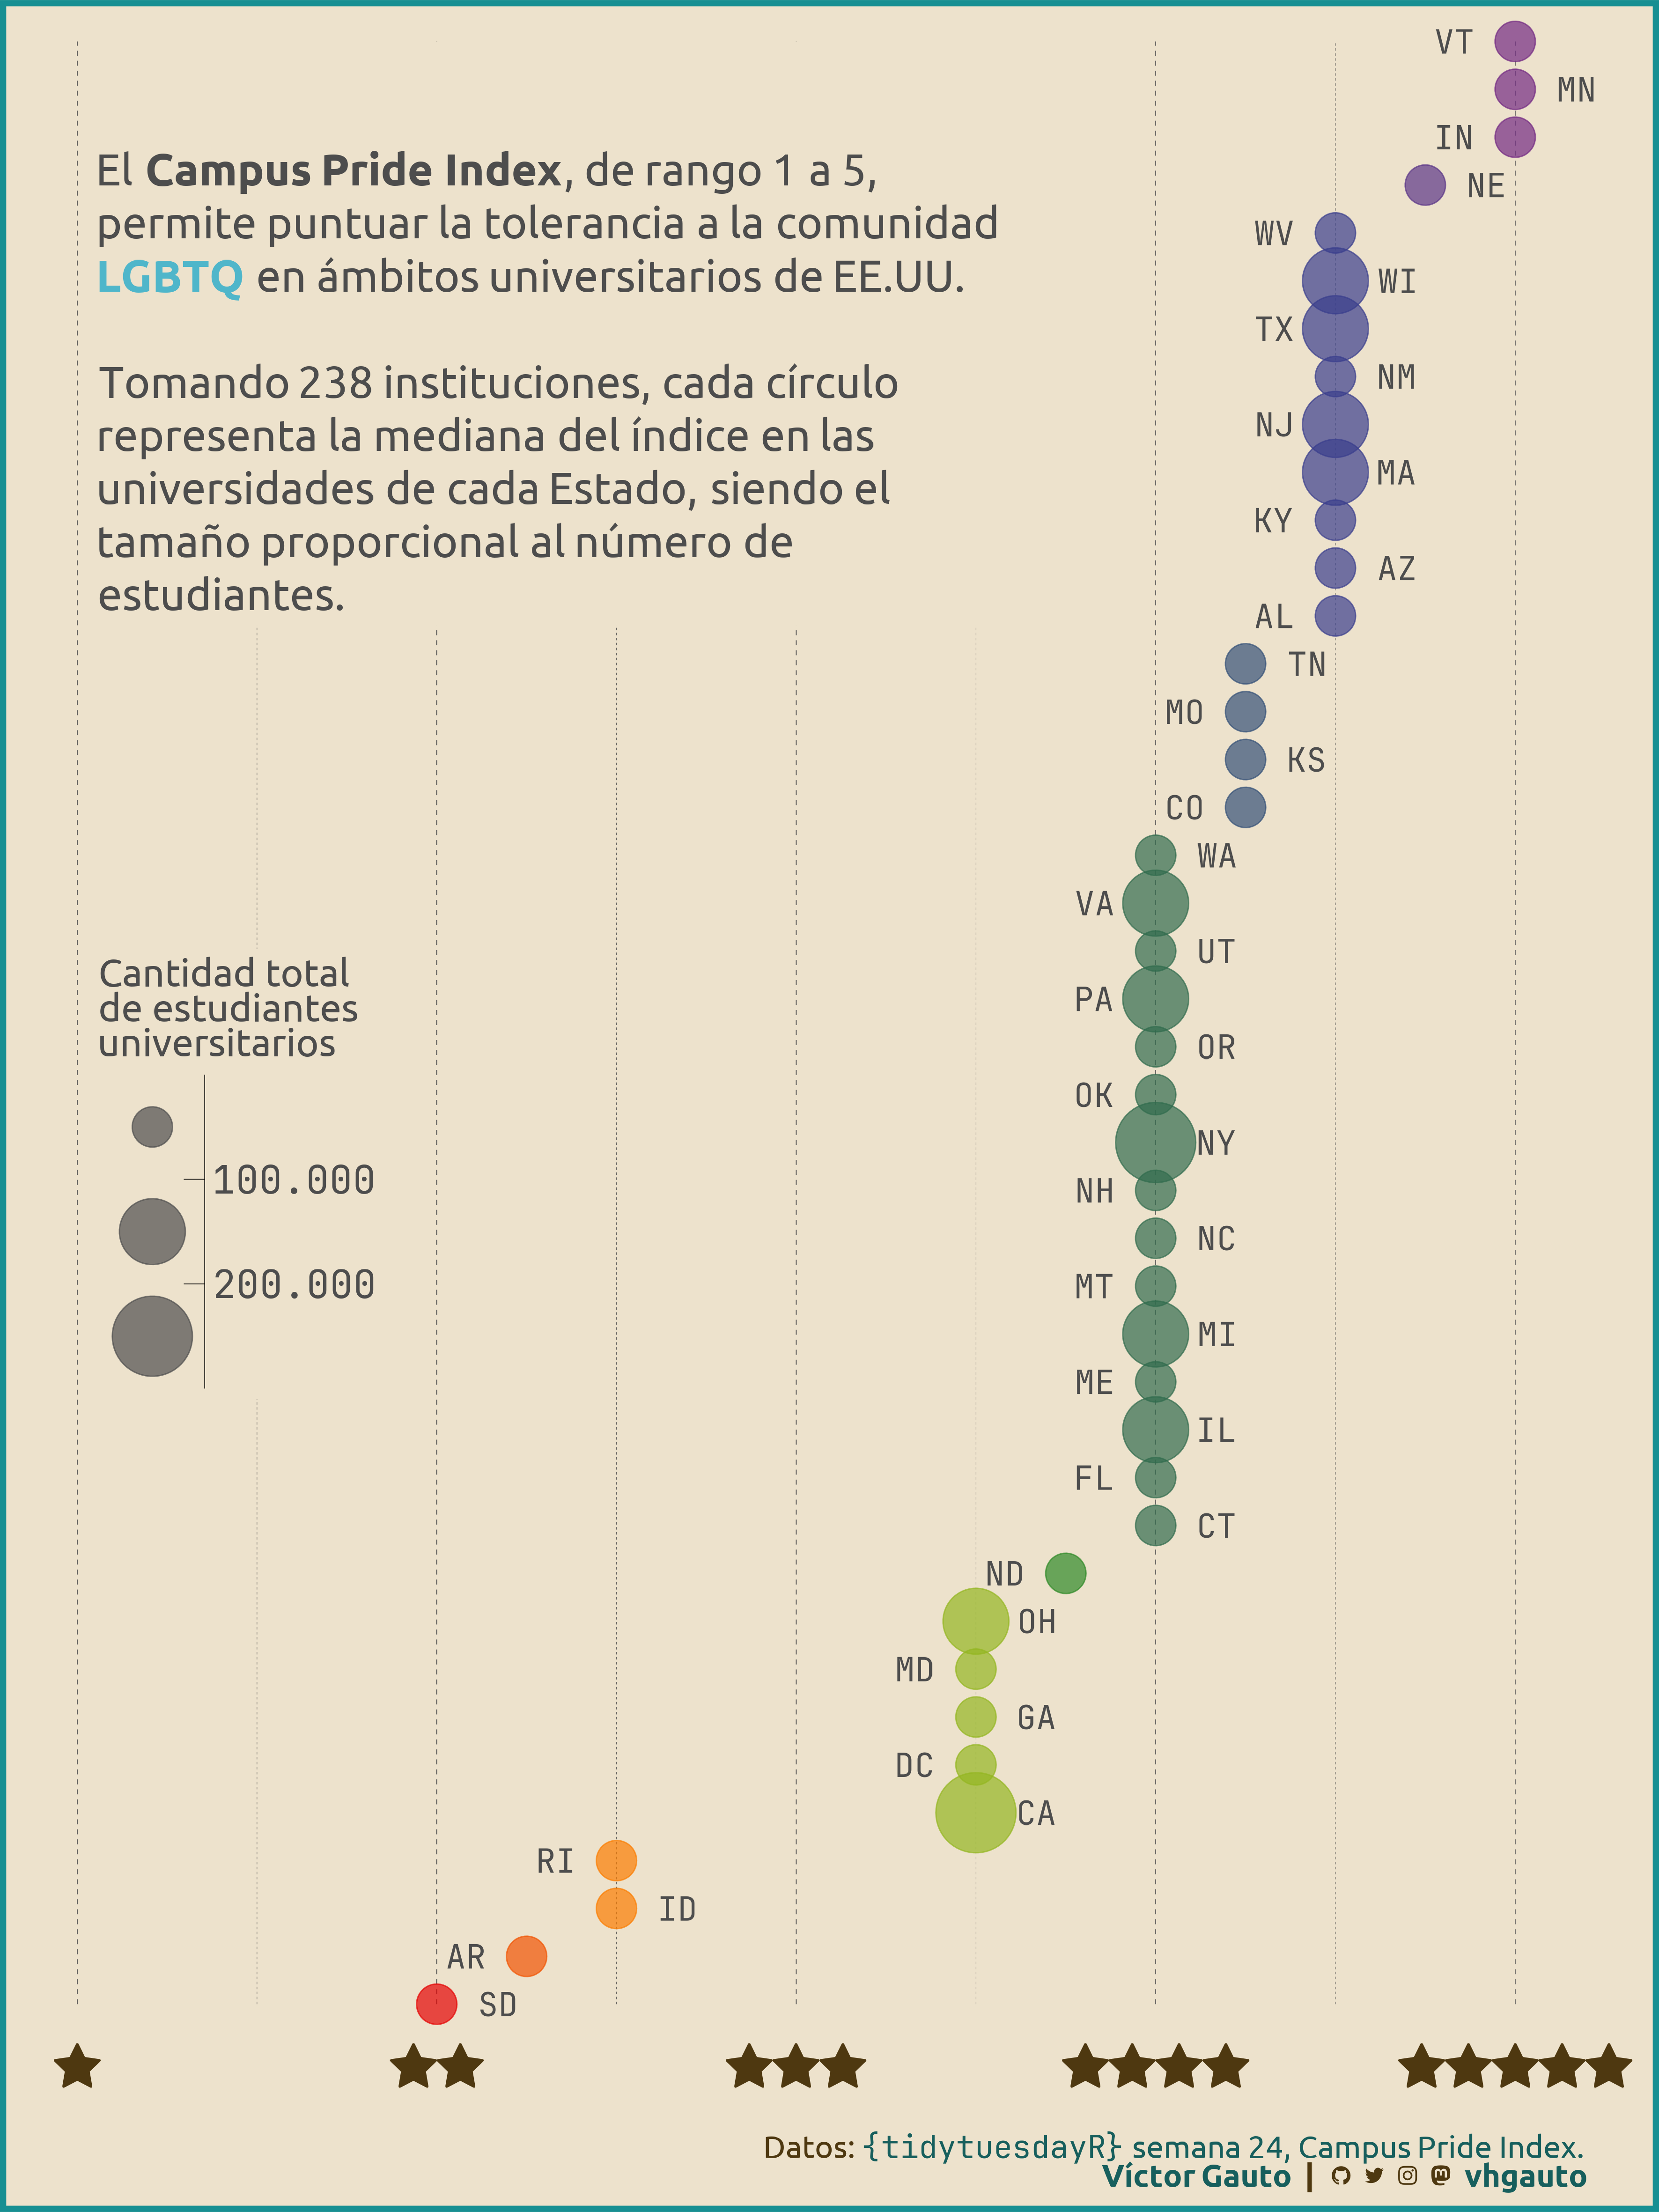
mi_subtitulo <- glue(
"<br><br>El <b>Campus Pride Index</b>, de rango 1 a 5,<br>",
"permite puntuar la tolerancia a la comunidad<br>",
"<b style='color:{c1}'>LGBTQ</b> en ámbitos universitarios de EE.UU.<br><br>",
"Tomando {nrow(pride_index)} instituciones, cada círculo<br>",
"representa la mediana del índice en las<br>",
"universidades de cada Estado, siendo el<br>",
"tamaño proporcional al número de<br>",
"estudiantes."
)
# figura
g <- ggplot(d, aes(r, estado)) +
geom_point(alpha = .7, aes(size = s, color = r)) +
geom_text(
aes(label = estado, x = label_x), family = "jet", color = c6,
fontface = "bold", size = 6, show.legend = FALSE) +
annotate(
geom = "richtext", x = I(.01), y = I(nrow(d)), hjust = 0, vjust = 1,
family = "ubuntu", label = mi_subtitulo, size = 8, color = c6, fill = c7,
label.color = NA
) +
scale_x_continuous(
breaks = eje_x,
limits = c(1, 5.2),
labels = names(eje_x)
) +
scale_color_gradientn(colors = arcoiris) +
scale_size_binned(
breaks = c(1e5, 2e5),
labels = c("100.000", "200.000"),
range = c(1, 20)
) +
coord_cartesian(clip = "off", expand = FALSE) +
labs(
x = NULL, y = NULL, caption = mi_caption,
size = "Cantidad total<br>de estudiantes<br>universitarios"
) +
guides(
color = guide_none(),
size = guide_bins(
override.aes = list(fill = NA, color = c6),
position = "inside")
) +
theme_minimal() +
theme(
aspect.ratio = 1.3,
plot.margin = margin(t = 21.3, b = 10, l = 37, r = 37),
plot.background = element_rect(fill = c7, color = c2, linewidth = 3),
plot.caption = element_markdown(
color = c5, family = "ubuntu", size = 16, margin = margin(t = 13)),
panel.grid.major.y = element_blank(),
panel.grid.minor.y = element_blank(),
panel.grid.major.x = element_line(
linewidth = .2, linetype = "66", color = c6),
panel.grid.minor.x = element_line(
linewidth = .1, linetype = "66", color = c6),
axis.text.x = element_markdown(
size = 40, color = c5, margin = margin(t = 14)),
axis.text.y = element_blank(),
legend.justification.inside = c(.01, .4),
legend.text = element_text(family = "jet", size = 20, color = c6),
legend.background = element_rect(fill = c7, color = NA),
legend.title = element_markdown(family = "ubuntu", size = 20, color = c6)
)
# guardo
ggsave(
plot = g,
filename = "2024/s24/viz.png",
width = 30,
height = 40,
units = "cm")
# abro
browseURL("2024/s24/viz.png")