# paquetes ----------------------------------------------------------------
library(glue)
library(ggtext)
library(showtext)
library(tidyverse)
# fuente ------------------------------------------------------------------
# colores
c1 <- "#AB740F"
c2 <- "#3E7671"
c3 <- "#122C43"
c4 <- "black"
c5 <- "white"
c6 <- "grey95"
# fuente: Ubuntu
font_add(
family = "ubuntu",
regular = "fuente/Ubuntu-Regular.ttf",
bold = "fuente/Ubuntu-Bold.ttf",
italic = "fuente/Ubuntu-Italic.ttf")
# monoespacio & íconos
font_add(
family = "jet",
regular = "fuente/JetBrainsMonoNLNerdFontMono-Regular.ttf")
showtext_auto()
showtext_opts(dpi = 300)
# caption
fuente <- glue(
"Datos: <span style='color:{c3};'><span style='font-family:mono;'>",
"{{<b>tidytuesdayR</b>}}</span> semana {19}, ",
"<b>The Pudding</b>, Rolling Stone</span>")
autor <- glue("<span style='color:{c3};'>**Víctor Gauto**</span>")
icon_twitter <- glue("<span style='font-family:jet;'></span>")
icon_instagram <- glue("<span style='font-family:jet;'></span>")
icon_github <- glue("<span style='font-family:jet;'></span>")
icon_mastodon <- glue("<span style='font-family:jet;'>󰫑</span>")
usuario <- glue("<span style='color:{c3};'>**vhgauto**</span>")
sep <- glue("**|**")
mi_caption <- glue(
"{fuente}<br>{autor} {sep} {icon_github} {icon_twitter} {icon_instagram} ",
"{icon_mastodon} {usuario}")
# datos -------------------------------------------------------------------
tuesdata <- tidytuesdayR::tt_load(2024, 19)
rolling_stone <- tuesdata$rolling_stone
# me interesa la cantidad de semanas en Bilboard de todos los álbums de música
d <- rolling_stone |>
select(clean_name, weeks_on_billboard, artist_gender, genre) |>
drop_na() |>
separate_longer_delim(cols = genre, delim = "/") |>
mutate(genre = toupper(genre)) |>
mutate(genre = case_when(
str_detect(genre, "ROCK") ~ "ROCK",
str_detect(genre, "PUNK") ~ "PUNK",
str_detect(genre, "RHYTHM & BLUES") ~ "R&B",
.default = genre
)) |>
mutate(genre = fct_reorder(genre, weeks_on_billboard)) |>
arrange(genre) |>
mutate(id = as.numeric(genre))
# paleta de colores
paleta <- MetBrewer::met.brewer(name = "Veronese", n = length(unique(d$genre)))
# agrego paleta de colores al eje vertical
e <- d |>
mutate(color = paleta[id]) |>
mutate(genre = str_replace(genre, "-", "<br>")) |>
mutate(label_y = glue("<b style='color:{color}'>{genre}</b>")) |>
mutate(label_y = fct_reorder(label_y, weeks_on_billboard))
# obtengo medianas
e_s <- e |>
reframe(
s = median(weeks_on_billboard),
.by = c(label_y, color))
# figura ------------------------------------------------------------------
# tibble para las barras horizontales
e_col <- tibble(
x = 1000,
label_y = unique(e$label_y),
color = unique(e$color)
)
# logo de Rolling Stones
logo <- "<img src='2024/s19/logo.png' width=250></img>"
# subtítulo
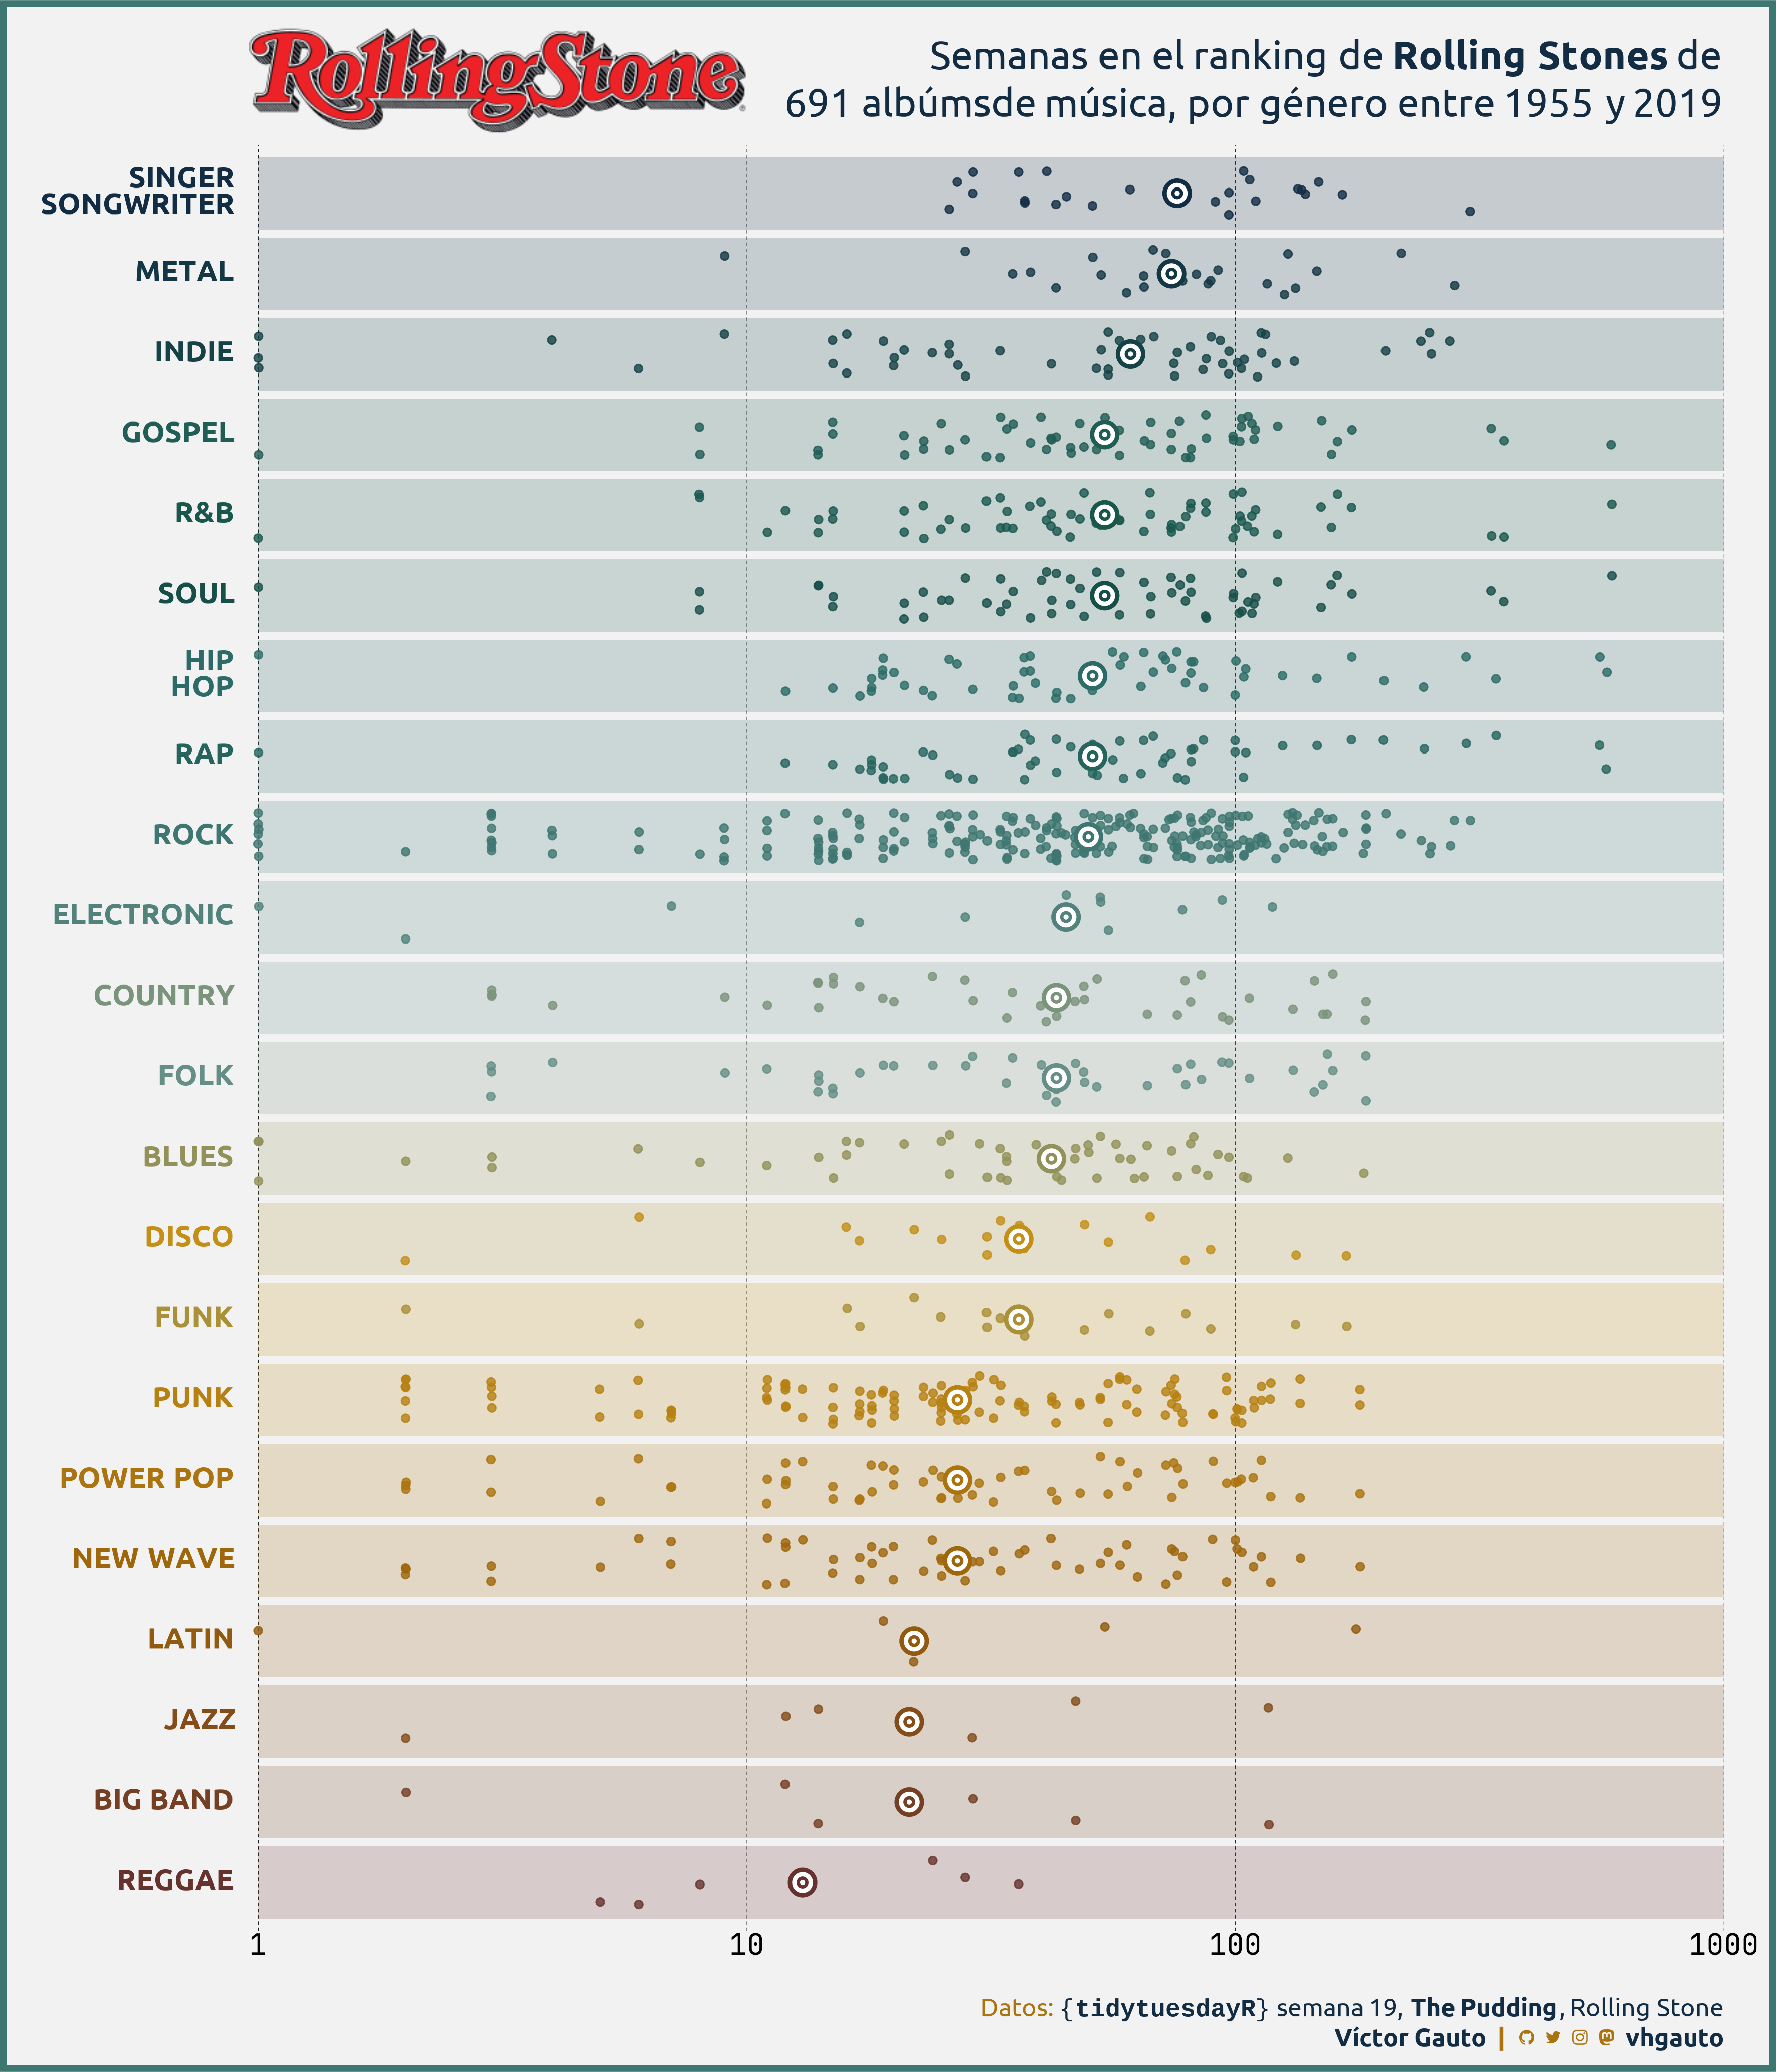
mi_subtitle <- glue(
"Semanas en el ranking de <b>Rolling Stones</b> de<br>",
"{nrow(rolling_stone)} albúms",
"de música, por género entre {min(rolling_stone$release_year)} y ",
"{max(rolling_stone$release_year)}")
# figura
g <- ggplot(e, aes(weeks_on_billboard, label_y, color = color)) +
# barras horizontales
geom_col(
data = e_col, aes(x, label_y, fill = label_y), alpha = .2, color = NA) +
geom_point(position = position_jitter(height = .3, seed = 2024), alpha = .8) +
# medianas
geom_point(data = e_s, aes(s, label_y, color = color), size = 6) +
geom_point(data = e_s, aes(s, label_y), color = c5, size = 4) +
geom_point(
data = e_s, aes(s, label_y, color = color), size = 2) +
geom_point(data = e_s, aes(s, label_y), color = c5, size = .5) +
scale_x_log10(breaks = c(1, 10, 100, 1000), expand = c(0, 0)) +
scale_color_identity() +
scale_fill_manual(values = paleta) +
coord_cartesian(xlim = c(.9, NA)) +
labs(
y = NULL, x = "Semanas en Billboard", title = logo, subtitle = mi_subtitle,
caption = mi_caption) +
theme_void() +
theme(
aspect.ratio = 1.2,
plot.background = element_rect(fill = c6, color = c2, linewidth = 3),
plot.margin = margin(l = 20, r = 25, t = 7.3),
plot.title = element_markdown(margin = margin(b = -50)),
plot.subtitle = element_markdown(
family = "ubuntu", size = 19, hjust = 1, margin = margin(b = 10),
lineheight = unit(1.2, "line"), color = c3),
plot.caption = element_markdown(
family = "ubuntu", size = 12, color = c1, margin = margin(t = 20, b = 10),
lineheight = unit(1.2, "line")),
panel.grid.major.x = element_line(
color = c4, linetype = "77", linewidth = .1),
axis.text.x = element_text(family = "jet", size = 14),
axis.text.y = element_markdown(family = "ubuntu", size = 14, hjust = 1),
legend.position = "none"
)
# guardo
ggsave(
plot = g,
filename = "2024/s19/viz.png",
width = 30,
height = 35,
units = "cm")
# abro
browseURL("2024/s19/viz.png")