Ocultar código
library(glue)
library(ggtext)
library(showtext)
library(tidyverse)Distribución de la duración de películas en Netflix.
library(glue)
library(ggtext)
library(showtext)
library(tidyverse)Colores.
c1 <- "#D81F26"
c2 <- "black"
c3 <- "white"
c4 <- "grey30"
Fuentes: Ubuntu y JetBrains Mono.
font_add(
  family = "ubuntu",
  regular = "././fuente/Ubuntu-Regular.ttf",
  bold = "././fuente/Ubuntu-Bold.ttf",
  italic = "././fuente/Ubuntu-Italic.ttf"
)

font_add(
  family = "jet",
  regular = "././fuente/JetBrainsMonoNLNerdFontMono-Regular.ttf"
)

showtext_auto()
showtext_opts(dpi = 300)fuente <- glue(
"Datos: <span style='color:{c3};'><span style='font-family:jet;'>",
"{{<b>tidytuesdayR</b>}}</span> semana 30, ",
"<b><span style='color: {c1}'>NETFLIX</b>
Engagement Reports</b>.</span>"
)
autor <- glue("<span style='color:{c3};'>**Víctor Gauto**</span>")
icon_twitter <- glue("<span style='font-family:jet;'></span>")
icon_instagram <- glue("<span style='font-family:jet;'></span>")
icon_github <- glue("<span style='font-family:jet;'></span>")
icon_mastodon <- glue("<span style='font-family:jet;'>󰫑</span>")
icon_bsky <- glue("<span style='font-family:jet;'></span>")
usuario <- glue("<span style='color:{c3};'>**vhgauto**</span>")
sep <- glue("**|**")
mi_caption <- glue(
"{fuente}<br>{autor} {sep} {icon_github} {icon_twitter} {icon_instagram} ",
"{icon_mastodon} {icon_bsky} {usuario}"
)tuesdata <- tidytuesdayR::tt_load(2025, 30)
movies <- tuesdata$movies
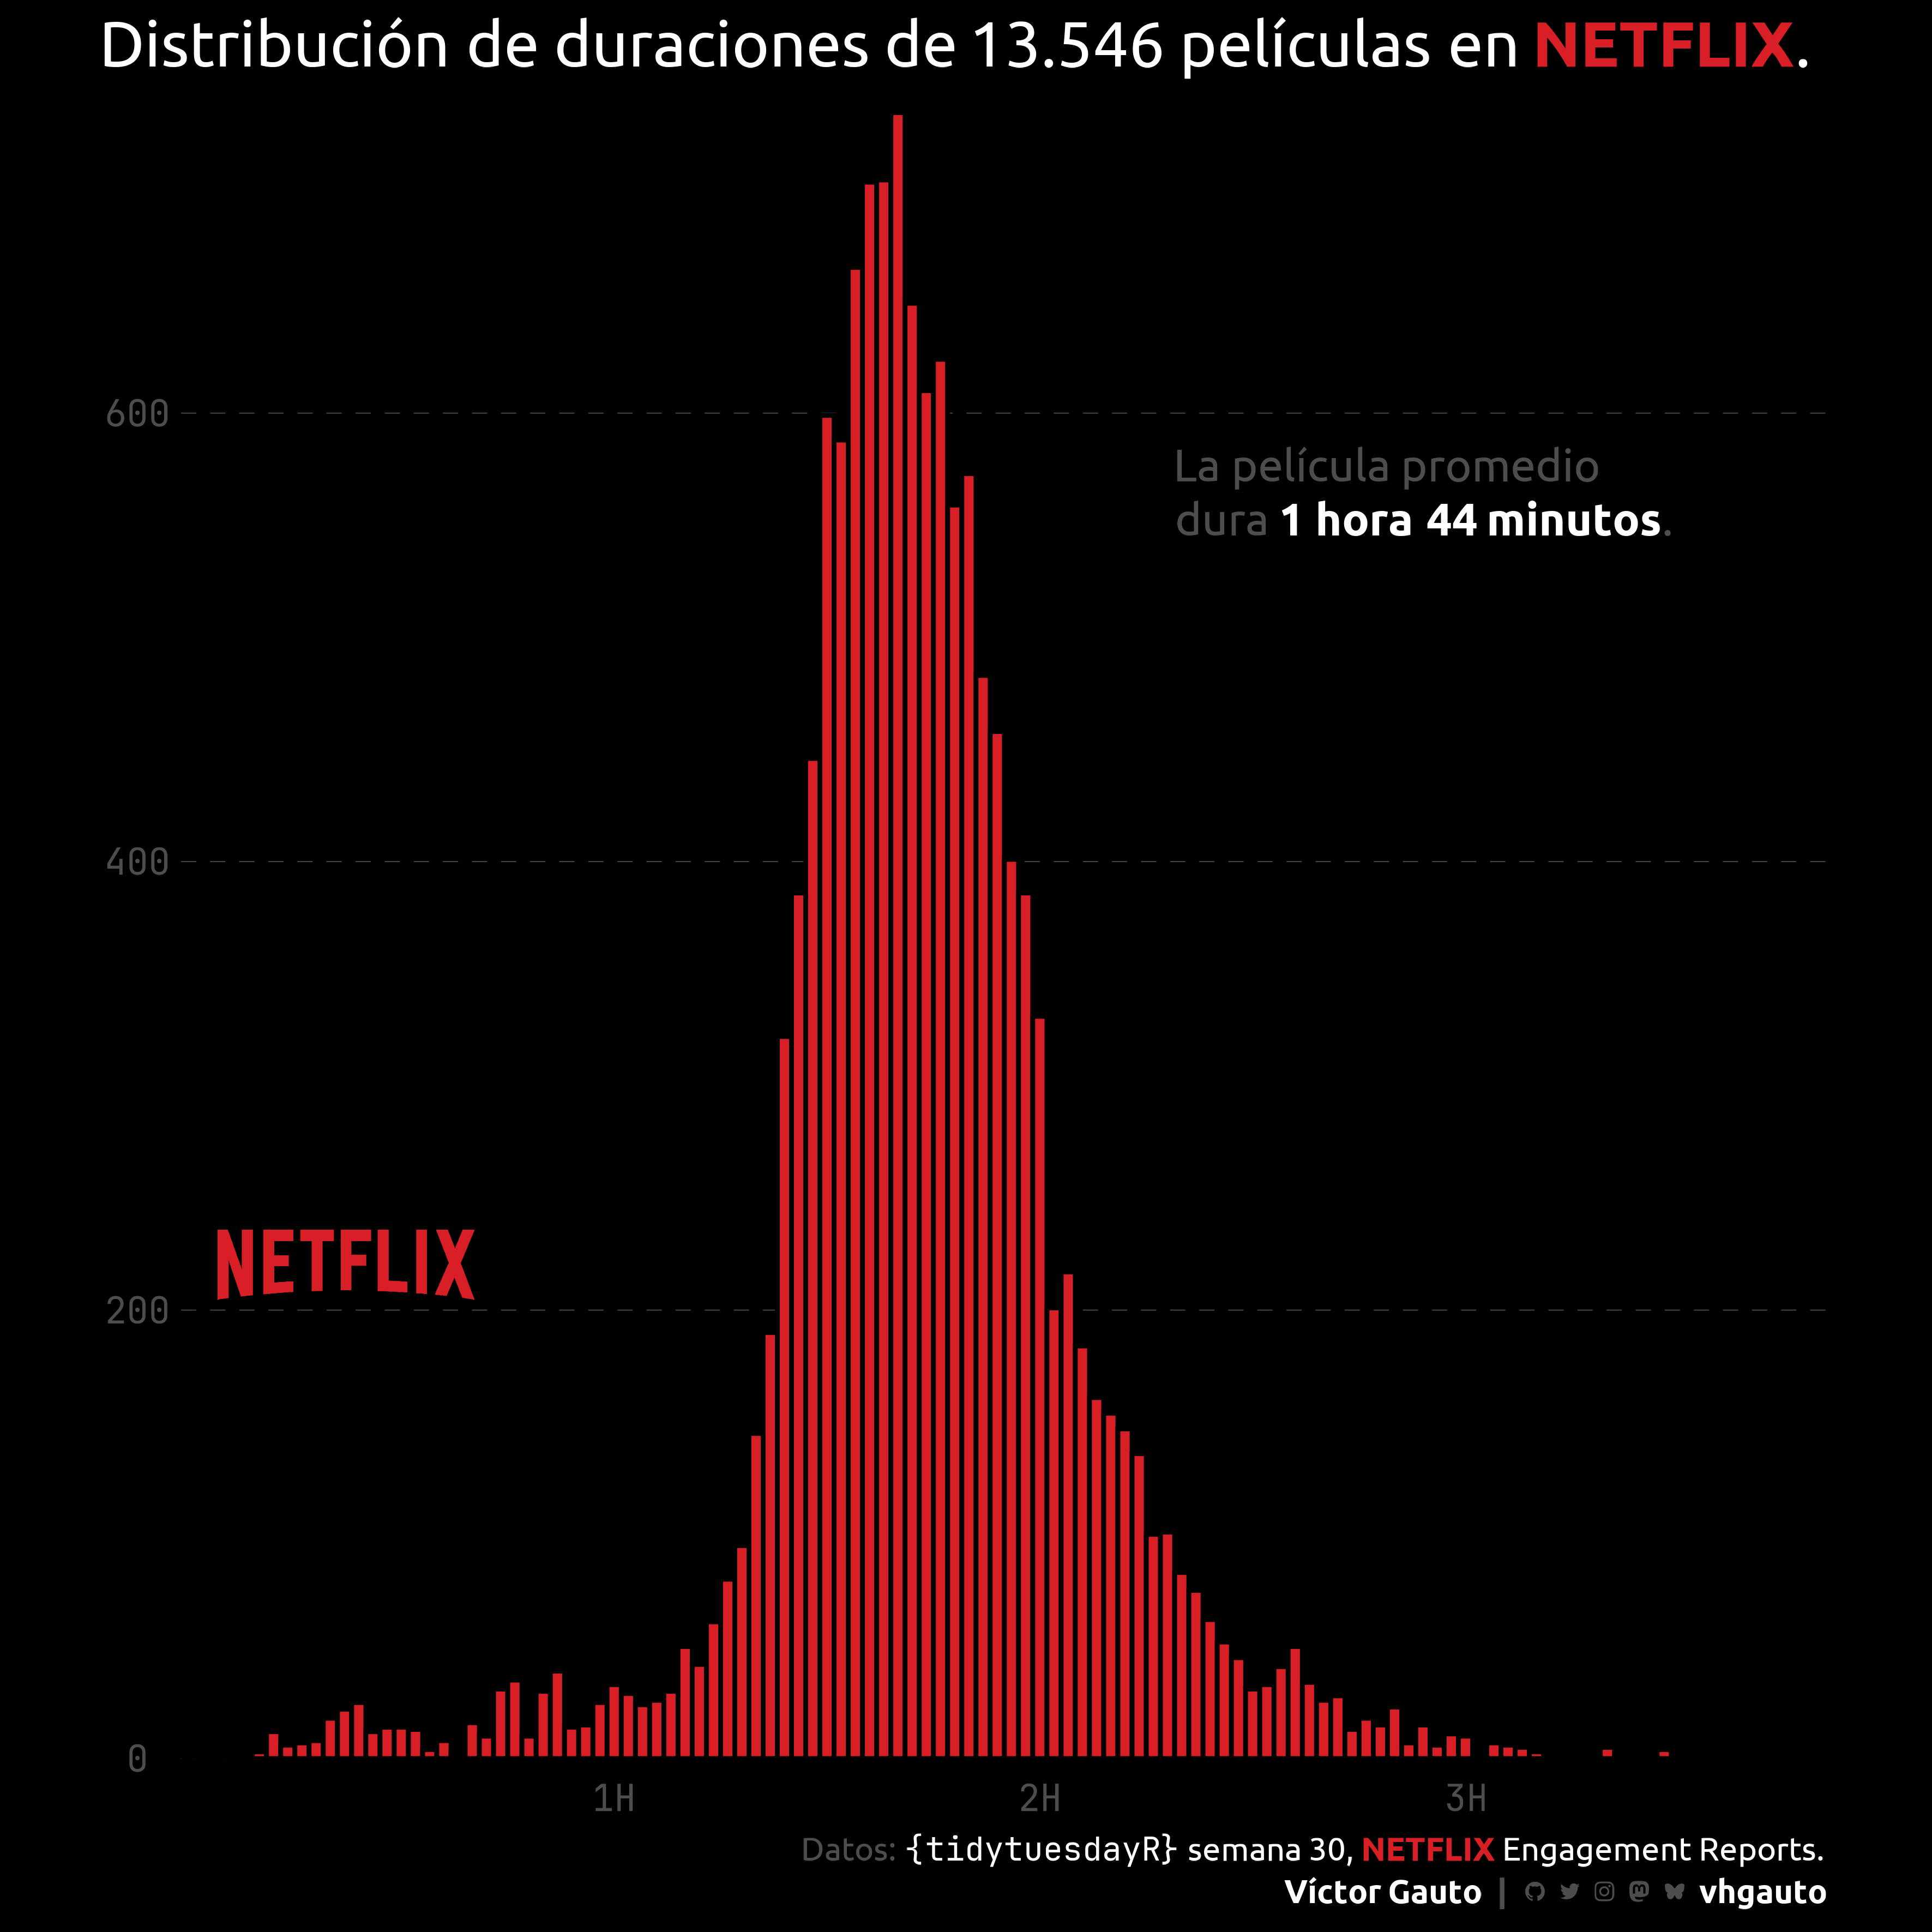
shows <- tuesdata$showsMe interesa la duración de las películas. Conservo únicamente aquellas que duran menos de 4 horas para generar un histograma.
d <- movies |>
  mutate(dur = duration(runtime)) |>
  select(title, dur) |>
  distinct() |>
  drop_na() |>
  filter(dur < 3600*4)
Duración promedio de las películas.
hora <- floor(mean(d$dur)/3600)
minuto <- floor((mean(d$dur) - hora*3600)/60)Logo, título y subtítulo.
logo_link <- "https://upload.wikimedia.org/wikipedia/commons/0/08/Netflix_2015_logo.svg"
logo_txt <- paste(readLines(logo_link), collapse = "\n")

mi_titulo <- glue(
  "Distribución de duraciones de
  {format(nrow(d), big.mark = '.', decimal.mark = ',')} películas
  en <b style='color: {c1}'>NETFLIX</b>."
)

mi_subtitulo <- glue(
  "La película promedio <br>dura <b style='color: {c3}'>{hora}
  hora {minuto} minutos</b>."
)
Figura.
g <- ggplot(d, aes(dur)) +
  geom_histogram(
    binwidth = 2*60, color = c2, fill = c1, linewidth = 1
  ) +
  ggsvg::geom_point_svg(
    x = I(.1), y = I(.3), svg = logo_txt, size = 40
  ) +
  scale_x_continuous(
    breaks = 1:3*3600,
    labels = paste0(1:3, "H")
  ) +
  annotate(
    geom = "richtext",
    x = I(.6),
    y = I(.8),
    label = mi_subtitulo,
    color = c4,
    family = "ubuntu",
    label.color = NA,
    size = 7,
    fill = NA,
    hjust = 0,
    vjust = 1
  ) +
  coord_cartesian(expand = FALSE, clip = "off") +
  labs(
    title = mi_titulo,
    caption = mi_caption
  ) +
  theme_void(base_family = "ubuntu", base_size = 16) +
  theme(
    aspect.ratio = 1,
    plot.margin = margin(t = 10, b = 10),
    plot.background = element_rect(fill = c2),
    plot.title.position = "plot",
    plot.title = element_textbox_simple(
      color = c3, size = rel(1.75), margin = margin(b = 15)
    ),
    plot.caption = element_markdown(
      color = c4, lineheight = 1.3, margin = margin(t = 10),
      size = rel(.9)
    ),
    panel.background = element_blank(),
    panel.grid.major.y = element_line(
      color = c4, linewidth = .2, linetype = "FF"
    ),
    axis.text = element_text(
      color = c4, family = "jet", margin = margin(t = 10)
    ),
    axis.text.y = element_text(margin = margin(r = 5))
  )
Guardo.
ggsave(
  plot = g,
  filename = "tidytuesday/2025/semana_30.png",
  width = 30,
  height = 30,
  units = "cm"
)