# paquetes ----------------------------------------------------------------
library(glue)
library(ggtext)
library(showtext)
library(ggarchery)
library(ggsvg)
library(tidyverse)
# fuente ------------------------------------------------------------------
# colores
c1 <- "#399483"
c2 <- "#B54EA3"
c3 <- "#F2FBFC"
c4 <- "black"
c5 <- "#00186D"
c6 <- "#06C7FF"
# fuente: Ubuntu
font_add(
family = "ubuntu",
regular = "fuente/Ubuntu-Regular.ttf",
bold = "fuente/Ubuntu-Bold.ttf",
italic = "fuente/Ubuntu-Italic.ttf")
# monoespacio & íconos
font_add(
family = "jet",
regular = "fuente/JetBrainsMonoNLNerdFontMono-Regular.ttf")
# bebas neue
font_add(
family = "bebas",
regular = "fuente/BebasNeue-Regular.ttf"
)
showtext_auto()
showtext_opts(dpi = 300)
# caption
fuente <- glue(
"Datos: <span style='color:{c2};'><span style='font-family:jet;'>",
"{{<b>tidytuesdayR</b>}}</span> semana {30}, ",
"artículo <b>American Idol</b> en Wikipedia.</span>")
autor <- glue("<span style='color:{c2};'>**Víctor Gauto**</span>")
icon_twitter <- glue("<span style='font-family:jet;'></span>")
icon_instagram <- glue("<span style='font-family:jet;'></span>")
icon_github <- glue("<span style='font-family:jet;'></span>")
icon_mastodon <- glue("<span style='font-family:jet;'>󰫑</span>")
usuario <- glue("<span style='color:{c2};'>**vhgauto**</span>")
sep <- glue("**|**")
mi_caption <- glue(
"{fuente}<br>{autor} {sep} {icon_github} {icon_twitter} {icon_instagram} ",
"{icon_mastodon} {usuario}")
# datos -------------------------------------------------------------------
tuesdata <- tidytuesdayR::tt_load(2024, 30)
ratings <- tuesdata$ratings
# me interesa la audiencia en todas las temporadas, y si aumenta/baja la
# audiencia con los episodios
d <- ratings |>
select(season, show_number, airdate, viewers_in_millions) |>
mutate(fecha_X = mdy(airdate)) |>
mutate(airdate = if_else(
is.na(fecha_X),
glue("{airdate}, 2014"),
airdate
)) |>
mutate(fecha = mdy(airdate)) |>
select(-fecha_X) |>
drop_na(viewers_in_millions) |>
mutate(año = year(fecha))
# el aumento/baja de la audiencia con los episodios lo defino con la pendiente
# positiva/negativa de un modelos lineal: audiencia = f(episodios)
d_mod <- d |>
mutate(año = year(fecha)) |>
nest(.by = año) |>
mutate(mod = map(.x = data, ~lm(viewers_in_millions ~ fecha, data = .x))) |>
mutate(
mod = map(mod, broom::tidy)
) |>
unnest(mod) |>
filter(term == "fecha") |>
mutate(sube = if_else(
estimate > 0,
c1,
c2
))
# identifico las temporadas más populares
d |>
mutate(año = year(fecha)) |>
reframe(
viewers_in_millions = median(viewers_in_millions),
fecha = mean(fecha),
.by = c(año, season)
) |>
arrange(desc(viewers_in_millions))
# combino fechas y audiencias con pendientes del modelo lineal
d2 <- inner_join(d, d_mod, by = join_by(año)) |>
select(any_of(names(d)), sube)
# número de temporada ubicado debajo y en el medio de cada conjunto
d_season <- d |>
mutate(año = year(fecha)) |>
reframe(
fecha = mean(fecha),
.by = c(season, año)
) |>
mutate(
label = if_else(
season < 10,
glue("T0{season}"),
glue("T{season}")
)
) |>
inner_join(d2, by = join_by(season, año)) |>
rename(fecha = fecha.x) |>
reframe(
fecha = median(fecha),
viewers_in_millions = min(viewers_in_millions)-.6,
.by = c(label, sube)
)
# 1er programa
fecha_1 <- d |>
slice(1) |>
pull(fecha) |>
format("%d de %B de %Y")
fecha_1_label <- glue(
"El 1<sup>er</sup> programa se emite<br>",
"el {fecha_1}."
)
# figura ------------------------------------------------------------------
# título de eje vertical y subtítulo
titulo_y <- "Espectadores<br><span style='font-size:17px'>(en millones)</span>"
mi_subtitulo <- glue(
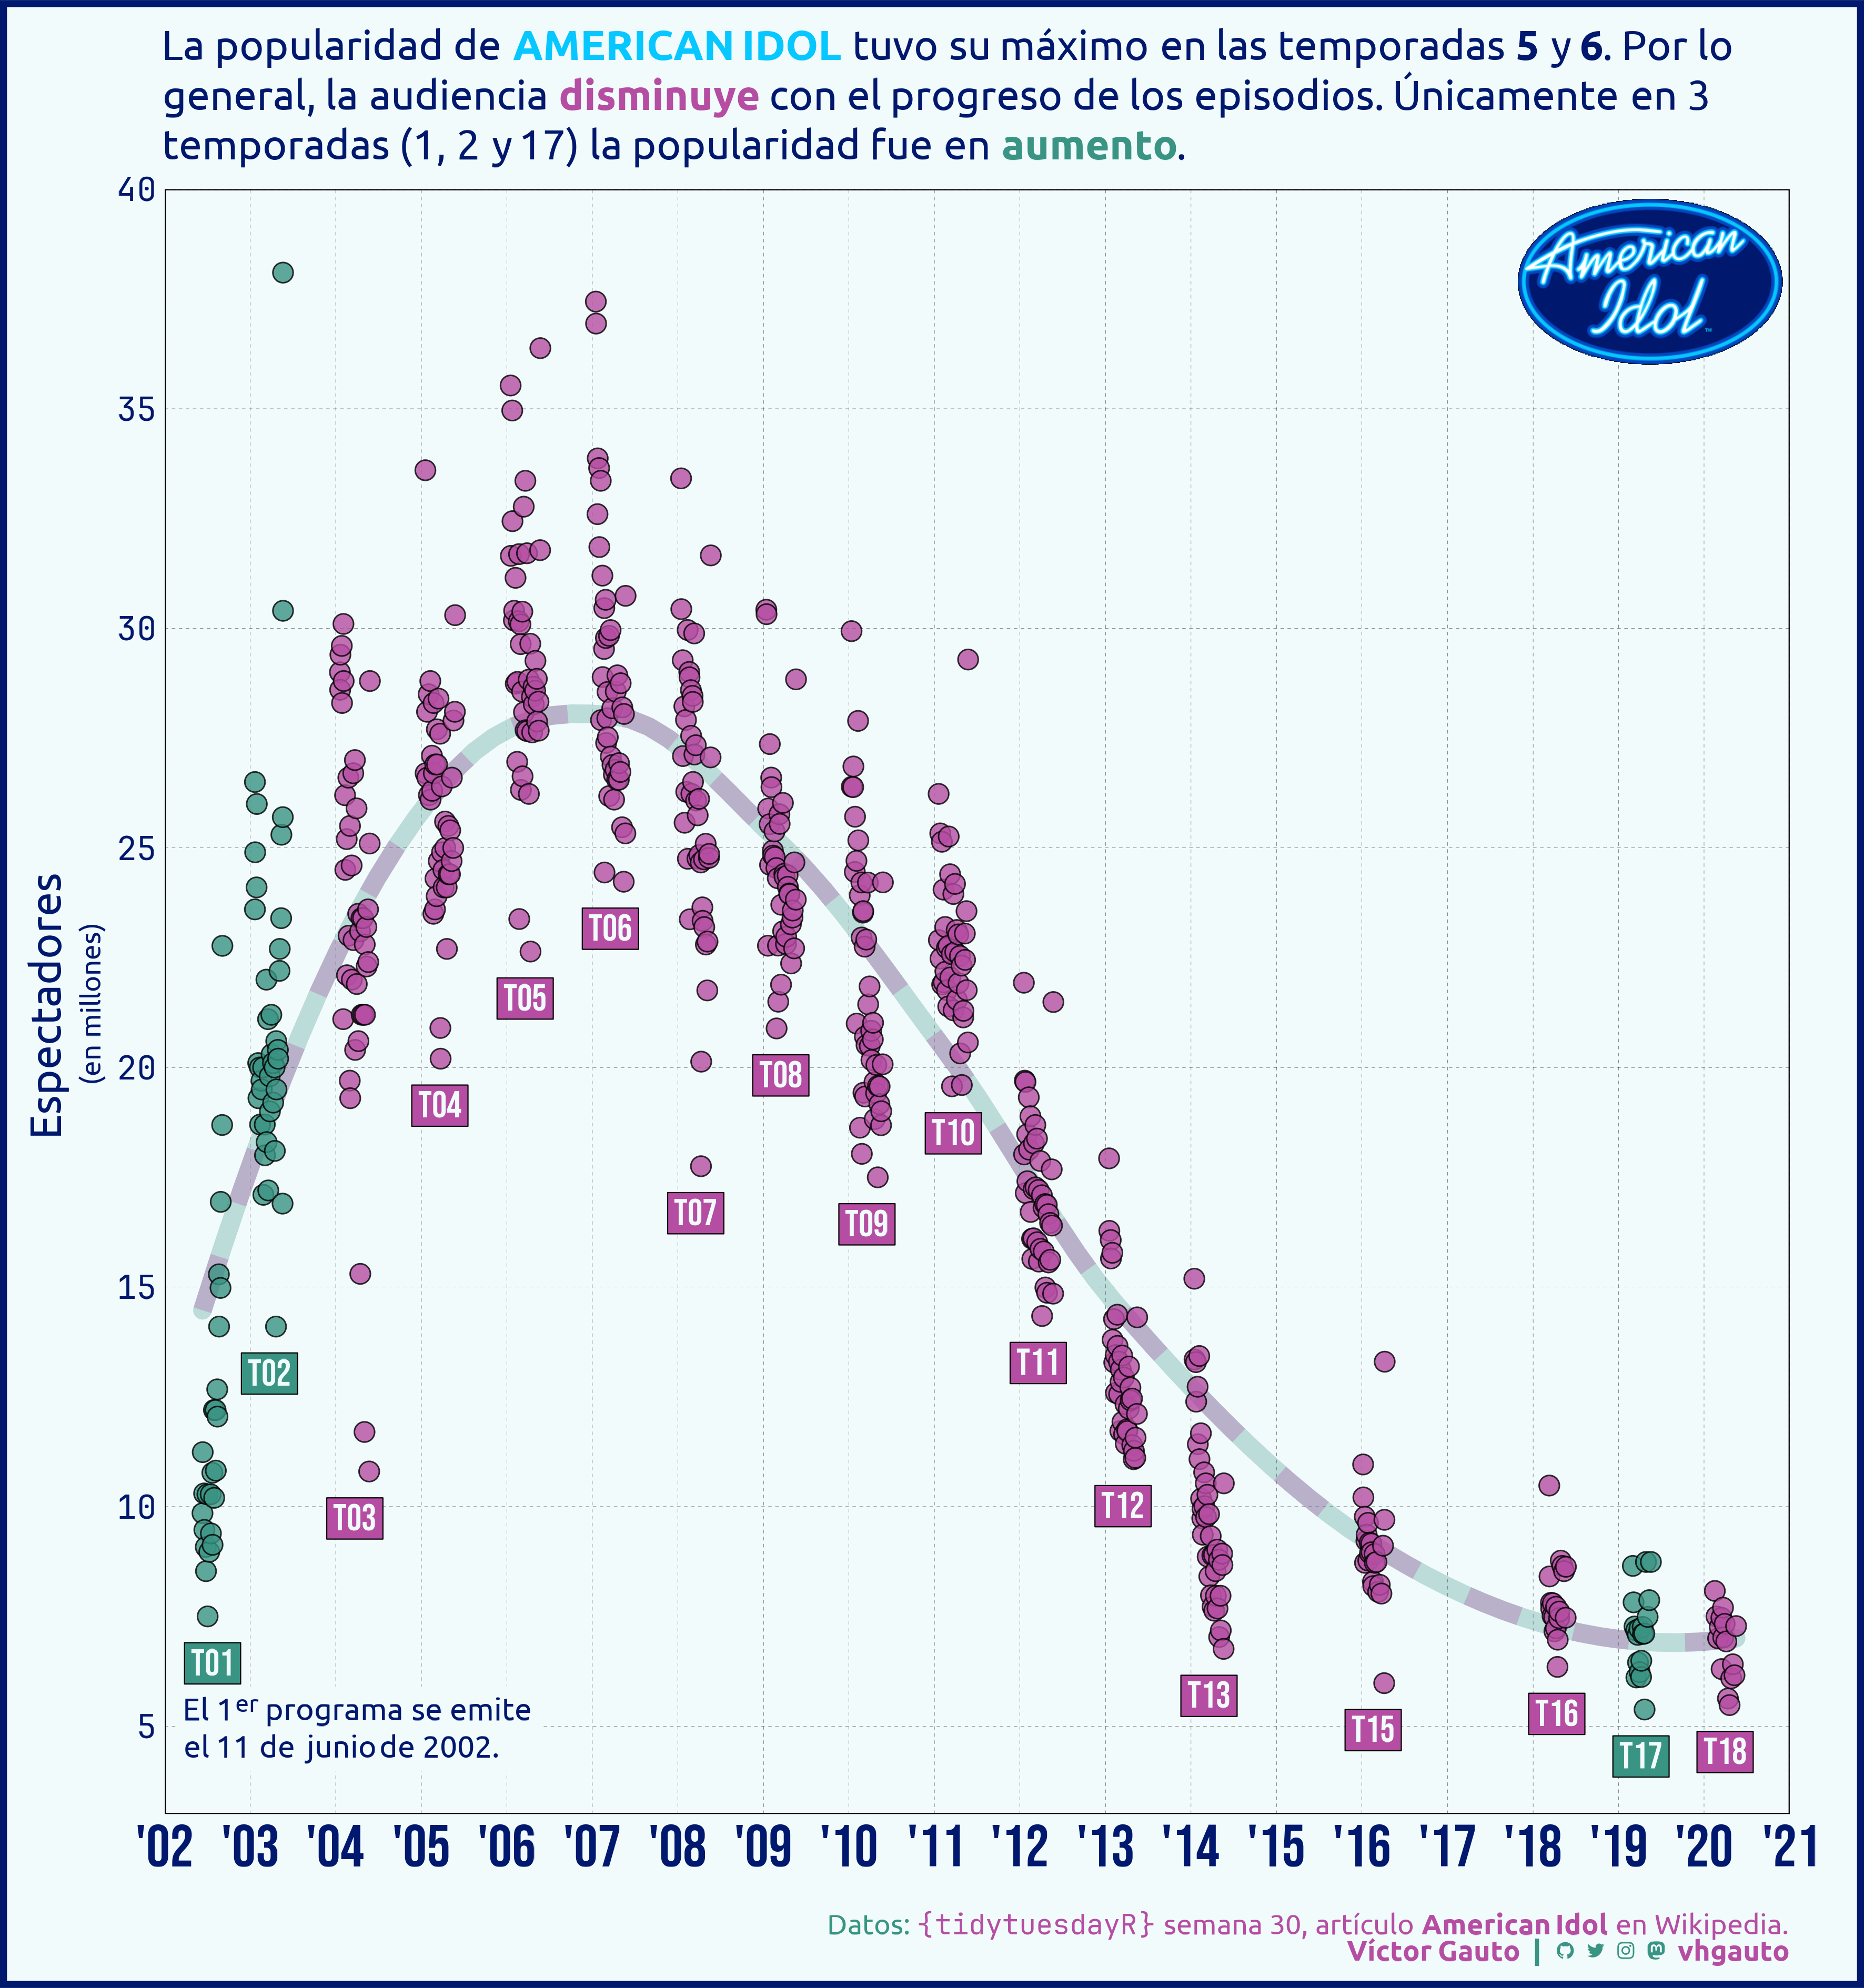
"La popularidad de <b style='color:{c6}'>AMERICAN IDOL</b> tuvo su máximo en",
"las temporadas <b>5</b> y <b>6</b>. Por lo general, la audiencia",
"<b style='color:{c2}'>disminuye</b> con el progreso de los episodios.",
"Únicamente en 3 temporadas (1, 2 y 17) la popularidad fue en",
"<b style='color:{c1}'>aumento</b>.",
.sep = " "
)
# logo (.svg) de American Idol
svg_url <-
"https://upload.wikimedia.org/wikipedia/commons/8/87/American_Idol_logo.svg"
svg_txt <- paste(readLines(svg_url), collapse = "n")
# figura
g <- ggplot(d2, aes(fecha, viewers_in_millions)) +
# tendencia
geom_smooth(
se = FALSE, color = alpha(c1, .3), method = loess, formula = y ~ x,
linetype = 1, linewidth = 4, lineend = "round") +
geom_smooth(
se = FALSE, color = alpha(c2, .3), method = loess, formula = y ~ x,
linetype = "33", linewidth = 4) +
# puntos
geom_point(
fill = d2$sube, shape = 21, size = 4, color = c4, alpha = .8) +
# temporadas
geom_richtext(
data = d_season, aes(fecha, viewers_in_millions, label = label), size = 6,
family = "bebas", vjust = 1, fill = d_season$sube, color = c3,
label.padding = unit(0.2, "lines"), label.colour = c4,
label.r = unit(0, "mm")
) +
# American Idol logo
geom_point_svg(
x = ymd(20210101),y = 40, svg = svg_txt, size = 45, hjust = 1, vjust = 1) +
# 1er programa
annotate(
geom = "richtext", x = d_season$fecha[1]-months(5),
y = d_season$viewers_in_millions[1]-1, label = fecha_1_label, fill = c3,
label.color = NA, family = "ubuntu", size = 5, hjust = 0, vjust = 1,
color = c5
) +
scale_x_date(
date_breaks = "1 year", date_labels = "'%y", position = "bottom",
limits = ymd(20020101, 20210101), expand = c(0, 0)) +
scale_y_continuous(
breaks = seq(5, 40, 5),
limits = c(3, 40),
expand = c(0, 0)) +
labs(x = NULL, y = titulo_y, subtitle = mi_subtitulo, caption = mi_caption) +
theme_linedraw() +
theme(
aspect.ratio = 1,
plot.margin = margin(r = 34, l = 14),
plot.background = element_rect(
fill = c3, color = c5, linewidth = 3),
plot.subtitle = element_textbox_simple(
family = "ubuntu", size = 19, color = c5,
margin = margin(b = 10, t = 14.2)),
plot.caption = element_markdown(
family = "ubuntu", size = 13, color = c1,
margin = margin(t = 20, b = 10)),
panel.background = element_blank(),
panel.grid.minor = element_blank(),
panel.grid.major = element_line(linetype = "FF"),
axis.line = element_blank(),
axis.ticks = element_blank(),
axis.text.x = element_text(
family = "bebas", size = 27, color = c5),
axis.text.y = element_text(family = "jet", size = 15, color = c5),
axis.title.y = element_markdown(
family = "ubuntu", size = 20, color = c5),
legend.position = "none"
)
# guardo
ggsave(
plot = g,
filename = "2024/s30/viz.png",
width = 30,
height = 32,
units = "cm")
# abro
browseURL("2024/s30/viz.png")