# paquetes ----------------------------------------------------------------
library(glue)
library(ggtext)
library(showtext)
library(tidyverse)
# fuente ------------------------------------------------------------------
# colores
c1 <- "#3B99B1"
c2 <- "#EACB2B"
c3 <- "#F5191C"
c4 <- "grey95"
c5 <- "grey20"
# fuente: Ubuntu
font_add(
family = "ubuntu",
regular = "fuente/Ubuntu-Regular.ttf",
bold = "fuente/Ubuntu-Bold.ttf",
italic = "fuente/Ubuntu-Italic.ttf")
# monoespacio & íconos
font_add(
family = "jet",
regular = "fuente/JetBrainsMonoNLNerdFontMono-Regular.ttf")
showtext_auto()
showtext_opts(dpi = 300)
# caption
fuente <- glue(
"Datos: <span style='color:{c3};'><span style='font-family:jet;'>",
"{{<b>tidytuesdayR</b>}}</span> semana {23}, ",
"<b>cheese.com</b></span>")
autor <- glue("<span style='color:{c3};'>**Víctor Gauto**</span>")
icon_twitter <- glue("<span style='font-family:jet;'></span>")
icon_instagram <- glue("<span style='font-family:jet;'></span>")
icon_github <- glue("<span style='font-family:jet;'></span>")
icon_mastodon <- glue("<span style='font-family:jet;'>󰫑</span>")
usuario <- glue("<span style='color:{c3};'>**vhgauto**</span>")
sep <- glue("**|**")
mi_caption <- glue(
"{fuente}<br>{autor} {sep} {icon_github} {icon_twitter} {icon_instagram} ",
"{icon_mastodon} {usuario}")
# datos -------------------------------------------------------------------
tuesdata <- tidytuesdayR::tt_load(2024, 23)
cheeses <- tuesdata$cheeses
# me interesa el queso con mayor contenido graso por país
d <- cheeses |>
mutate(id = row_number()) |>
mutate(fat_content = str_remove(fat_content, " g/100g")) |>
mutate(fat_content = str_remove(fat_content, "%")) |>
separate_longer_delim(cols = fat_content, delim = "-") |>
mutate(fat_content = parse_number(fat_content)) |>
reframe(
fat_content = mean(fat_content),
.by = c(country, cheese, id)
) |>
select(-id) |>
drop_na() |>
mutate(country = fct_reorder(country, fat_content)) |>
filter(!str_detect(country, ",")) |>
slice_max(order_by = fat_content, by = country, n = 1, with_ties = FALSE) |>
mutate(cheese = str_remove(cheese, "Cremig Extra Würzig, "))
# browseURL("https://github.com/fonttools/region-flags/tree/gh-pages")
# enlace a repositorio con .png de banderas
link <- "https://raw.githubusercontent.com/fonttools/region-flags/gh-pages/png/"
# agrego el código de país de dos letras e incorporo los links a las banderas
e <- countrycode::codelist |>
select(cctld, country = country.name.en) |>
inner_join(d, by = join_by(country)) |>
mutate(cctld = str_remove(cctld, ".")) |>
mutate(cctld = toupper(cctld)) |>
mutate(bandera = glue("{link}{cctld}.png")) |>
mutate(
label = glue("<img src='{bandera}' height='25'/>")
) |>
mutate(label = fct_reorder(label, fat_content)) |>
arrange(label) |>
mutate(fila = row_number()) |>
mutate(hjust = if_else(fila %% 2 == 0, 0, 1)) |>
mutate(cheese_x = if_else(hjust == 0, fat_content+2, fat_content-2))
# figura ------------------------------------------------------------------
# título y subtítulo
icon_queso <- glue("<span style='font-family:jet;'></span>")
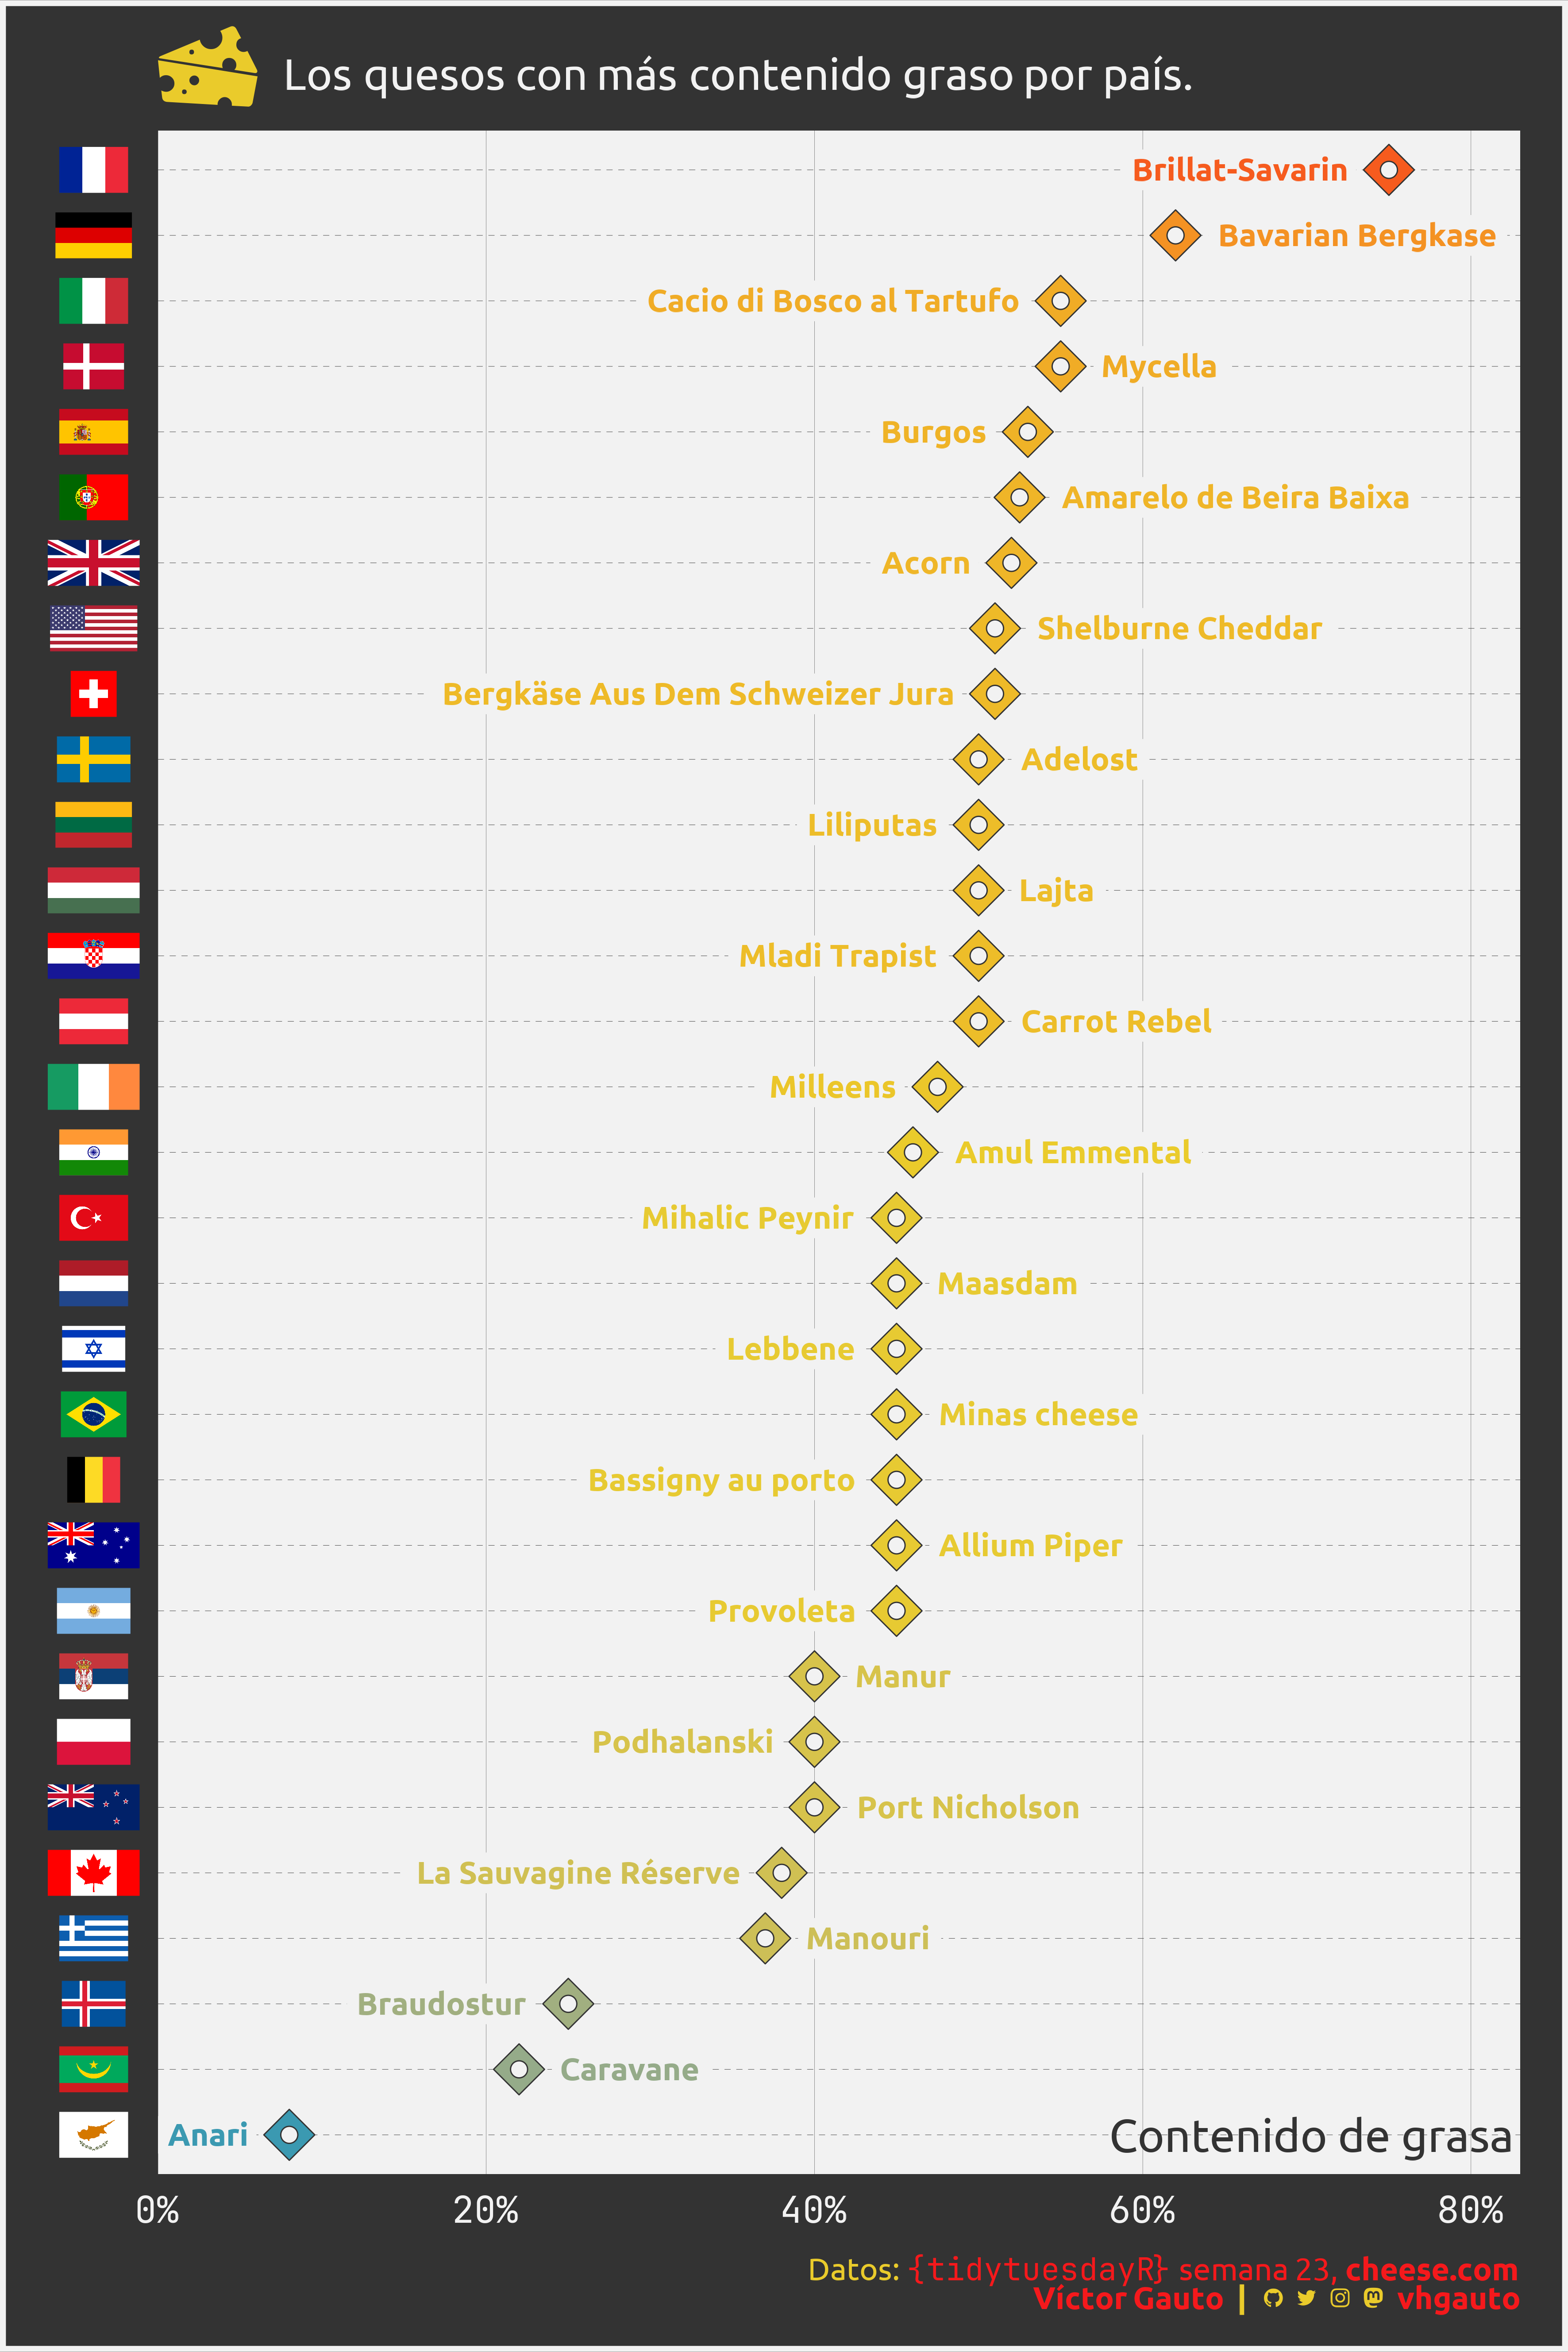
mi_subtitulo <- glue(
"Los quesos con más contenido graso por país."
)
# mediana para la paleta de color
m <- median(e$fat_content)
# figura
g <- ggplot(e, aes(fat_content, label, fill = fat_content)) +
geom_point(alpha = 1, size = 10, shape = 23, color = c5) +
geom_point(color = c5, alpha = 1, size = 4, shape = 21, fill = c4) +
geom_label(
aes(x = cheese_x,label = cheese, hjust = hjust, color = fat_content),
family = "ubuntu", size = 6, fill = c4, label.size = unit(0, "mm"),
fontface = "bold") +
scale_x_continuous(
limits = c(0, 83),
labels = scales::label_number(suffix = "%"),
expand = c(0, 0),
breaks = seq(0, 80, 20)) +
scale_fill_gradient2(low = c1, mid = c2, high = c3, midpoint = m) +
scale_color_gradient2(low = c1, mid = c2, high = c3, midpoint = m) +
labs(
x = "Contenido de grasa", y = NULL, title = icon_queso,
subtitle = mi_subtitulo, caption = mi_caption) +
theme_void() +
theme(
aspect.ratio = 1.5,
plot.margin = margin(b = 10, r = 26, l = 26, t = 2.5),
plot.background = element_rect(fill = c5, color = c4, linewidth = 3),
plot.title.position = "panel",
plot.title = element_markdown(
size = 90, color = c2, hjust = 0, margin = margin(b = -20)),
plot.subtitle = element_markdown(
family = "ubuntu", size = 24, color = c4,
margin = margin(b = 10, t = -35, l = 70)),
plot.caption = element_markdown(
color = c2, family = "ubuntu", size = 17,
margin = margin(t = 55, b = 10)),
panel.background = element_rect(fill = c4, color = NA),
panel.grid.minor = element_blank(),
panel.grid.major.x = element_line(
linetype = 1, color = c5, linewidth = .06),
panel.grid.major.y = element_line(
linetype = "FF", color = c5, linewidth = .1),
axis.ticks = element_blank(),
axis.title.x = element_text(
family = "ubuntu", size = 25, hjust = .99, margin = margin(t = -60),
color = c5),
axis.text.x = element_text(
family = "jet", size = 20, color = c4, margin = margin(t = 10)),
axis.text.y = element_markdown(hjust = .5, margin = margin(r = 10)),
legend.position = "none"
)
# abro
ggsave(
plot = g,
filename = "2024/s23/viz.png",
width = 30,
height = 45,
units = "cm")
# guardo
browseURL("2024/s23/viz.png")