# paquetes ----------------------------------------------------------------
library(glue)
library(ggtext)
library(showtext)
library(tidyverse)
# fuente ------------------------------------------------------------------
# colores
c1 <- "#582851"
c2 <- "#40606D"
c3 <- "#69A257"
c4 <- "#C4024D"
# fuente: Ubuntu
font_add(
family = "ubuntu",
regular = "fuente/Ubuntu-Regular.ttf",
bold = "fuente/Ubuntu-Bold.ttf",
italic = "fuente/Ubuntu-Italic.ttf"
)
# monoespacio & íconos
font_add(
family = "jet",
regular = "fuente/JetBrainsMonoNLNerdFontMono-Regular.ttf"
)
# Bebas Neue
font_add(
family = "bebas",
regular = "fuente/BebasNeue-Regular.ttf"
)
showtext_auto()
showtext_opts(dpi = 300)
# caption
fuente <- glue(
"Datos: <span style='color:{c3};'><span style='font-family:jet;'>",
"{{<b>tidytuesdayR</b>}}</span> semana {49}, ",
"<b>National Highways Traffic Flow</b>.</span>"
)
autor <- glue("<span style='color:{c3};'>**Víctor Gauto**</span>")
icon_twitter <- glue("<span style='font-family:jet;'></span>")
icon_instagram <- glue("<span style='font-family:jet;'></span>")
icon_github <- glue("<span style='font-family:jet;'></span>")
icon_mastodon <- glue("<span style='font-family:jet;'>󰫑</span>")
icon_bsky <- glue("<span style='font-family:jet;'></span>")
usuario <- glue("<span style='color:{c3};'>**vhgauto**</span>")
sep <- glue("**|**")
mi_caption <- glue(
"{fuente}<br>{autor} {sep} {icon_github} {icon_twitter} {icon_instagram} ",
"{icon_mastodon} {icon_bsky} {usuario}"
)
# datos -------------------------------------------------------------------
tuesdata <- tidytuesdayR::tt_load(2024, 49)
a64 <- tuesdata$A64_traffic
# me interesa las velocidades según la hora del día, por categoría de tamaño
# de vehículo
d <- a64 |>
janitor::clean_names() |>
select(time_period_ending, avg_mph, contains("cm")) |>
pivot_longer(
cols = ends_with("_cm"),
names_to = "tamaño",
values_to = "cantidad"
) |>
filter(cantidad > 0) |>
mutate(
tamaño = factor(
x = tamaño,
levels = c("x0_520_cm", "x521_660_cm", "x661_1160_cm", "x1160_cm"),
labels = c("<5,2 m", "5,21—6,6 m", "6,61—11,6 m", ">11,6 m")
)
) |>
mutate(kmh = avg_mph*1.60934) |>
mutate(
color = case_match(
tamaño,
"<5,2 m" ~ c1,
"5,21—6,6 m" ~ c2,
"6,61—11,6 m" ~ c3,
">11,6 m" ~ c4
)
) |>
mutate(
tamaño_label = glue(
"Tamaño:<b style='color:{color}; font-family:jet'> {tamaño}</b>"
)
) |>
mutate(
tamaño_label = fct_reorder(tamaño_label, as.numeric(tamaño))
)
# figura ------------------------------------------------------------------
# factor de conversión entre km/h y mph
conv <- 1.60934
# subtítulo y símbolo de flechas
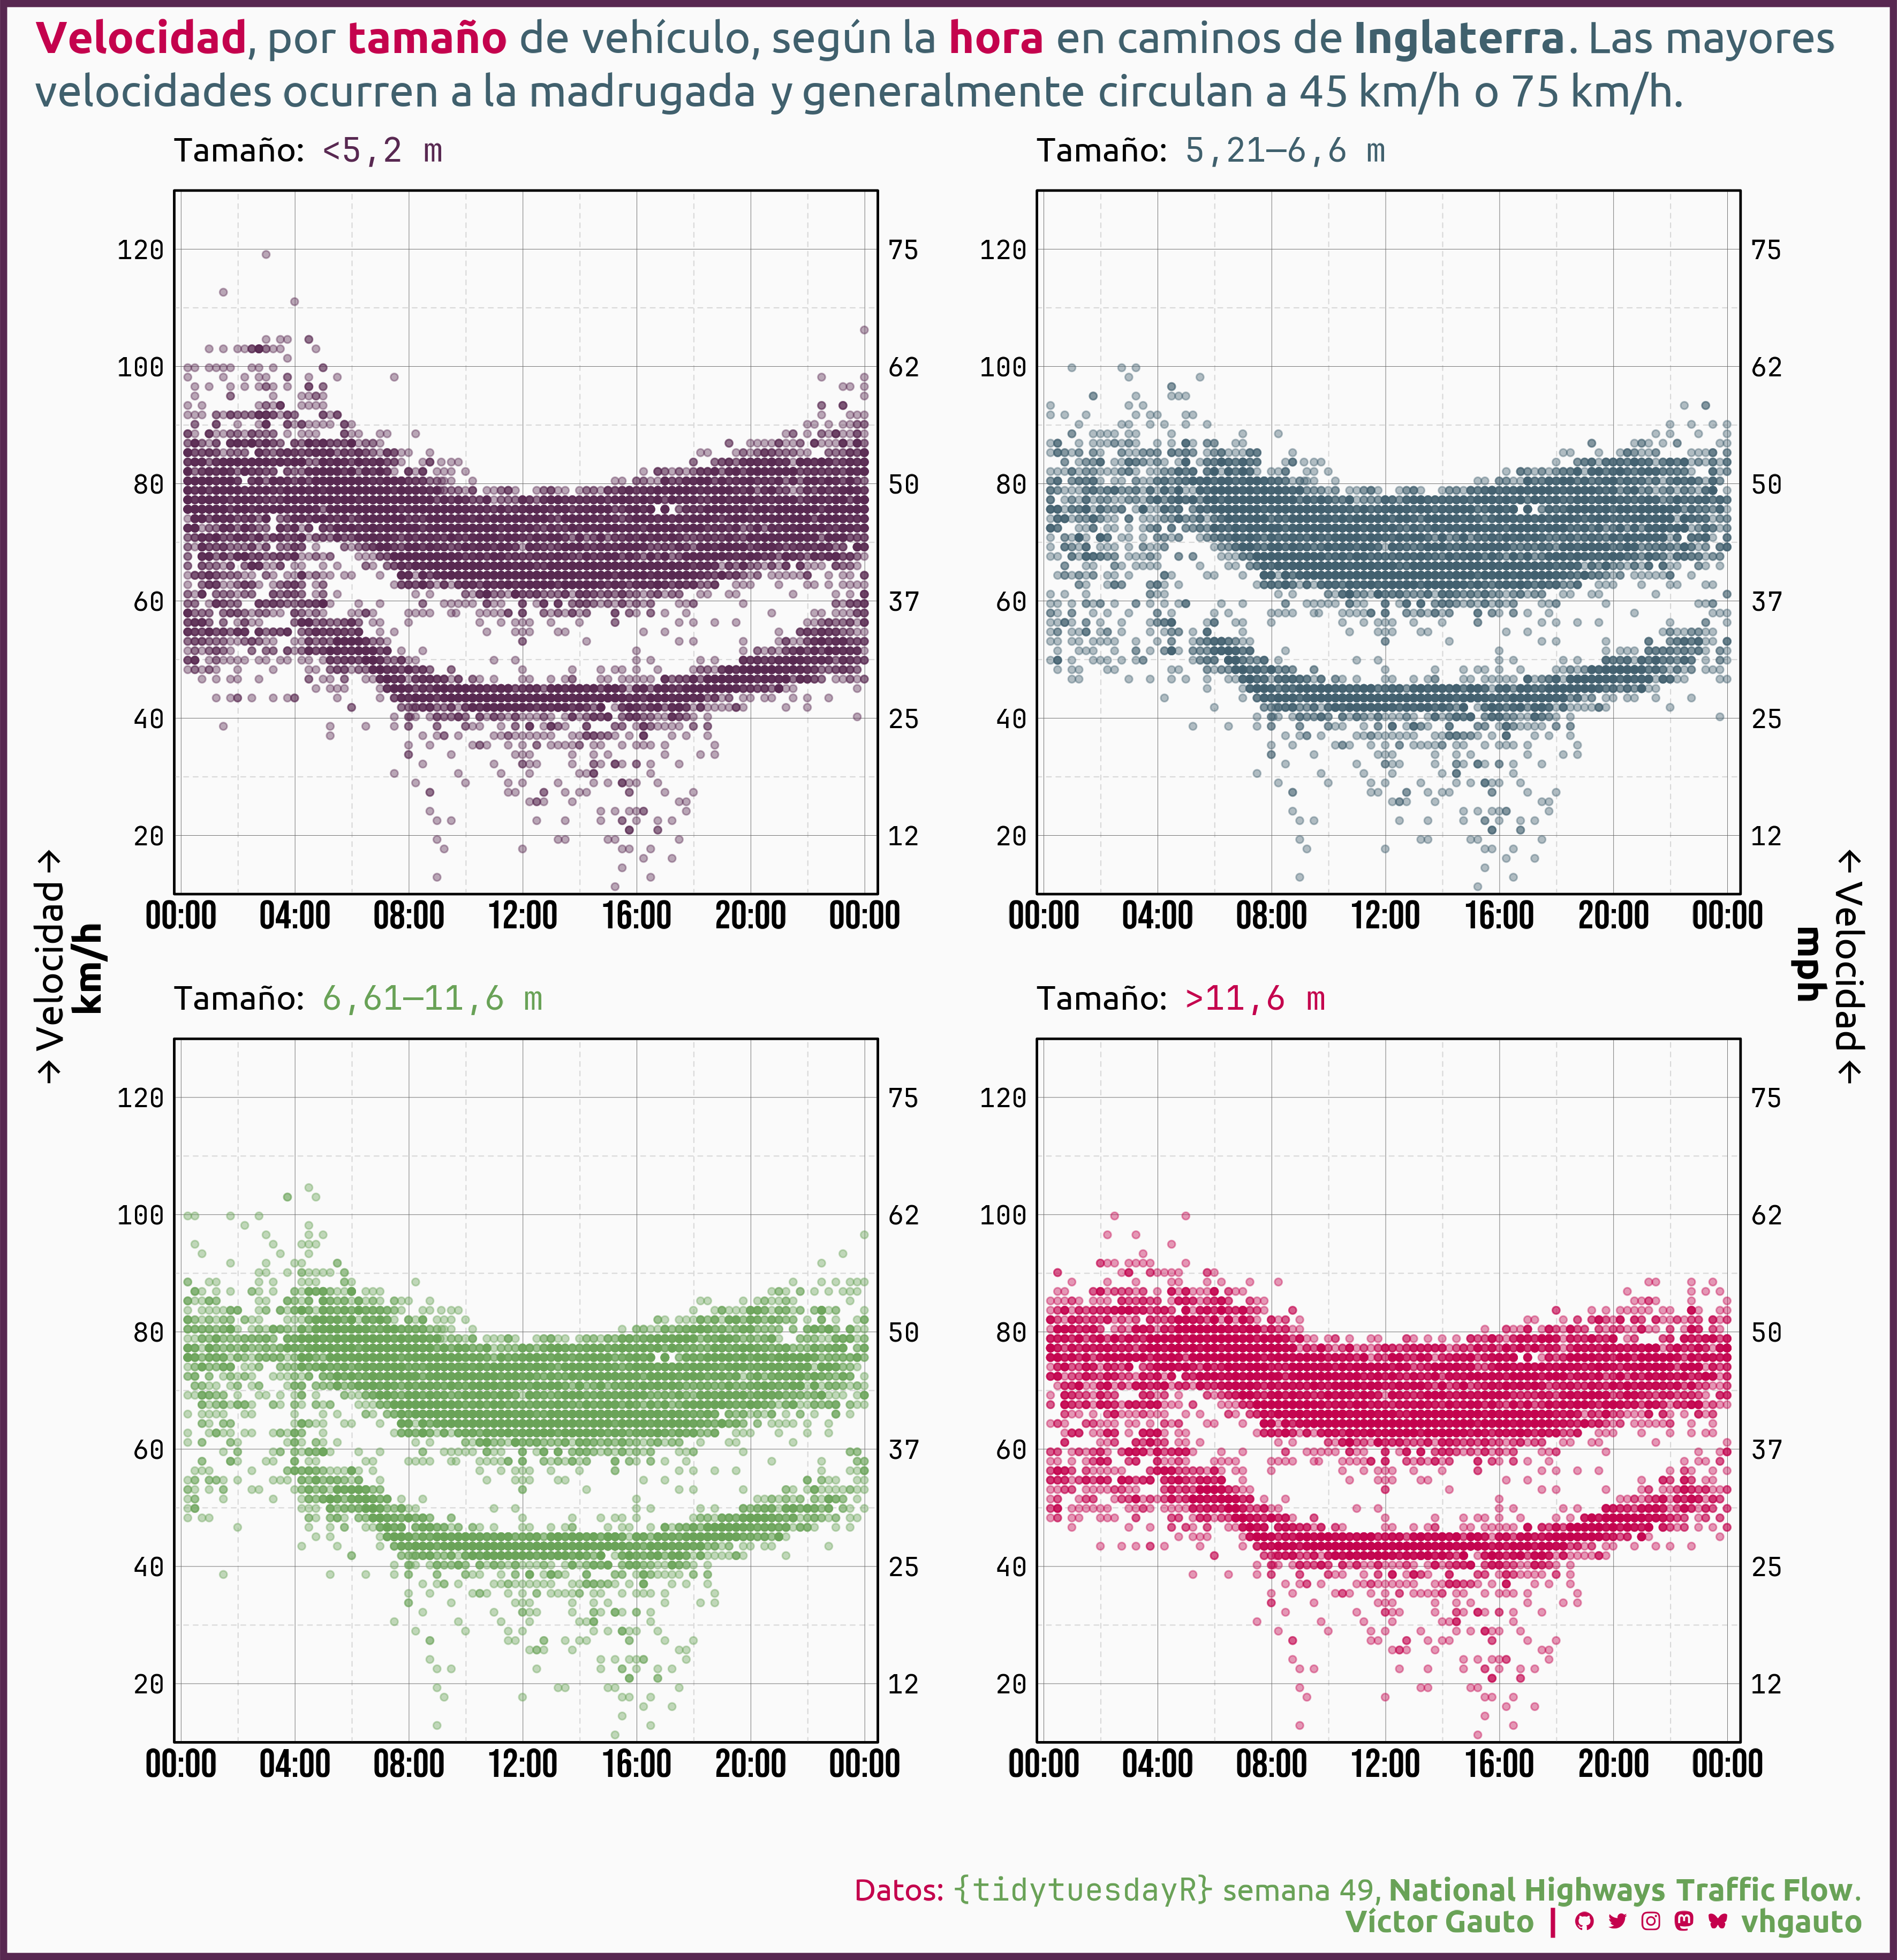
mi_subtitulo <- glue(
"<b style='color:{c4}'>Velocidad</b>, por ",
"<b style='color:{c4}'>tamaño</b> de vehículo, según ",
"la <b style='color:{c4}'>hora</b> en caminos ",
"de **Inglaterra**. Las mayores velocidades ocurren a la madrugada y ",
"generalmente circulan a 45 km/h o 75 km/h."
)
flecha1 <- "<span style='font-family:jet;'>󰁔</span>"
flecha2 <- "<span style='font-family:jet;'>󰁍</span>"
# figura
g <- ggplot(d, aes(time_period_ending, kmh, color = tamaño_label)) +
geom_point(alpha = .4, shape = 20, size = 2, show.legend = FALSE) +
facet_wrap(vars(tamaño_label), nrow = 2, scales = "free") +
scale_x_time(
labels = scales::label_time(format = "%H:%M"),
breaks = scales::breaks_width("4 hour"),
expand = expansion(mult = .02, add = 0),
sec.axis = sec_axis(transform = ~ .)
) +
scale_y_continuous(
limits = c(10, 130),
breaks = scales::breaks_width(20),
expand = c(0, 0),
name = glue("{flecha1} Velocidad {flecha1}<br>**km/h**"),
sec.axis = sec_axis(
transform = ~ ./conv,
name = glue("{flecha2} Velocidad {flecha2}<br>**mph**"),
breaks = seq(20/conv, 120/conv, length.out = 6),
labels = scales::label_number(accuracy = 1)
)
) +
scale_color_manual(
values = c(c1, c2, c3, c4)
) +
coord_cartesian(clip = "off") +
labs(x = NULL, subtitle = mi_subtitulo, caption = mi_caption) +
ggthemes::theme_par(base_size = 5) +
theme(
aspect.ratio = 1,
plot.title.position = "plot",
plot.subtitle = element_textbox_simple(
family = "ubuntu", size = 20, color = c2, margin = margin(b = 10, t = 10)
),
plot.margin = margin(0, 15, 0, 15.8),
plot.background = element_rect(
fill = "grey98", color = c1, linewidth = 3
),
plot.caption.position = "plot",
plot.caption = element_markdown(
family = "ubuntu", size = 14, color = c4, margin = margin(t = 45, b = 10)
),
panel.grid.major = element_line(
linetype = 1, linewidth = .1, color = "grey40"
),
panel.grid.minor = element_line(linetype = 2, color = "grey85"),
panel.spacing = unit(25, "pt"),
axis.ticks = element_blank(),
axis.text.x = element_text(
family = "bebas", size = 18, margin = margin(t = -5)
),
axis.text.x.top = element_blank(),
axis.text.y.left = element_text(
family = "jet", size = 12, margin = margin(r = -2), hjust = 1
),
axis.text.y.right = element_text(
family = "jet", size = 12, margin = margin(l = -2), hjust = 0
),
axis.title.y = element_markdown(family = "ubuntu", size = 17),
strip.text.x.top = element_markdown(
family = "ubuntu", hjust = 0, size = 15, margin = margin(t = 0)
),
strip.background = element_blank(),
strip.placement = "outside"
)
# guardo
ggsave(
plot = g,
filename = "2024/s49/viz.png",
width = 30,
height = 31,
units = "cm"
)
# abro
browseURL("2024/s49/viz.png")