# paquetes ----------------------------------------------------------------
library(glue)
library(ggtext)
library(showtext)
library(tidyverse)
# fuente ------------------------------------------------------------------
# colores
c1 <- "#CD1076"
c2 <- "#679C35"
c3 <- "#B54EA3"
c4 <- "#80A1C1"
c5 <- colorspace::lighten(c4, .9)
c6 <- colorspace::lighten(c4, .5)
c7 <- "white"
c8 <- "black"
# fuente: Ubuntu
font_add(
family = "ubuntu",
regular = "fuente/Ubuntu-Regular.ttf",
bold = "fuente/Ubuntu-Bold.ttf",
italic = "fuente/Ubuntu-Italic.ttf"
)
# monoespacio & íconos
font_add(
family = "jet",
regular = "fuente/JetBrainsMonoNLNerdFontMono-Regular.ttf"
)
# fontawesome
font_add(
family = "fa",
regular = "fuente/Font Awesome 6 Free-Solid-900.otf"
)
showtext_auto()
showtext_opts(dpi = 300)
# caption
fuente <- glue(
"Datos: <span style='color:{c1};'><span style='font-family:jet;'>",
"{{<b>tidytuesdayR</b>}}</span> semana {34}, ",
"English Monarchs and Marriages, <b>ianvisits</b>.</span>"
)
autor <- glue("<span style='color:{c1};'>**Víctor Gauto**</span>")
icon_twitter <- glue("<span style='font-family:jet;'></span>")
icon_instagram <- glue("<span style='font-family:jet;'></span>")
icon_github <- glue("<span style='font-family:jet;'></span>")
icon_mastodon <- glue("<span style='font-family:jet;'>󰫑</span>")
usuario <- glue("<span style='color:{c1};'>**vhgauto**</span>")
sep <- glue("**|**")
mi_caption <- glue(
"{fuente}<br>{autor} {sep} {icon_github} {icon_twitter} {icon_instagram} ",
"{icon_mastodon} {usuario}"
)
# datos -------------------------------------------------------------------
tuesdata <- tidytuesdayR::tt_load(2024, 34)
monarcas <- tuesdata$english_monarchs_marriages_df
# me interesa si el monarca es mayor o menor que su consorte
# categorías asociadas al diferencia de edad
categorias <- c(
glue("El monarca es <b style='color: {c1}'>mayor</b><br>que el consorte"),
glue("El monarca es <b style='color: {c2}'>menor</b><br>que el consorte"),
glue("<b style='color: {c3}'>Igual</b> edad")
) |>
fct_inorder()
# arreglo de datos y agrego categorías
d <- monarcas |>
mutate(
across(
.cols = ends_with("_age"),
.fns = ~ if_else(.x == "?", NA, .x)
)
) |>
mutate(
across(
.cols = ends_with("_age"),
.fns = ~ if_else(.x == "–", NA, .x)
)
) |>
mutate(
across(
.cols = ends_with("_age"),
.fns = ~ str_replace(.x, "\(\?\)", "")
)
) |>
mutate(
across(
.cols = ends_with("_age"),
.fns = as.numeric
)
) |>
drop_na() |>
mutate(dif = king_age - consort_age) |>
mutate(es_mayor = case_when(
king_age > consort_age ~ categorias[1],
king_age < consort_age ~ categorias[2],
.default = categorias[3]
))
# matrimonio con máxima diferencia
d_max <- d |>
slice_max(order_by = dif)
max_label <- glue(
"{d_max$king_name} ({d_max$king_age}) y",
"{d_max$consort_name} ({d_max$consort_age})",
.sep = "<br>"
)
# matrimonio con la menor edad
d_min <- d |>
slice_min(order_by = king_age)
min_label <- glue(
"{d_min$king_name} ({d_min$king_age}) y",
"{d_min$consort_name} ({d_min$consort_age})",
.sep = "<br>"
)
# combino el matrimonio con la máxima diferencia y el de menor edad
d_ext <- bind_rows(d_max, d_min) |>
mutate(
label = glue(
"{king_name}: <b style='font-family:jet; color: {c1}'>{king_age}</b><br>",
"{consort_name}: <b style='font-family:jet; color: {c1}'>{consort_age}",
"</b><br>",
"Matrimonio: <b style='font-family:jet; color: {c1}'>{year_of_marriage}</b>"
)
)
# figura ------------------------------------------------------------------
# título y subtítulo
corona <- glue("<span style='font-family:jet;'></span>")
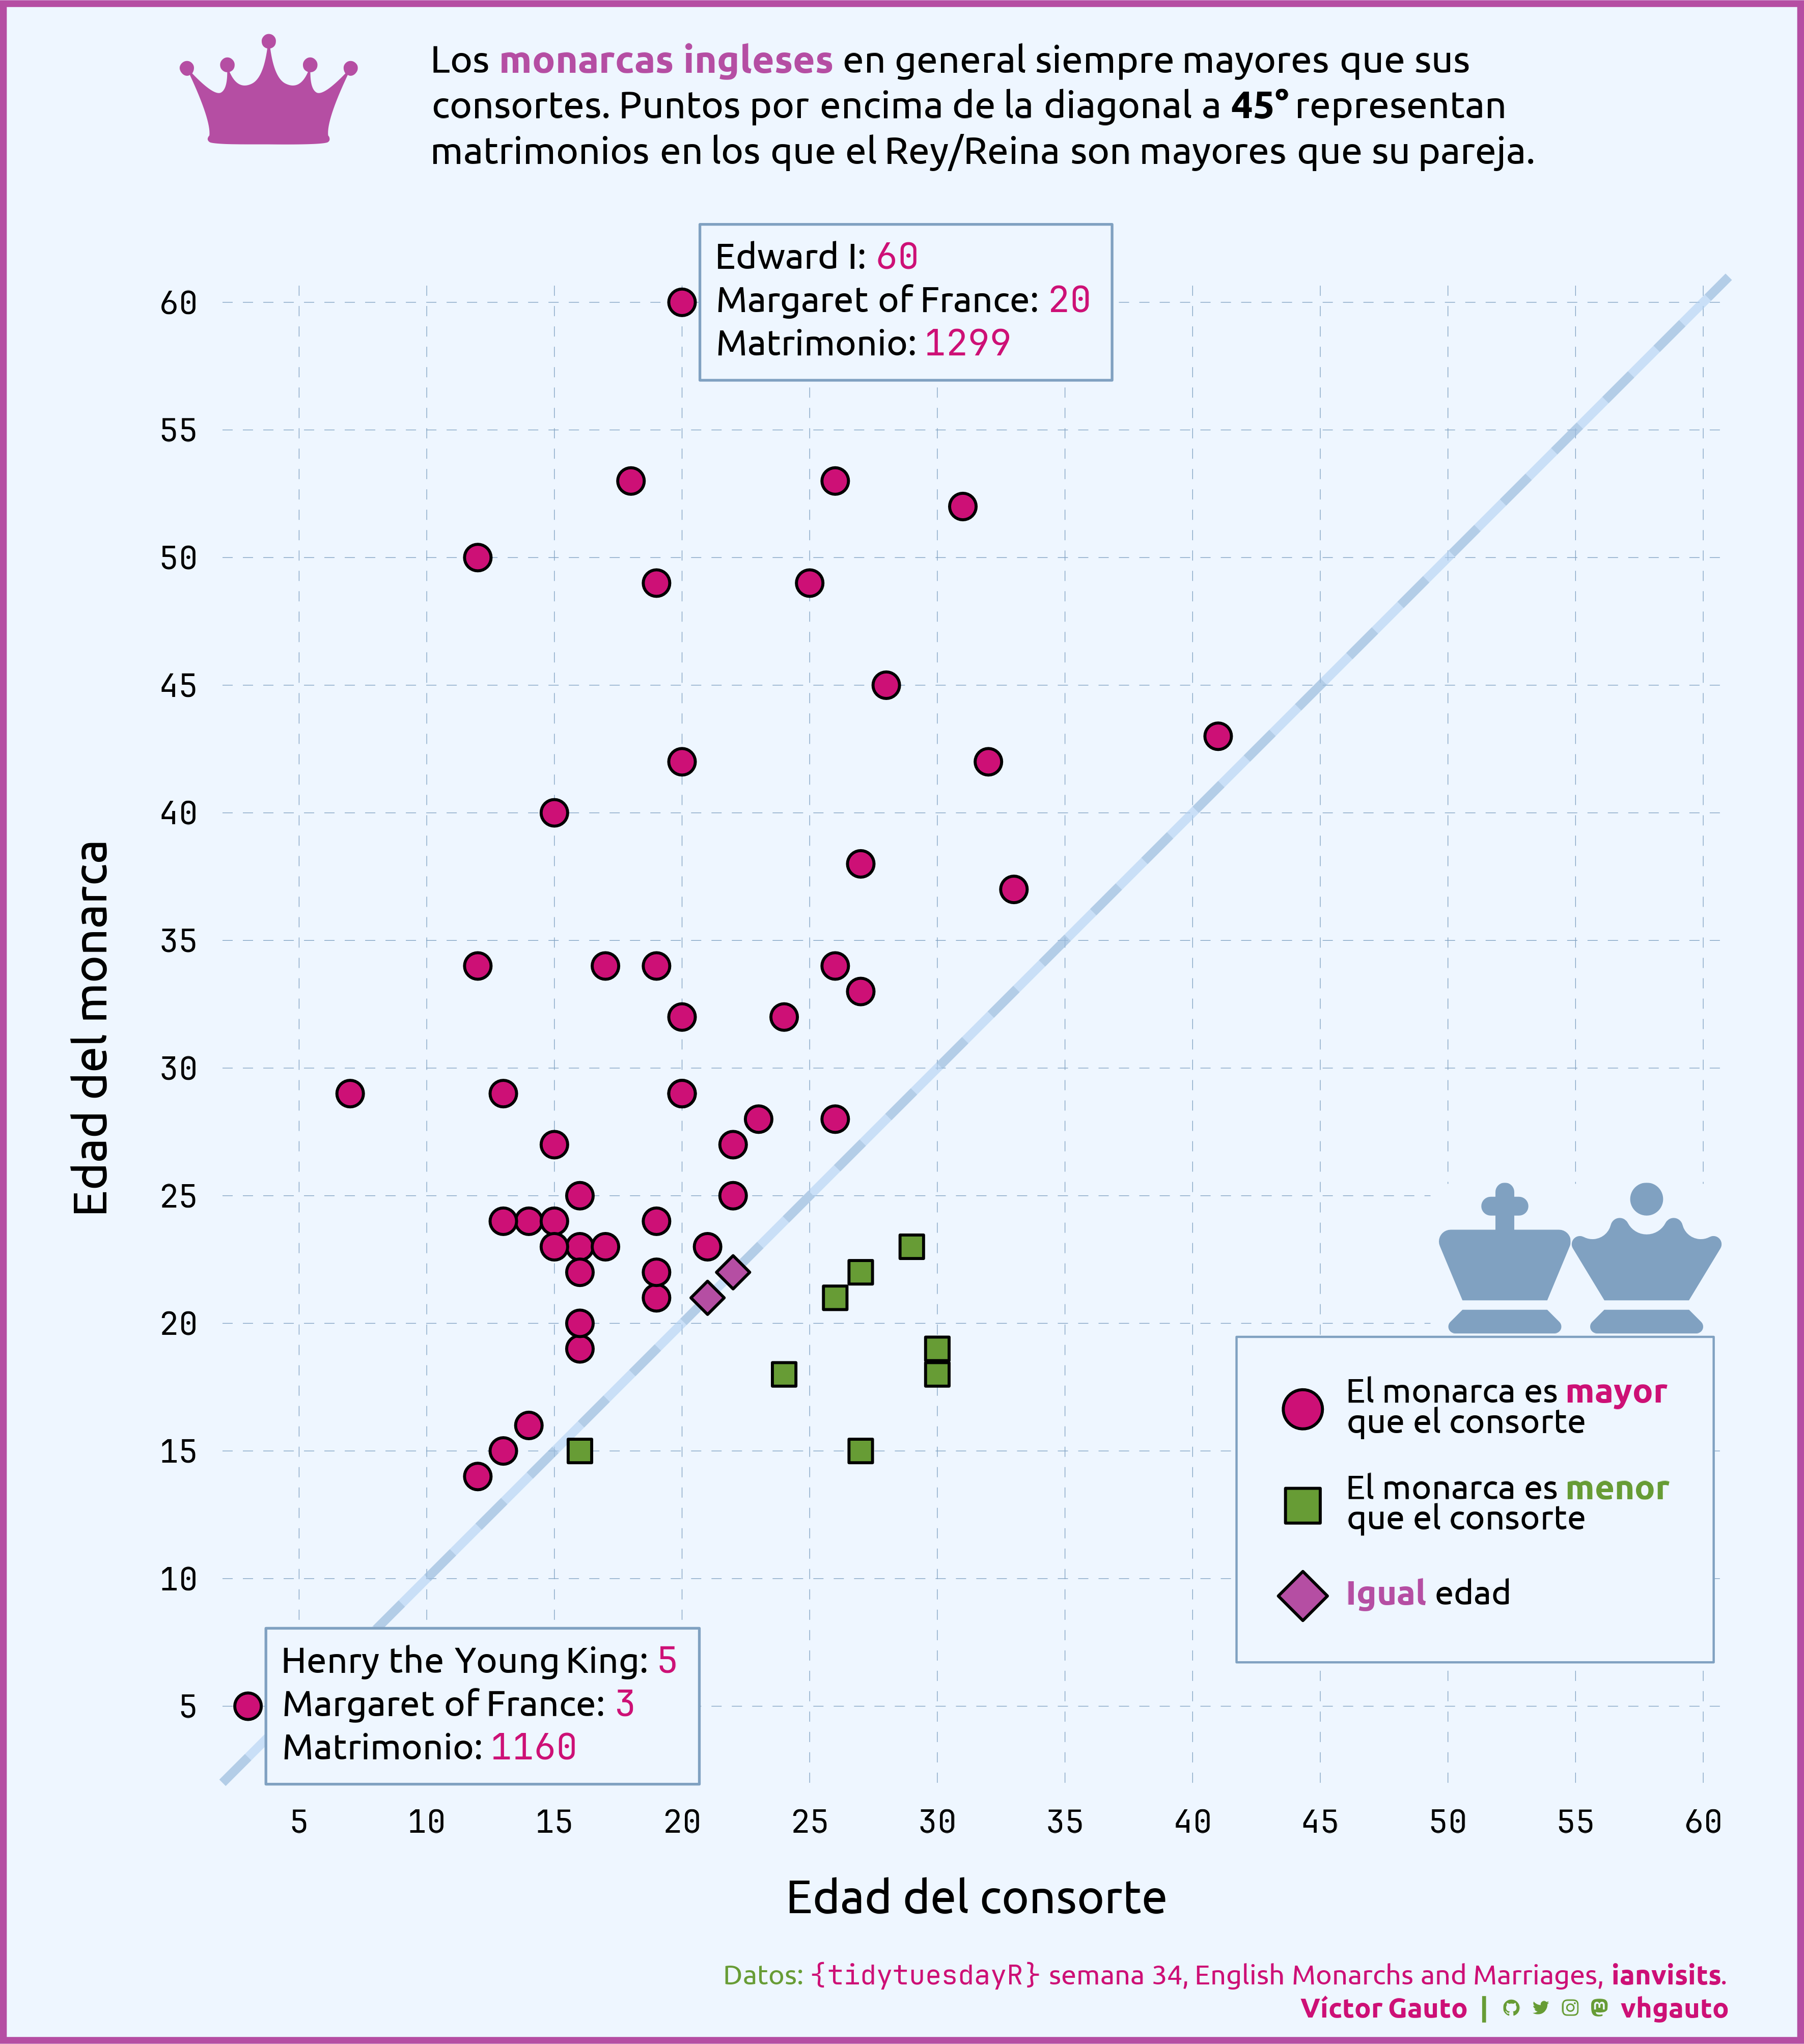
mi_subtitulo <- glue(
"Los <b style='color: {c3}'>monarcas ingleses</b> en general siempre ",
"mayores que sus<br>",
"consortes. Puntos por encima de la diagonal a <b>45°</b> representan ",
"<br>",
"matrimonios en los que el Rey/Reina son mayores que su pareja."
)
# ícono de rey/reina del ajedrez sobre la leyenda
icono_rey <- "<span style='font-family:fa;'></span>"
icono_reina <- "<span style='font-family:fa;'></span>"
# figura
g <- ggplot(
d,
aes(
consort_age, king_age, fill = es_mayor, shape = es_mayor)
) +
# 45°
geom_abline(color = c6, linetype = 1, linewidth = 2, alpha = .6) +
geom_abline(color = c4, linetype = "44", linewidth = 2, alpha = .3) +
# puntos
geom_point(size = 5.2, alpha = 1, color = c8, stroke = 1) +
# máximo/mínimo
geom_richtext(
data = d_ext, aes(label = label), fill = c5, color = c8, nudge_x = .7,
family = "ubuntu", size = 6, hjust = 0, label.color = c4, vjust = .5,
label.r = unit(0, "mm"), label.size = unit(.6, "mm"),
label.padding = unit(3, "mm")
) +
# corona rey/reina
annotate(
geom = "richtext", x = I(1), y = I(.285), hjust = 1, vjust = 0, fill = c5,
label = glue("{icono_rey}{icono_reina}"), label.color = NA, size = 25,
color = c4
) +
scale_x_continuous(
limits = c(3, 60), breaks = scales::breaks_width(5), expand = c(0, 1)
) +
scale_y_continuous(
limits = c(3, 60), breaks = scales::breaks_width(5), expand = c(0, 1)
) +
scale_fill_manual(values = c(c1, c2, c3)) +
scale_shape_manual(values = c(21, 22, 23)) +
coord_cartesian(clip = "off") +
labs(
x = "Edad del consorte", y = "Edad del monarca", fill = NULL,
shape = NULL, caption = mi_caption, title = corona, subtitle = mi_subtitulo
) +
guides(
fill = guide_legend(position = "inside", override.aes = list(size = 8)),
shape = guide_legend(position = "inside")
) +
theme_minimal() +
theme(
aspect.ratio = 1,
plot.margin = margin(r = 35.6, l = 35),
plot.background = element_rect(fill = c5, color = c3, linewidth = 3),
plot.title = element_markdown(
color = c3, size = 140, margin = margin(b = -100, t = -10, l = 50)
),
plot.title.position = "plot",
plot.subtitle = element_markdown(
family = "ubuntu", color = c8, size = 18, lineheight = unit(1.2, "line"),
margin = margin(b = 50, l = 170)
),
plot.caption = element_markdown(
family = "ubuntu", size = 13, color = c2, margin = margin(t = 20, b = 10),
lineheight = unit(1.2, "line")
),
panel.grid.major = element_line(
linetype = "FF", linewidth = .15, color = c4
),
panel.grid.minor = element_blank(),
axis.text = element_text(family = "jet", size = 15, color = c8),
axis.text.x = element_text(margin = margin(t = 10)),
axis.text.y = element_text(margin = margin(r = 10)),
axis.title = element_text(family = "ubuntu", size = 22),
axis.title.x = element_text(margin = margin(t = 20)),
axis.title.y = element_text(margin = margin(r = 20)),
legend.position.inside = c(.99, .08),
legend.justification.inside = c(1, 0),
legend.background = element_rect(fill = c5, color = c4),
legend.text = element_markdown(
family = "ubuntu", size = 16, margin = margin(l = 10), color = c8
),
legend.margin = margin(20, 20, 20, 20),
legend.key.spacing.y = unit(.6, "cm")
)
# guardo
ggsave(
plot = g,
filename = "2024/s34/viz.png",
width = 30,
height = 34,
units = "cm")
# abro
browseURL(glue("{getwd()}/2024/s34/viz.png"))