# paquetes ----------------------------------------------------------------
library(glue)
library(ggtext)
library(showtext)
library(sf)
library(patchwork)
library(tidyverse)
# fuente ------------------------------------------------------------------
# colores
col <- MoMAColors::moma.colors(palette_name = "Exter")
# fuente: Ubuntu
font_add(
family = "ubuntu",
regular = "fuente/Ubuntu-Regular.ttf",
bold = "fuente/Ubuntu-Bold.ttf",
italic = "fuente/Ubuntu-Italic.ttf")
# fuente: Bebas Neue
font_add(
family = "bebas",
regular = "fuente/BebasNeue-Regular.ttf")
# monoespacio & íconos
font_add(
family = "jet",
regular = "fuente/JetBrainsMonoNLNerdFontMono-Regular.ttf")
showtext_auto()
showtext_opts(dpi = 300)
# caption
fuente <- glue(
"Datos: <span style='color:{col[3]};'><span style='font-family:mono;'>",
"{{<b>tidytuesdayR</b>}}</span> semana {17}. ",
"Online Index of Objects Launched into Outer Space (ONU), ",
"Our World in Data</span>")
autor <- glue("<span style='color:{col[3]};'>**Víctor Gauto**</span>")
icon_twitter <- glue("<span style='font-family:jet;'></span>")
icon_instagram <- glue("<span style='font-family:jet;'></span>")
icon_github <- glue("<span style='font-family:jet;'></span>")
icon_mastodon <- glue("<span style='font-family:jet;'>󰫑</span>")
usuario <- glue("<span style='color:{col[3]};'>**vhgauto**</span>")
sep <- glue("**|**")
mi_caption <- glue(
"{fuente}<br>{autor} {sep} {icon_github} {icon_twitter} {icon_instagram} ",
"{icon_mastodon} {usuario}")
# datos -------------------------------------------------------------------
tuesdata <- tidytuesdayR::tt_load(2024, 17)
obj <- tuesdata$outer_space_objects
# me interesa la cantidad de objetos enviados por Argentina, y agregar el mapa
# de Argentina
d <- obj |>
filter(Entity == "Argentina") |>
select(año = Year, n = num_objects) |>
mutate(s = cumsum(n))
# mapa de Argentina, continental
arg <- st_read("extra/arg_continental.gpkg") |>
st_transform(crs = 5346)
# figura ------------------------------------------------------------------
# extensión de Argentina continental
bb_arg <- st_bbox(arg)
# centro de Argentina continental, para crear cuadrados concéntricos
centro_x <- (bb_arg$xmax + bb_arg$xmin)/2
centro_y <- (bb_arg$ymax + bb_arg$ymin)/2
# función que genera sf de cuadrados concéntricos a partir de la extensión
f_bb <- function(ext) {
bb <- c(centro_x - ext, centro_x + ext, centro_y - ext, centro_y + ext)
names(bb) <- NULL
bb_sf <- st_bbox(
c(xmin = bb[1], xmax = bb[2], ymin = bb[3], ymax = bb[4]),
crs = st_crs(5346)) |>
st_as_sfc()
return(bb_sf)
}
# cuadrados alrededor de Argentina
bb_sf1 <- f_bb(3e6)
bb_sf2 <- f_bb(4e6)
# ícono de satélite
satelite <- "<span style='font-family:jet;'>󰑱</span>"
# subtítulo
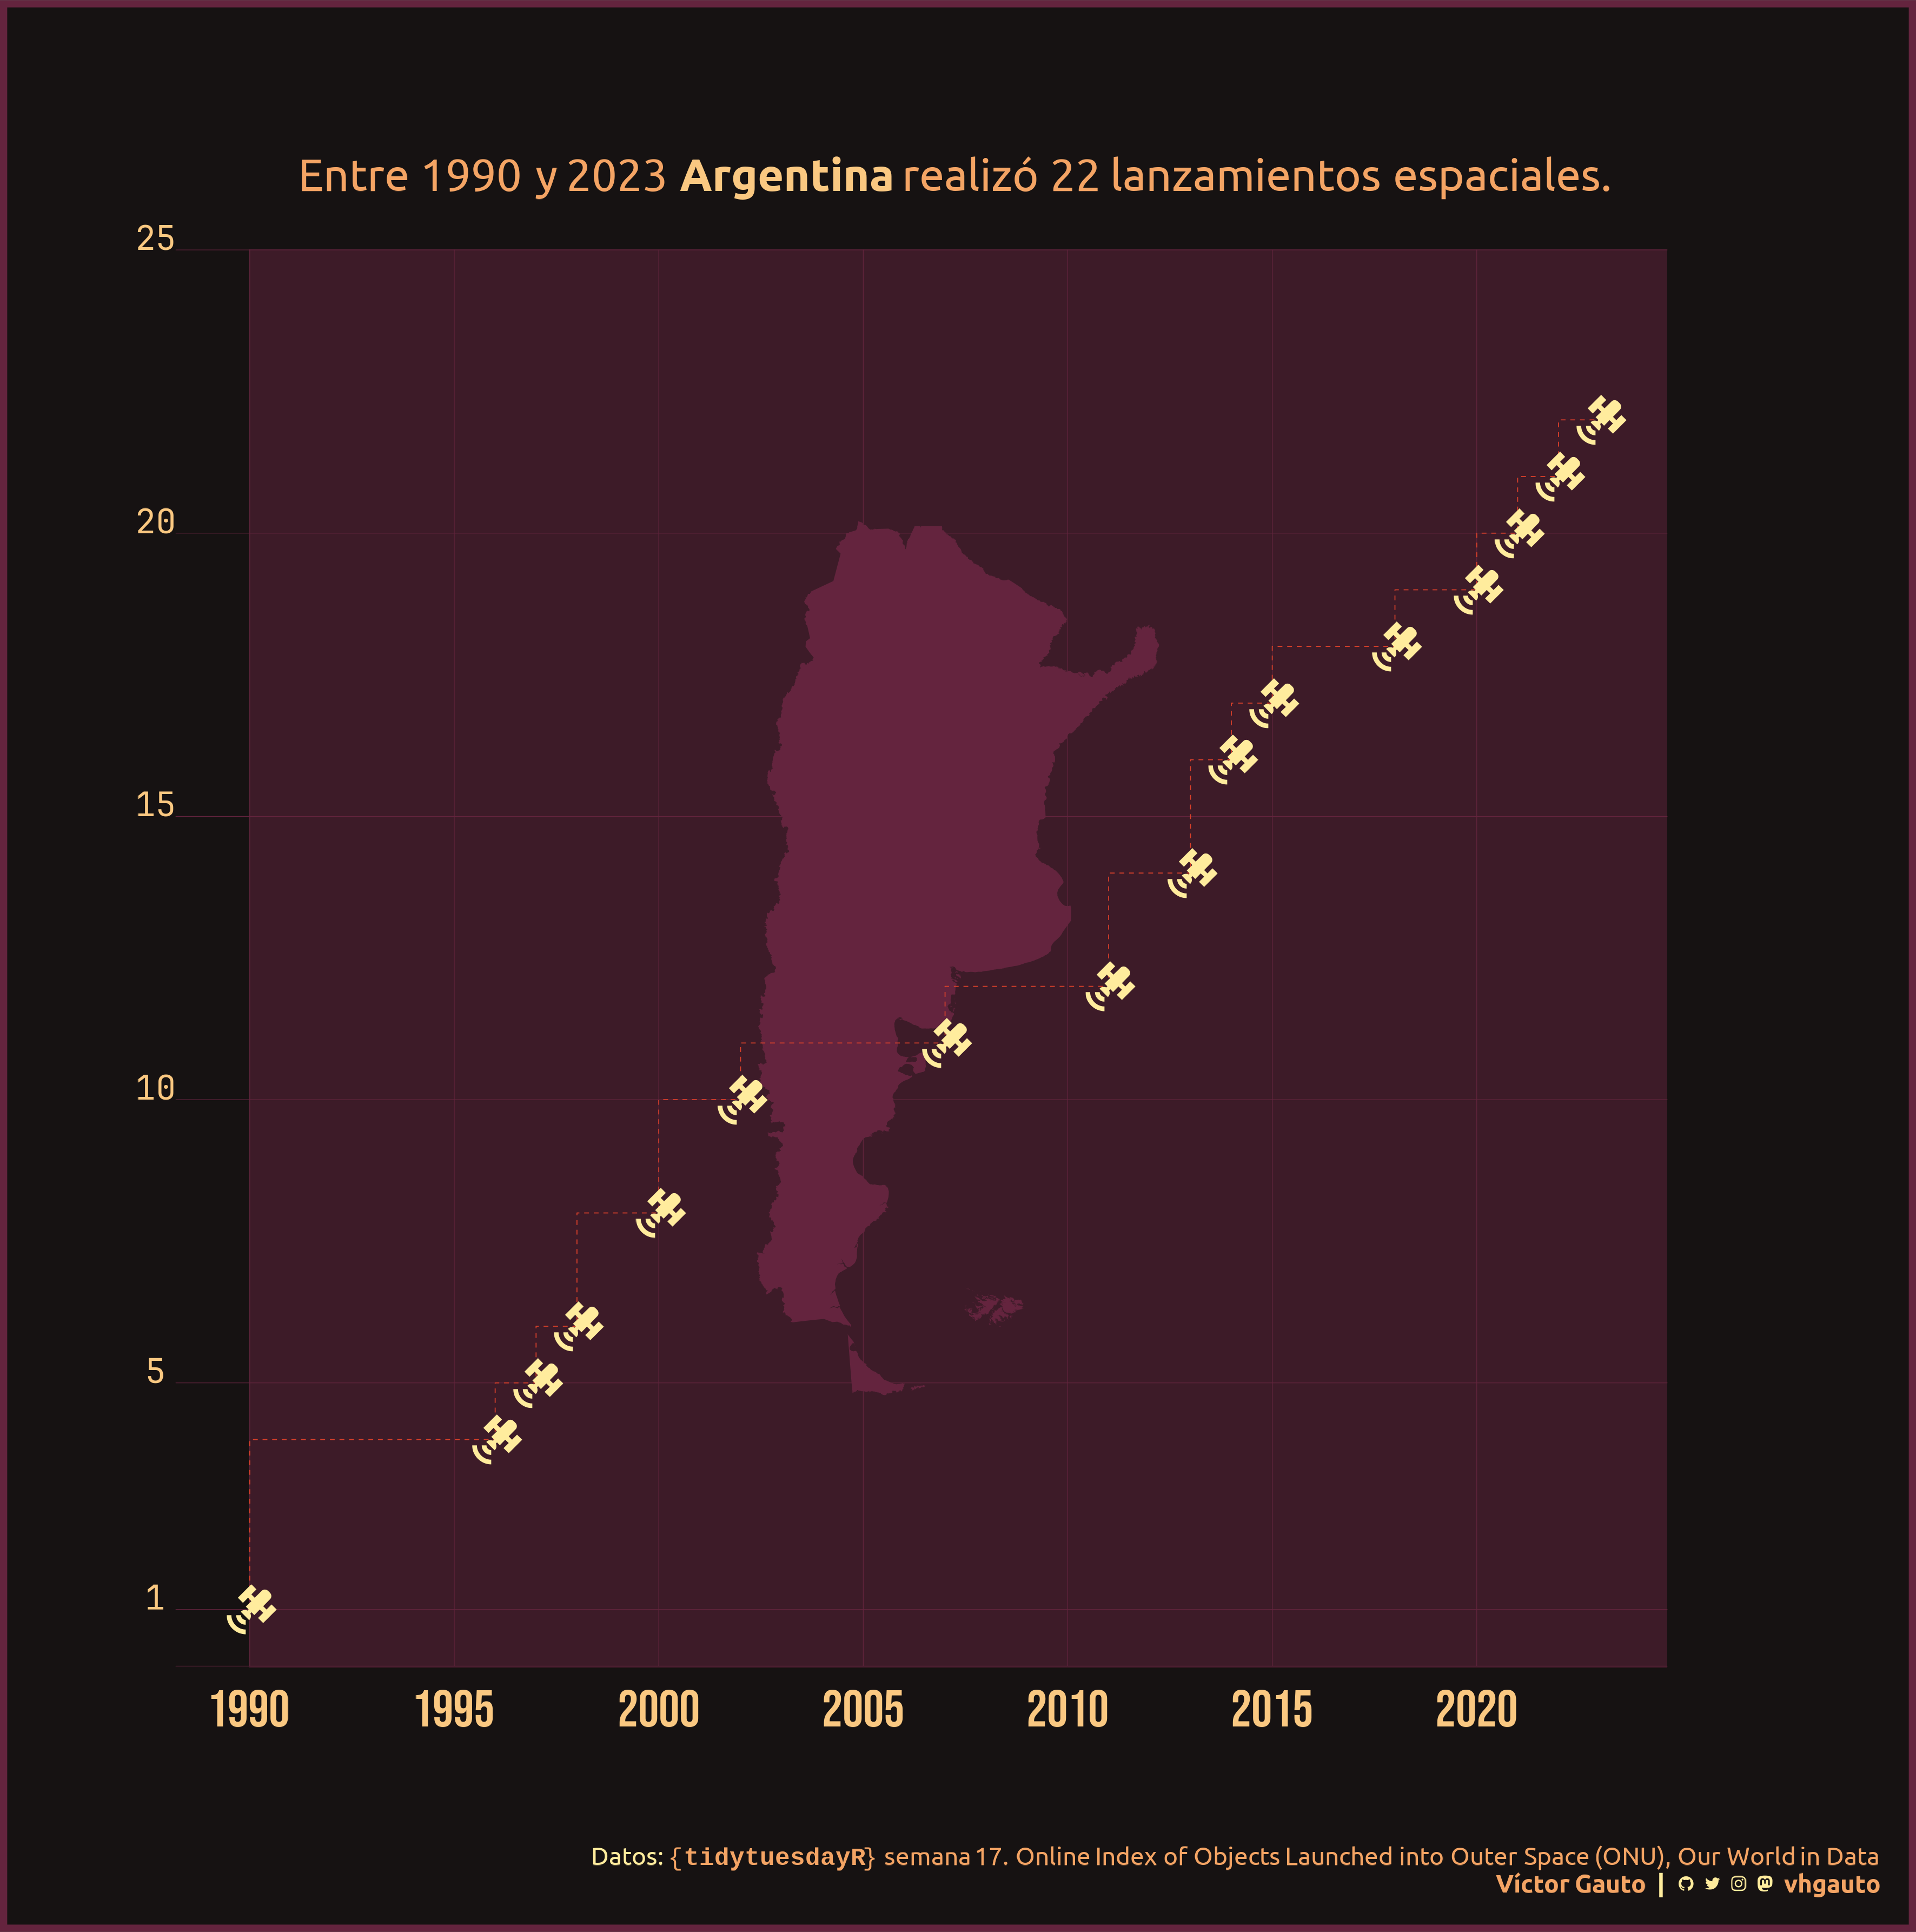
mi_subtitle <- glue(
"Entre {min(d$año)} y {max(d$año)} <b style='color:{col[2]};'>Argentina</b> ",
"realizó {max(d$s)} lanzamientos espaciales."
)
# mapa de Argentina continental, con 2 recuadros concéntricos
g_arg <- ggplot() +
# recuadros
geom_sf(data = bb_sf2, fill = col[10], color = NA) +
geom_sf(data = bb_sf1, fill = col[9], color = NA) +
# Argentina continental
geom_sf(data = arg, fill = col[8], color = NA, linewidth = .2) +
# subtítulo
annotate(
geom = "richtext", x = centro_x, y = st_bbox(bb_sf1)$ymax*1.02, hjust = .5,
vjust = 0, label = mi_subtitle, color = col[3], family = "ubuntu",
size = 7, fill = NA, label.color = NA) +
coord_sf(expand = FALSE) +
theme_void()
# figura de puntos, satélites
g_sat <- ggplot(d, aes(año, s)) +
# escalera
geom_step(color = col[5], linetype = "55", linewidth = .2, direction = "vh") +
# satélite
geom_richtext(
aes(label = satelite), color = col[1], size = 13, fill = NA,
label.color = NA, angle = -90, nudge_x = -.15) +
scale_x_continuous(
breaks = scales::breaks_width(5), limits = c(NA, 2023)) +
scale_y_continuous(
limits = c(0, 25), breaks = c(0, 1, seq(5, 25, 5)), expand = c(0, 0),
labels = c("", 1, seq(5, 25, 5))) +
coord_cartesian(clip = "off") +
theme_void() +
theme(
axis.text.x = element_text(
family = "bebas", color = col[2], size = 23,
margin = margin(t = 10)),
axis.text.y = element_text(
family = "jet", color = col[2], size = 15, vjust = 0),
panel.grid.major = element_line(
color = col[8], linewidth = .13, linetype = 1)
)
# figura
g <- g_arg +
inset_element(
p = g_sat,
left = .065, bottom = .093, right = .875, top = .8745) +
plot_annotation(
caption = mi_caption,
theme = theme(
plot.background = element_rect(
fill = col[10], color = col[8], linewidth = 3),
plot.caption = element_markdown(
family = "ubuntu", color = col[1],
margin = margin(t = -25, r = 10, b = 10), size = 11,
lineheight = unit(1.1, "line")
)
)
)
# guardo
ggsave(
plot = g,
filename = "2024/s17/viz.png",
width = 30,
height = 30.25,
units = "cm"
)
# abro
browseURL("2024/s17/viz.png")