# paquetes ----------------------------------------------------------------
library(glue)
library(ggtext)
library(showtext)
library(ggrepel)
library(patchwork)
library(tidyverse)
# fuente ------------------------------------------------------------------
# colores
c1 <- "#1A318B"
c2 <- "#6996E3"
c3 <- "#EAF3FF"
c4 <- "grey20"
c5 <- "#E9AB1B"
c6 <- "white"
# fuente: Ubuntu
font_add(
family = "ubuntu",
regular = "fuente/Ubuntu-Regular.ttf",
bold = "fuente/Ubuntu-Bold.ttf",
italic = "fuente/Ubuntu-Italic.ttf"
)
# monoespacio & íconos
font_add(
family = "jet",
regular = "fuente/JetBrainsMonoNLNerdFontMono-Regular.ttf"
)
# Bebas Neue
font_add(
family = "bebas",
regular = "fuente/BebasNeue-Regular.ttf"
)
showtext_auto()
showtext_opts(dpi = 300)
# caption
fuente <- glue(
"Datos: <span style='color:{c1};'><span style='font-family:jet;'>",
"{{<b>tidytuesdayR</b>}}</span> semana {52}<br>",
"Lai, S., Sorichetta, A., Steele, J. <i>et al</i>. **Global holiday datasets
for <br>understanding seasonal human mobility and population dynamics**.</span>"
)
autor <- glue("<span style='color:{c1};'>**Víctor Gauto**</span>")
icon_twitter <- glue("<span style='font-family:jet;'></span>")
icon_instagram <- glue("<span style='font-family:jet;'></span>")
icon_github <- glue("<span style='font-family:jet;'></span>")
icon_mastodon <- glue("<span style='font-family:jet;'>󰫑</span>")
icon_bsky <- glue("<span style='font-family:jet;'></span>")
usuario <- glue("<span style='color:{c1};'>**vhgauto**</span>")
sep <- glue("**|**")
mi_caption <- glue(
"{fuente}<br>{autor} {sep} {icon_github} {icon_twitter} {icon_instagram} ",
"{icon_mastodon} {icon_bsky} {usuario}"
)
# datos -------------------------------------------------------------------
tuesdata <- tidytuesdayR::tt_load(2024, 52)
global_holidays <- tuesdata$global_holidays
# me interesa la frecuencia de veces que cada día del año es feriado/celebración
d <- global_holidays |>
select(Date) |>
mutate(dia = day(Date)) |>
mutate(mes = month(Date)) |>
mutate(año = year(Date)) |>
reframe(
n = n(),
.by = c(mes, dia, año)
) |>
arrange(mes, dia, año) |>
mutate(fecha = make_date(year = 2016, month = mes, day = dia)) |>
mutate(prop = n/length(unique(global_holidays$ADM_name))) |>
reframe(
prop = mean(prop),
.by = fecha
)
# día más frecuente de cada mes
top_mes <- d |>
mutate(mes = month(fecha)) |>
slice_max(order_by = prop, n = 1, by = mes)
label_tbl <- inner_join(
global_holidays, top_mes, by = join_by(Date == fecha)
) |>
distinct(Date, Name) |>
arrange(Date) |>
distinct(Date, .keep_all = TRUE) |>
rename("fecha" = Date) |>
inner_join(d, by = join_by(fecha))
# combino todos los días con las celebraciones más frecuentes del mes
d2 <- full_join(d, label_tbl, by = join_by(fecha, prop))
# todas las fechas
fecha <- tibble(
dia_fecha = seq.Date(
from = ymd(20160101), to = ymd(20161231), by = "1 day"
)
)
# vector de factores de los meses
mes_orden <- tibble(
mes = seq.Date(from = ymd(20160101), to = ymd(20161231), by = "1 month")) |>
mutate(mes_n = format(mes, "%B")) |>
mutate(mes_n = toupper(mes_n)) |>
mutate(mes_n = fct_inorder(mes_n)) |>
pull(mes_n)
# tibble calendario
calendar_df <- fecha |>
mutate(
año = year(dia_fecha),
mes = format(dia_fecha, "%B"),
# inicio de semana el DOMINGO
dia = wday(dia_fecha, label = TRUE, week_start = 7),
mday = mday(dia_fecha),
# agrego el número de semana, dentro del mes
mes_semana = (5 + day(dia_fecha) +
wday(
floor_date(dia_fecha, 'month'), week_start = 7
)) %/% 7
) |>
mutate(mes = toupper(mes)) |>
mutate(mes = fct_inorder(mes)) |>
inner_join(d2, by = join_by(dia_fecha == fecha))
# celebraciones más frecuentes de cada mes y traducciones
celeb <- calendar_df |>
distinct(Name) |>
drop_na() |>
pull() |>
sort()
celeb_trad <- c(
"Día de Todos los Santos", "Asunción de María", "Día del Niño", "Navidad",
"Viernes Santo", "Halloween", "Día del Empleado Bancario",
"Día Internacional de la Mujer", "Día Internacional de los Trabajadores",
"Año Nuevo", "Eid al-Adha", "Día de los Enamorados"
)
celeb_trad <- set_names(celeb_trad, celeb)
calendar_df <- calendar_df |>
mutate(nombre = celeb_trad[Name])
# nombres de los días de la semana
dia_semana <- tibble(
label = c("D", "L", "M", "M", "J", "V", "S"),
x = 1:7,
y = 1
)
# blanco
b <- tibble(x = 0, y = c(0, 7))
feriados <- drop_na(calendar_df)
# figura ------------------------------------------------------------------
# cantidad de países y subtítulo
n_pais <- length(unique(global_holidays$ISO3))
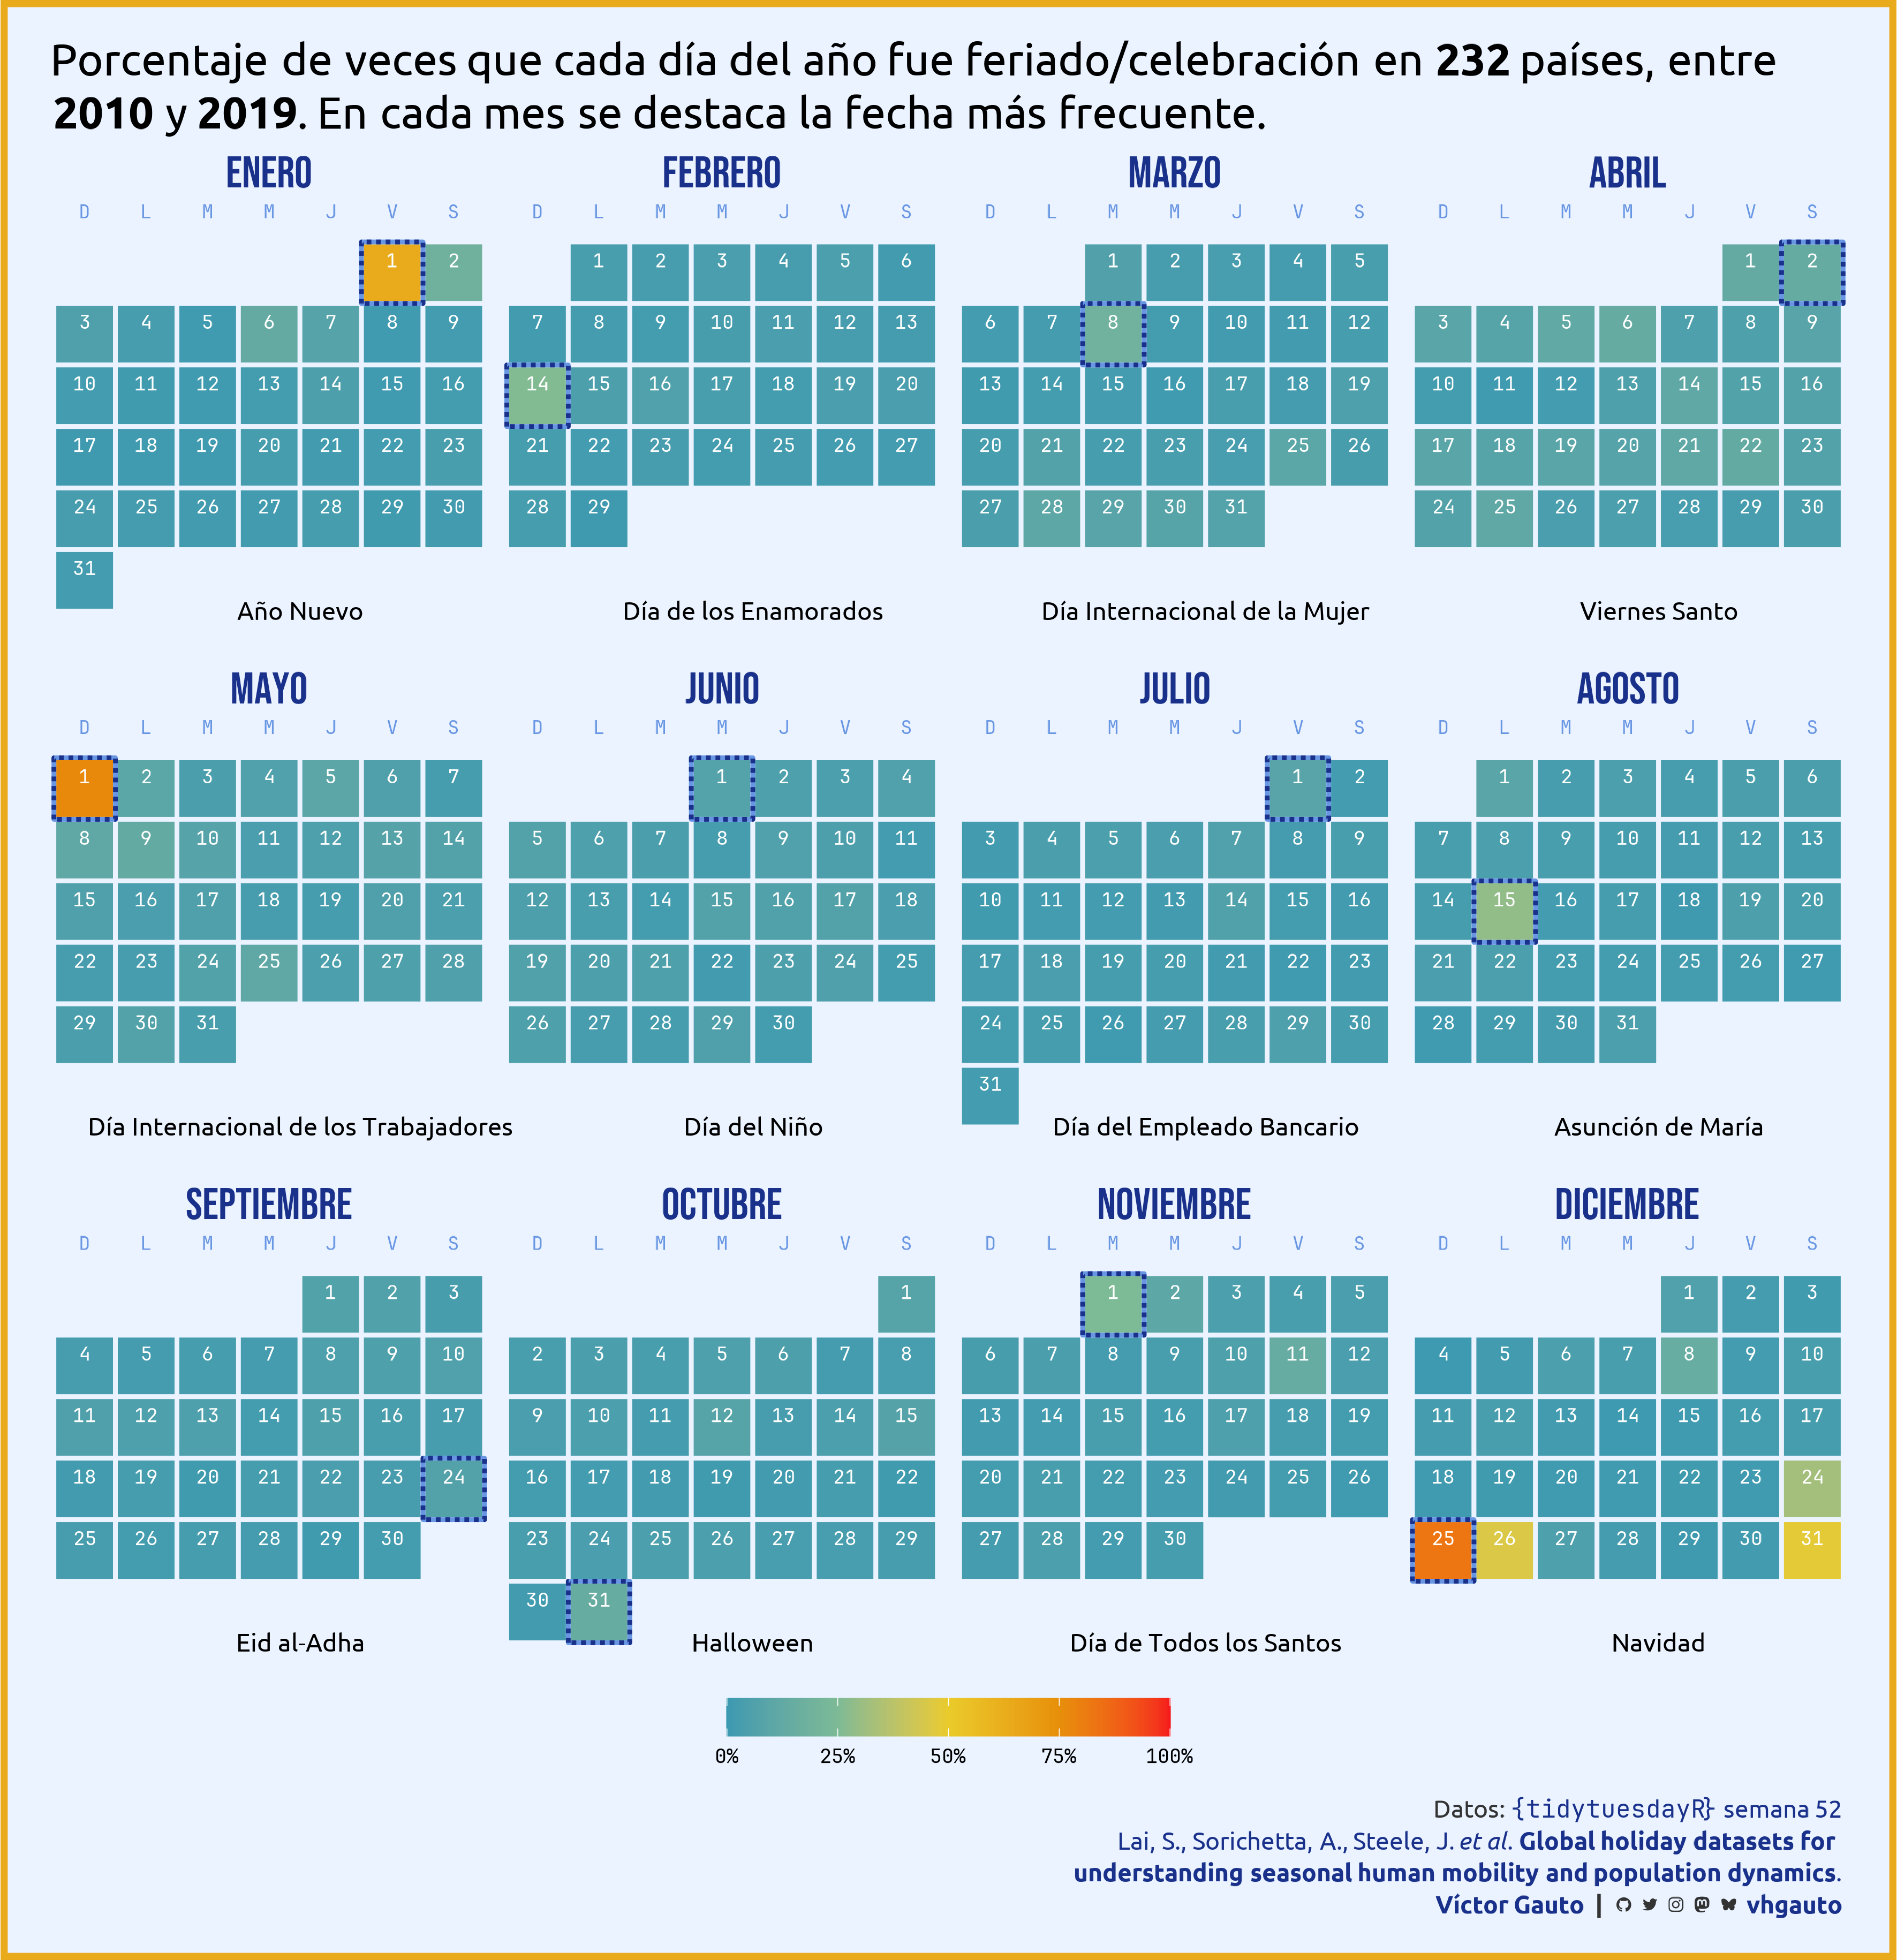
mi_subtitulo <- glue(
"Porcentaje de veces que cada día del año fue feriado/celebración en
**{n_pais}** países, entre **2010** y **2019**. En cada mes se destaca la
fecha más frecuente."
)
# función p/generar el calendario de c/mes
f_cumple <- function(x) {
n <- calendar_df |>
filter(mes == x) |>
nrow()
m <- calendar_df |>
filter(mes == x) |>
filter(Name != "") |>
pull(Name)
u <- calendar_df |>
filter(mes == x) |>
summarise(semana_max = max(mes_semana)) |>
pull()
fer <- calendar_df |>
filter(mes == x) |>
slice_max(order_by = prop, n = 1)
g <- calendar_df |>
filter(mes == x) |>
ggplot(aes(x = dia, y = mes_semana, fill = prop)) +
# límites verticales
geom_blank(aes(y = 0)) +
geom_blank(aes(y = 7)) +
# coloreo los cumpleaños
geom_tile(colour = c3, linewidth = 1, show.legend = TRUE) +
# agrego los días del mes
geom_text(
aes(label = mday), family = "jet", hjust = .5, nudge_y = .2, size = 3,
color = c6
) +
# día de la semana
geom_text(
data = dia_semana, aes(x, y, label = label), inherit.aes = FALSE,
nudge_y = 1, family = "jet", color = c2, size = 3
) +
# celebraciones/feriados
geom_text(
data = fer, aes(label = nombre, x = 4.5, y = 6.5), hjust = .5, size = 4,
family = "ubuntu", fontface = "plain"
) +
geom_tile(data = fer, color = c2, fill = NA, linewidth = 1) +
geom_tile(data = fer, color = c1, fill = NA, linewidth = 1, linetype = "11") +
# manual
scale_y_continuous(trans = "reverse") +
scale_fill_gradientn(
colors = hcl.colors(5, "Zissou1"),
limits = c(0, 1),
labels = scales::label_percent()
) +
# faceta
facet_grid(año ~ mes, switch = "y") +
# eje
labs(fill = NULL) +
coord_fixed(clip = "off", expand = FALSE) +
theme_void() +
theme(
plot.margin = margin(8, 5, 5, 5),
plot.background = element_rect(fill = NA, color = NA),
strip.text.x.top = element_text(
family = "bebas", color = c1, face = "bold", size = 20,
margin = margin(b = 10)
),
strip.text.y.left = element_blank(),
legend.position = "bottom",
legend.direction = "horizontal",
legend.key.width = unit(40, "pt"),
legend.text = element_text(family = "jet")
)
}
# lista de figuras
lista_mes <- map(.x = mes_orden, ~ f_cumple(x = .x))
g_cumple <- wrap_plots(lista_mes, ncol = 4) +
plot_layout(guides = "collect") +
plot_annotation(
subtitle = mi_subtitulo,
caption = mi_caption,
theme = theme(
plot.margin = margin(20, 19, 19, 19),
plot.background = element_rect(
fill = c3, color = c5, linewidth = 3
),
plot.subtitle = element_textbox_simple(
hjust = .5, size = 20, family = "ubuntu"
),
plot.caption = element_markdown(
family = "ubuntu", size = 11, color = c4, hjust = 1, lineheight = 1.3,
margin = margin(t = 10)
),
legend.position = "bottom"
)
)
# guardo
ggsave(
plot = g_cumple,
filename = "2024/s52/viz.png",
width = 30,
height = 31,
units = "cm",
dpi = 300
)
# abro
browseURL(paste0(getwd(), "/2024/s52/viz.png"))