# paquetes ----------------------------------------------------------------
library(glue)
library(ggtext)
library(showtext)
library(tidyverse)
# fuente ------------------------------------------------------------------
# colores
c1 <- "grey10"
c2 <- "grey30"
c3 <- "grey70"
c4 <- "grey90"
c5 <- "#96410D"
c6 <- "#2B614E"
# fuente: Ubuntu
font_add(
family = "ubuntu",
regular = "fuente/Ubuntu-Regular.ttf",
bold = "fuente/Ubuntu-Bold.ttf",
italic = "fuente/Ubuntu-Italic.ttf")
# fuente: Bebas Neue
font_add(
family = "bebas",
regular = "fuente/BebasNeue-Regular.ttf")
# monoespacio & íconos
font_add(
family = "jet",
regular = "fuente/JetBrainsMonoNLNerdFontMono-Regular.ttf")
showtext_auto()
showtext_opts(dpi = 300)
# caption
fuente <- glue(
"Datos: <span style='color:{c5};'><span style='font-family:mono;'>",
"{{<b>tidytuesdayR</b>}}</span> semana {18}. ",
"Worldwide Bureaucracy Indicators, <b>World Bank</b>.</span>")
autor <- glue("<span style='color:{c5};'>**Víctor Gauto**</span>")
icon_twitter <- glue("<span style='font-family:jet;'></span>")
icon_instagram <- glue("<span style='font-family:jet;'></span>")
icon_github <- glue("<span style='font-family:jet;'></span>")
icon_mastodon <- glue("<span style='font-family:jet;'>󰫑</span>")
usuario <- glue("<span style='color:{c5};'>**vhgauto**</span>")
sep <- glue("**|**")
mi_caption <- glue(
"{fuente}<br>{autor} {sep} {icon_github} {icon_twitter} {icon_instagram} ",
"{icon_mastodon} {usuario}")
# datos -------------------------------------------------------------------
tuesdata <- tidytuesdayR::tt_load(2024, 18)
wwbi_data <- tuesdata$wwbi_data
wwbi_series <- tuesdata$wwbi_series
# me interesan las edades de empleados públicos y privados, en educación y
# salud en Argentina
# agrego las descripciones de los códigos de los indicadores y filtro por
# Argentina
d_arg <- wwbi_data |>
filter(country_code == "ARG") |>
inner_join(
wwbi_series,
by = join_by(indicator_code)
) |>
select(año = year, valor = value, indicador = indicator_name)
# edad de empleados públicos y privados
edad_publicos <- "Mean age of public paid employees, by"
edad_privados <- "Mean age of private paid employees, by"
# profesiones
profesiones <- c("Education|Health")
# filtro por empleados públicos y privados, y por las profesiones
d <- d_arg |>
filter(str_detect(indicador, glue("{edad_privados}|{edad_publicos}"))) |>
filter(str_detect(indicador, profesiones)) |>
mutate(sector = if_else(
str_detect(indicador, "private"),
"privado",
"público"
)) |>
mutate(prof = str_replace(indicador, ".*\: (.*)", "\1")) |>
select(-indicador) |>
mutate(
prof = if_else(
prof == "Education",
"Educación",
"Salud"
)
)
# figura ------------------------------------------------------------------
# íconos para empleados públicos y privados
icon_triangulo <- glue("<b style='font-family:jet; color:{c5};'>󰔷</b>")
icon_circulo <- glue("<b style='font-family:jet; color:{c6};'></b>")
# subtítulo
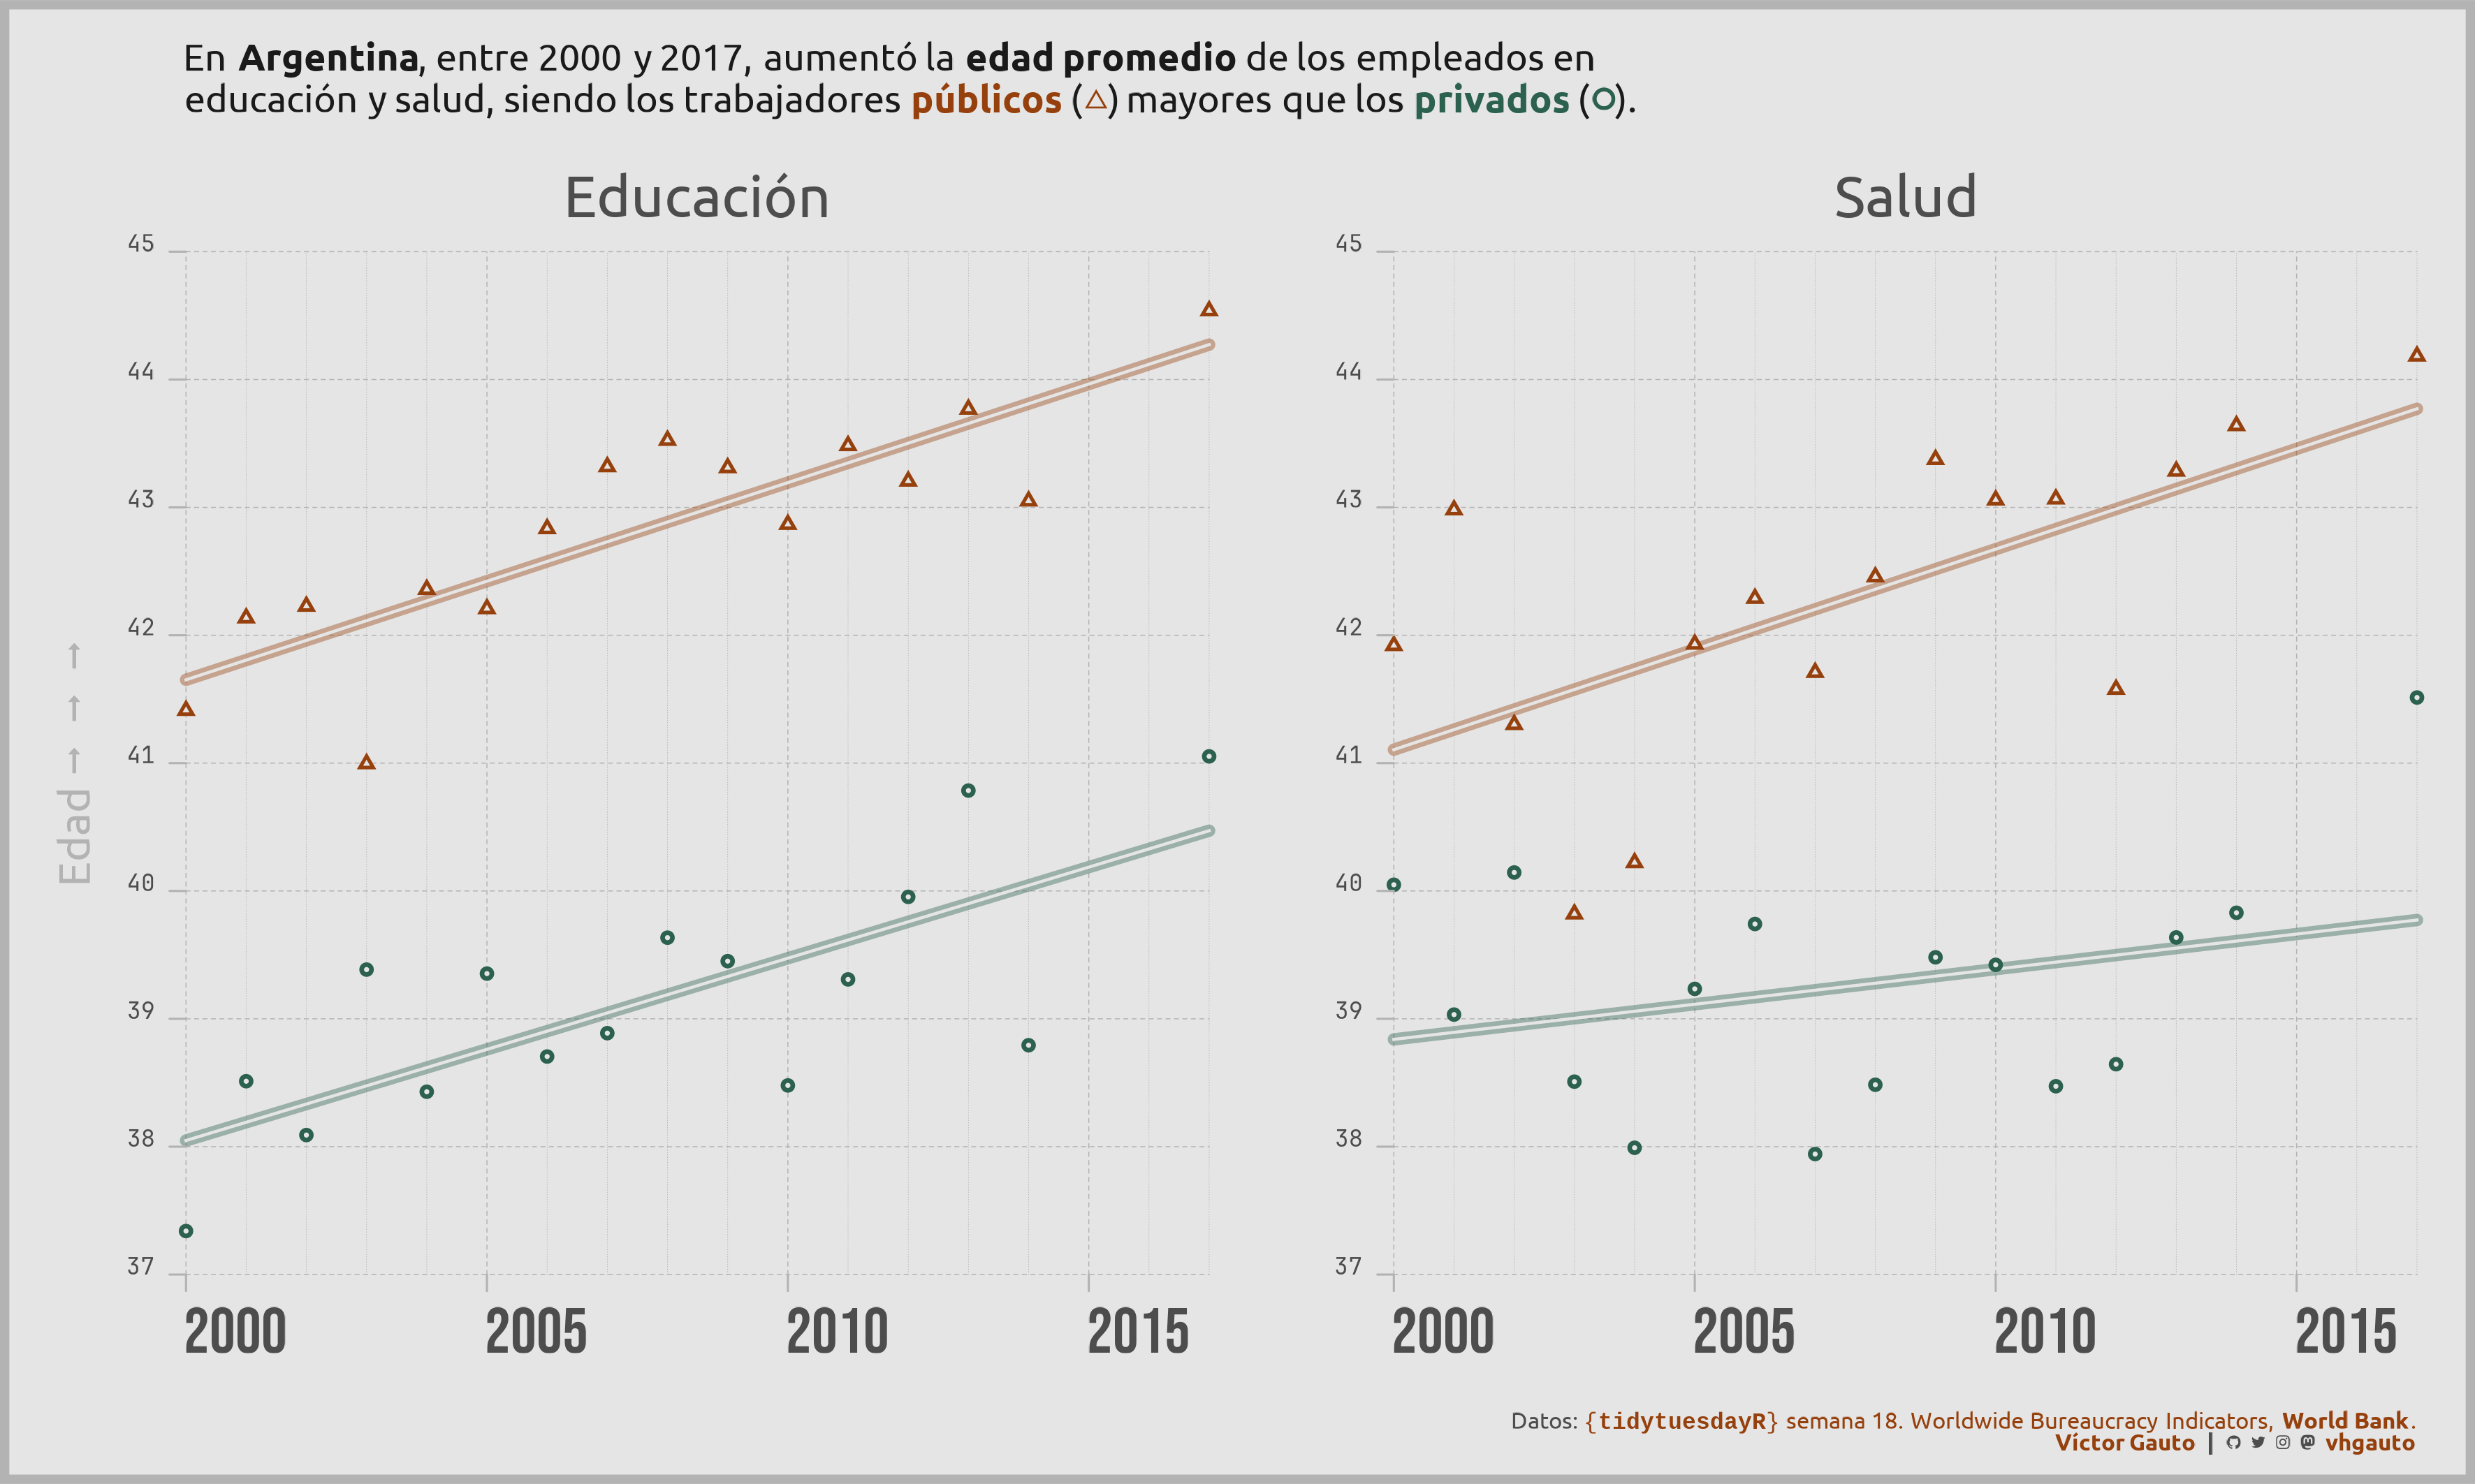
mi_subtitle <- glue(
"En <b>Argentina</b>, entre {min(d$año)} y {max(d$año)}, aumentó la <b>edad ",
"promedio</b> de los empleados en<br>",
"educación y salud, siendo los trabajadores ",
"<b style='color:{c5};'>públicos</b> ({icon_triangulo}) mayores que los ",
"<b style='color:{c6};'>privados</b> ({icon_circulo})."
)
# título eje vertical
eje_y <- "Edad <b style='font-family:jet;'>  </b>"
# figura
g <- ggplot(d, aes(año, valor, shape = sector, color = sector)) +
# tendencias
geom_line(
stat = "smooth", method = lm, formula = y ~ x, linewidth = 2,
lineend = "round", alpha = .4) +
geom_line(
stat = "smooth", method = lm, formula = y ~ x, linewidth = .5,
lineend = "square", color = c4) +
# puntos
geom_point(size = 2, alpha = 1) +
geom_point(size = .5, alpha = 1, color = c4) +
facet_wrap(vars(prof), nrow = 1, scales = "free") +
scale_x_continuous(
limits = c(2000, 2017), expand = c(0, 0), breaks = scales::breaks_width(5),
minor_breaks = 2000:2017) +
scale_y_continuous(
limits = c(37, 45), expand = c(0, 0), breaks = scales::breaks_width(1)) +
scale_color_manual(
values = c(c6, c5)) +
coord_cartesian(clip = "off") +
labs(x = NULL, y = eje_y, subtitle = mi_subtitle, caption = mi_caption) +
theme_void() +
theme(
aspect.ratio = 1,
plot.margin = margin(l = 20, r = 20, b = 10, t = 15.3),
plot.background = element_rect(fill = c4, linewidth = 3, color = c3),
plot.subtitle = element_markdown(
color = c1, family = "ubuntu", size = 13, lineheight = unit(1.1, "line"),
margin = margin(b = 18)),
plot.caption = element_markdown(
size = 8, color = c2, family = "ubuntu", margin = margin(t = 20)),
panel.grid.major = element_line(color = c3, linetype = 2, linewidth = .17),
panel.grid.minor.x = element_line(color = c3, linetype = 3, linewidth = .1),
panel.spacing.x = unit(3, "line"),
axis.ticks = element_line(color = c3),
axis.ticks.length = unit(2, "mm"),
axis.text.x = element_text(
family = "bebas", color = c2, size = 22, hjust = 0,
margin = margin(t = 5)),
axis.text.y = element_text(
family = "jet", color = c2, vjust = 0, margin = margin(r = 5),
size = 8),
axis.title.y = element_markdown(
color = c3, family = "ubuntu", size = 15, angle = 90,
margin = margin(r = 10)),
strip.text = element_text(
family = "ubuntu", color = c2, size = 20, margin = margin(b = 10)),
legend.position = "none"
)
# guardo
ggsave(
plot = g,
filename = "2024/s18/viz.png",
width = 30,
height = 18,
units = "cm")
# abro
browseURL("2024/s18/viz.png")