Ocultar código
library(glue)
library(ggtext)
library(showtext)
library(tidyverse)Fabricantes de vehículos, precios y tipo de motor del conjunto de datos qatarcars.
library(glue)
library(ggtext)
library(showtext)
library(tidyverse)Colores.
c1 <- "#b48ead"
c2 <- "#a3be8c"
c3 <- "#ebcb8b"
c4 <- "#8A1538"
c5 <- "ivory"
Fuentes: Ubuntu y JetBrains Mono.
font_add(
  family = "ubuntu",
  regular = "././fuente/Ubuntu-Regular.ttf",
  bold = "././fuente/Ubuntu-Bold.ttf",
  italic = "././fuente/Ubuntu-Italic.ttf"
)

font_add(
  family = "jet",
  regular = "././fuente/JetBrainsMonoNLNerdFontMono-Regular.ttf"
)

showtext_auto()
showtext_opts(dpi = 300)fuente <- glue(
"Datos: <span style='color:{c4};'><span style='font-family:jet;'>",
"{{<b>tidytuesdayR</b>}}</span> semana 49, ",
"<b>{{qatarcars}}</b>.</span>"
)
autor <- glue("<span style='color:{c4};'>**Víctor Gauto**</span>")
icon_twitter <- glue("<span style='font-family:jet;'></span>")
icon_instagram <- glue("<span style='font-family:jet;'></span>")
icon_github <- glue("<span style='font-family:jet;'></span>")
icon_mastodon <- glue("<span style='font-family:jet;'>󰫑</span>")
icon_bsky <- glue("<span style='font-family:jet;'></span>")
usuario <- glue("<span style='color:{c4};'>**vhgauto**</span>")
sep <- glue("**|**")
mi_caption <- glue(
"{fuente}<br>{autor} {sep} {icon_github} {icon_twitter} {icon_instagram} ",
"{icon_mastodon} {icon_bsky} {usuario}"
)tuesdata <- tidytuesdayR::tt_load(2025, 49)
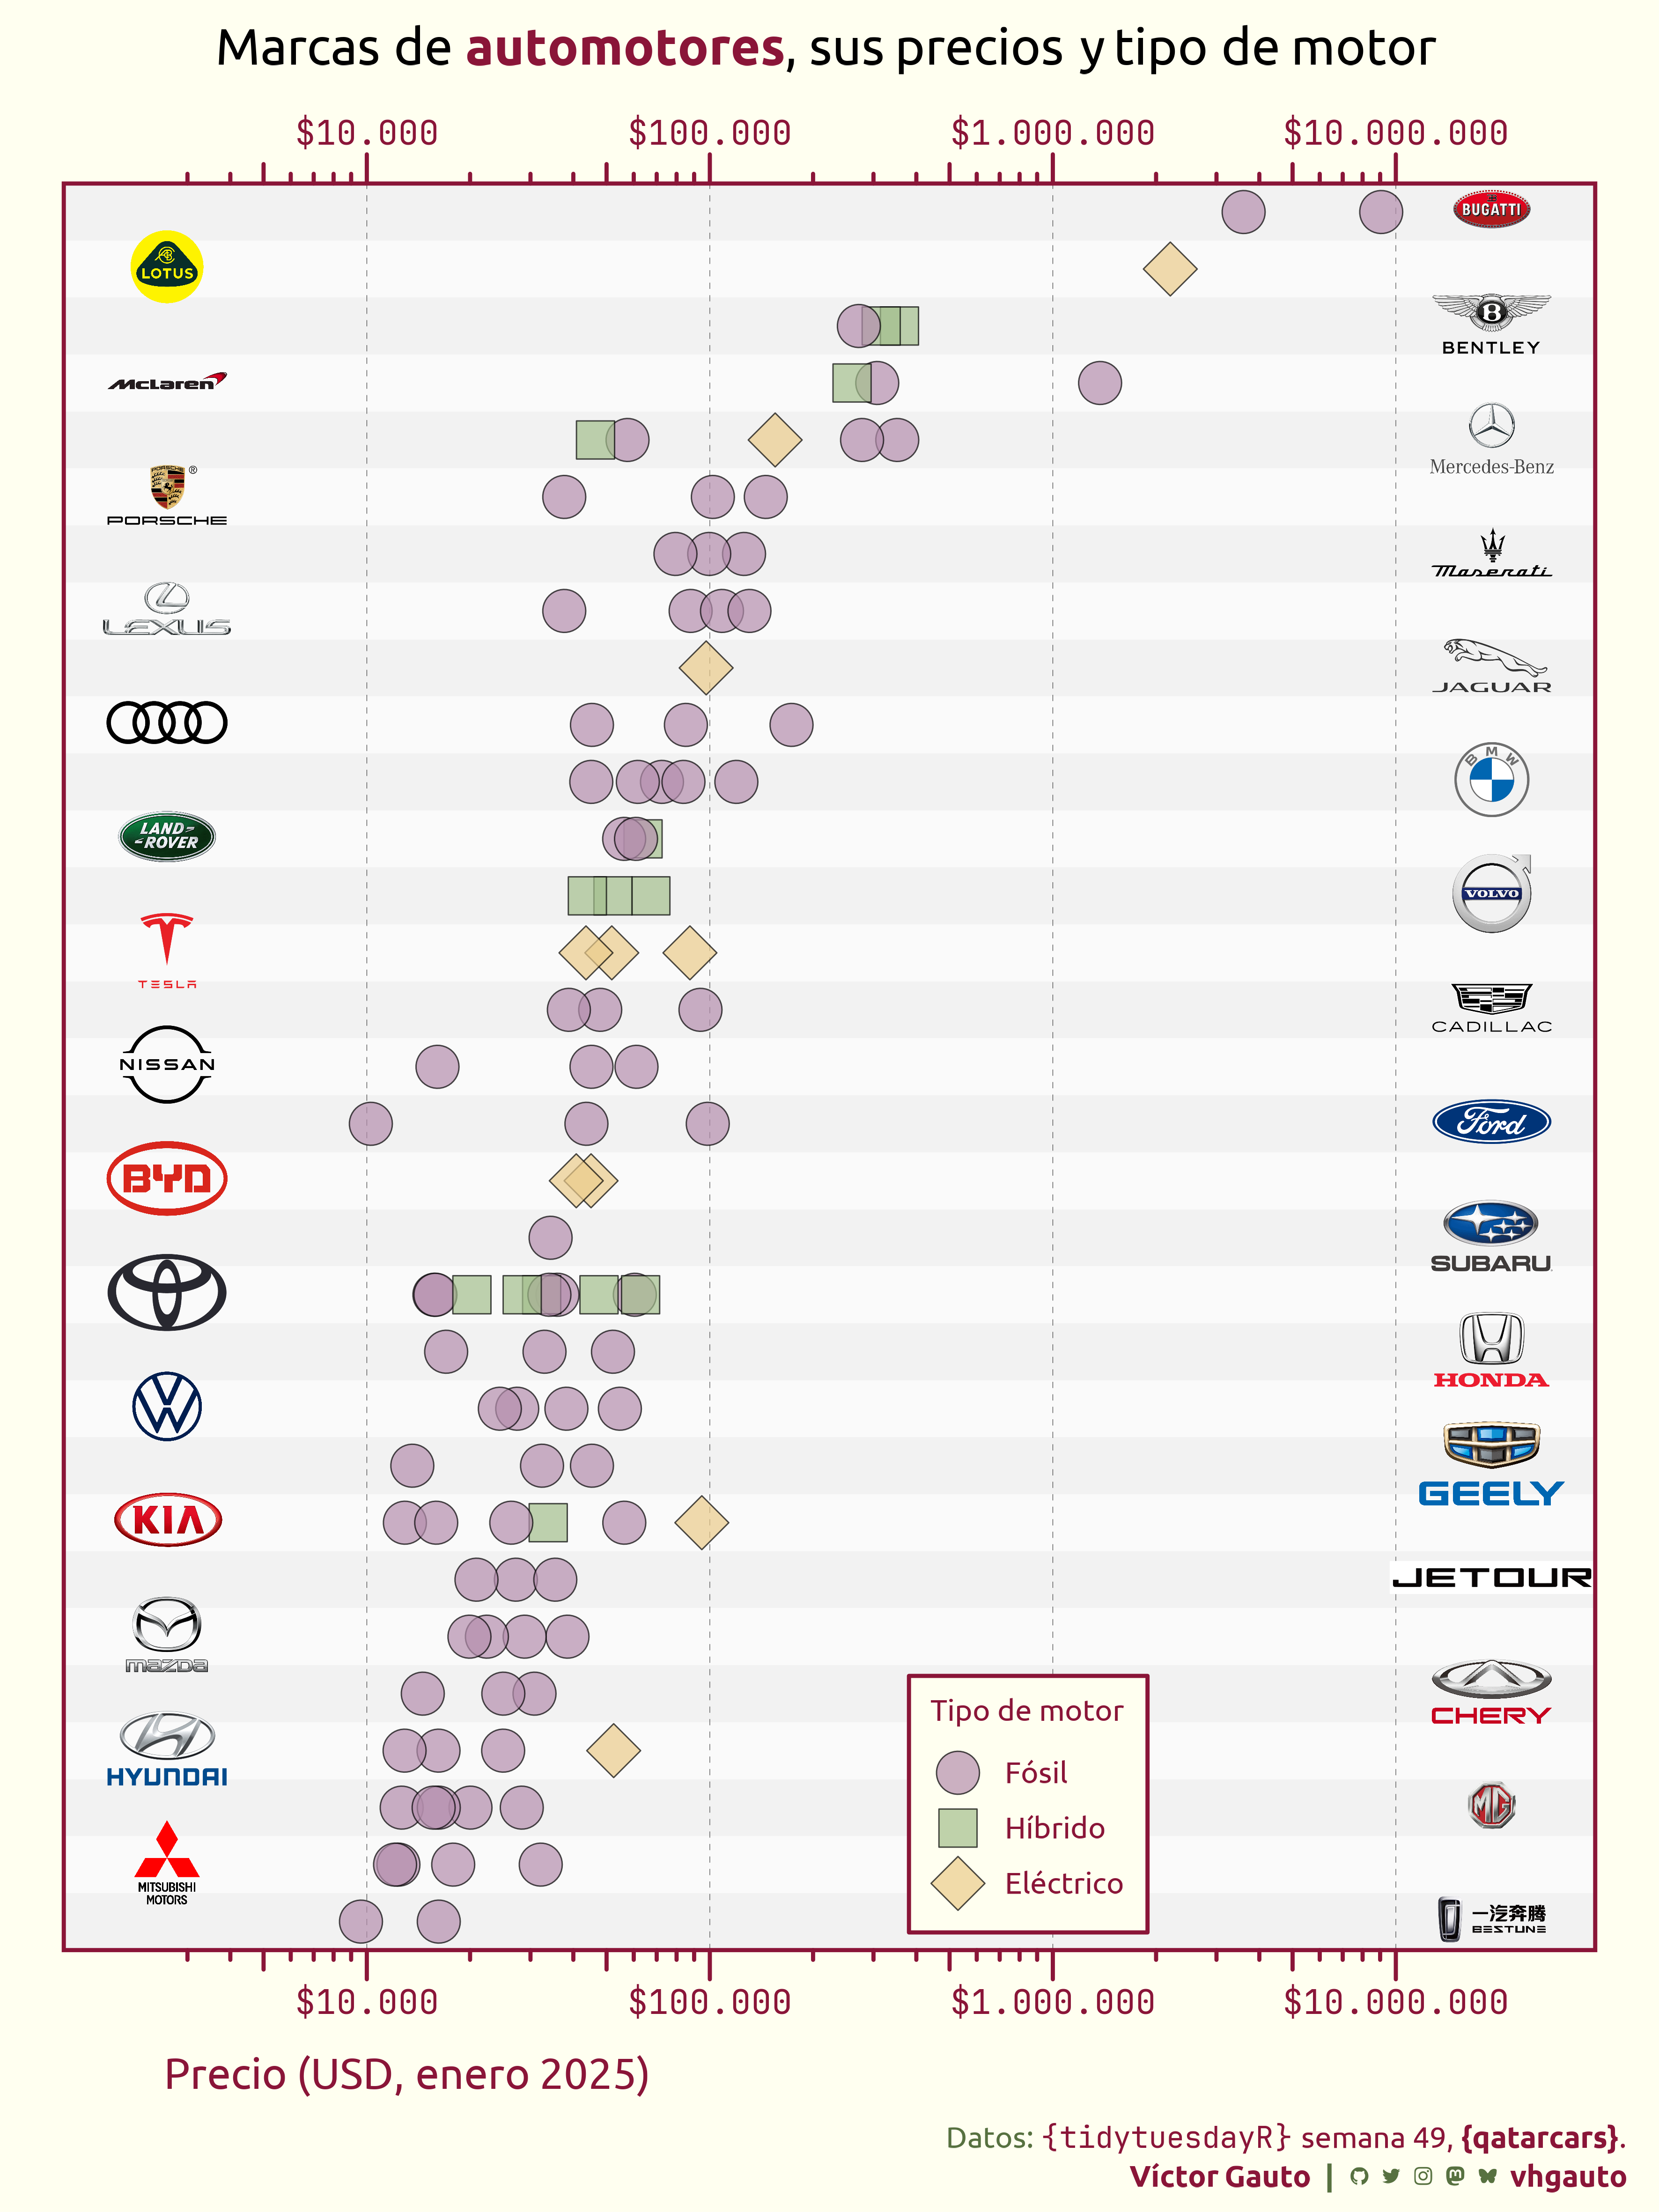
qatarcars <- tuesdata$qatarcarsMe interesa el precio de los vehículos y el tipo de motor, mostrando el logo de cada marca.
Convierto a factor las marcas de acuerdo al precio y agrego colores según tipo de motor. El precio lo convierto de riyal catarí (\(QAR\)) a dólar estadounidense (\(USD\)).
d <- mutate(qatarcars, make = fct_reorder(make, price)) |>
  arrange(make) |>
  mutate(enginetype = fct_infreq(enginetype))

colores_tipos <- c(c1, c2, c3)
names(colores_tipos) <- sort(unique(d$enginetype))

d <- d |>
  mutate(fill = colores_tipos[enginetype]) |>
mutate(price = price / 3.64)Defino los límites del panel e incorporo los logos de los vehículos, obtenidos de este repositorio. Acomodo las posiciones tal que los logos estén intercalados. En particular, disminuyo el tamaña del logo de un fabricante.
link <- "https://raw.githubusercontent.com/filippofilip95/car-logos-dataset/master/logos/optimized/"

x_min <- min(d$price) - 7000
x_max <- max(d$price) + 10000000

d_img <- distinct(d, make) |>
  mutate(make_label = tolower(make)) |>
  mutate(make_label = gsub(" ", "-", make_label)) |>
  mutate(
    make_label = if_else(make_label == "mercedes", "mercedes-benz", make_label)
  ) |>
  mutate(img = paste0(link, make_label, ".png")) |>
  mutate(id = row_number()) |>
  mutate(
    x = if_else(id %% 2 == 0, x_min, x_max)
  ) |>
  mutate(
    img_label = glue("<img src='{img}' height=45></img>"),
    hjust = if_else(id %% 2 == 0, 0, 1)
  ) |>
  mutate(
    img_label = if_else(
      make_label == "jetour",
      str_replace(img_label, "height=45", "height=17"),
      img_label
    )
  )
Defino un recuadro en el que se va a intercalar el color de relleno para facilitar la lectura de la figura.
d_rect <- distinct(d, make) |>
  mutate(y_min = as.numeric(make) - .5) |>
  mutate(y_max = y_min + 1) |>
  mutate(id = row_number()) |>
  mutate(
    fill = if_else(id %% 2 == 0, "grey98", "grey95")
  )
Título y figura.
mi_titulo <- glue(
  "Marcas de <b style='color: {c4};'>automotores</b>,
  sus precios y tipo de motor"
)

g <- ggplot(d, aes(price, make, fill = fill, shape = enginetype)) +
  geom_rect(
    data = d_rect,
    aes(
      xmin = x_min * .5,
      xmax = x_max * 2,
      ymin = y_min,
      ymax = y_max,
      fill = fill
    ),
    color = NA,
    inherit.aes = FALSE
  ) +
  geom_vline(xintercept = 10^(4:7), linewidth = .1, linetype = "FF") +
  geom_point(size = 10, color = "black", stroke = .5, alpha = .7) +
  geom_richtext(
    data = d_img,
    aes(x = x, y = make, label = img_label, hjust = .5),
    fill = NA,
    label.color = NA,
    inherit.aes = FALSE
  ) +
  annotate(
    geom = "rect",
    xmin = x_min * .5,
    xmax = x_max * 2,
    ymin = .5,
    ymax = 31.5,
    fill = NA,
    color = c4,
    linewidth = 1
  ) +
  annotation_logticks(
    sides = "tb",
    outside = TRUE,
    short = unit(5, "pt"),
    mid = unit(10, "pt"),
    long = unit(15, "pt"),
    color = c4,
    linewidth = 1
  ) +
  scale_x_log10(
    labels = scales::label_dollar(big.mark = ".", decimal.mark = ","),
    sec.axis = dup_axis(name = NULL)
  ) +
  scale_fill_identity() +
  scale_shape_manual(
    values = c(21, 22, 23),
    breaks = names(colores_tipos),
    labels = c("Fósil", "Híbrido", "Eléctrico")
  ) +
  coord_cartesian(expand = FALSE, clip = "off", xlim = c(x_min, x_max)) +
  labs(
    x = "Precio (USD, enero 2025)",
    y = NULL,
    shape = "Tipo de motor",
    title = mi_titulo,
    caption = mi_caption
  ) +
  guides(
    shape = guide_legend(
      override.aes = list(color = "black", fill = colores_tipos)
    )
  ) +
  theme_bw(base_size = 22, base_family = "ubuntu") +
  theme(aspect.ratio = 4 / 3) +
  theme_sub_axis_bottom(
    text = element_text(
      family = "jet",
      color = c4,
      margin = margin(t = 20)
    ),
    title = element_markdown(margin = margin(t = 20), color = c4, hjust = 0),
    ticks = element_blank()
  ) +
  theme_sub_axis_top(
    text = element_text(
      family = "jet",
      color = c4,
      margin = margin(b = 20)
    ),
    title = element_text(margin = margin(b = 10), color = c4),
    ticks = element_blank()
  ) +
  theme_sub_axis_y(text = element_blank(), ticks = element_blank()) +
  theme_sub_legend(
    position = "inside",
    background = element_rect(fill = "ivory", color = c4),
    position.inside = c(.65, .01),
    justification.inside = c(.5, 0),
    text = element_text(color = c4, size = rel(.7)),
    title = element_text(color = c4, size = rel(.7))
  ) +
  theme_sub_plot(
    margin = margin(r = 40, l = 40, b = 10, t = 15),
    title = element_markdown(hjust = .5, margin = margin(b = 20)),
    caption = element_markdown(
      color = scales::col_darker(c2, 30),
      lineheight = 1.3,
      size = rel(.7),
      margin = margin(t = 15, r = -70)
    ),
    background = element_rect(fill = c5, color = NA)
  ) +
  theme_sub_panel(
    background = element_blank(),
    border = element_blank()
  )
Guardo.
ggsave(
  plot = g,
  filename = "tidytuesday/2025/semana_49.png",
  width = 30,
  height = 40,
  units = "cm"
)