Ocultar código
library(glue)
library(ggtext)
library(showtext)
library(tidyverse)Duración de la quema del Böögg en el festival Sechseläuten.
library(glue)
library(ggtext)
library(showtext)
library(tidyverse)Colores.
c1 <- "#da3500"
c2 <- "#004b73"
c3 <- "white"
Fuentes: Ubuntu y JetBrains Mono.
font_add(
  family = "ubuntu",
  regular = "././fuente/Ubuntu-Regular.ttf",
  bold = "././fuente/Ubuntu-Bold.ttf",
  italic = "././fuente/Ubuntu-Italic.ttf"
)

font_add(
  family = "jet",
  regular = "././fuente/JetBrainsMonoNLNerdFontMono-Regular.ttf"
)

showtext_auto()
showtext_opts(dpi = 300)fuente <- glue(
"Datos: <span style='color:{c2};'><span style='font-family:jet;'>",
"{{<b>tidytuesdayR</b>}}</span> semana 48, ",
"<b>Zurich's \"Sechselaeuten\" spring festival</b>.</span>"
)
autor <- glue("<span style='color:{c2};'>**Víctor Gauto**</span>")
icon_twitter <- glue("<span style='font-family:jet;'></span>")
icon_instagram <- glue("<span style='font-family:jet;'></span>")
icon_github <- glue("<span style='font-family:jet;'></span>")
icon_mastodon <- glue("<span style='font-family:jet;'>󰫑</span>")
icon_bsky <- glue("<span style='font-family:jet;'></span>")
usuario <- glue("<span style='color:{c2};'>**vhgauto**</span>")
sep <- glue("**|**")
mi_caption <- glue(
"{fuente}<br>{autor} {sep} {icon_github} {icon_twitter} {icon_instagram} ",
"{icon_mastodon} {icon_bsky} {usuario}"
)tuesdata <- tidytuesdayR::tt_load(2025, 48)
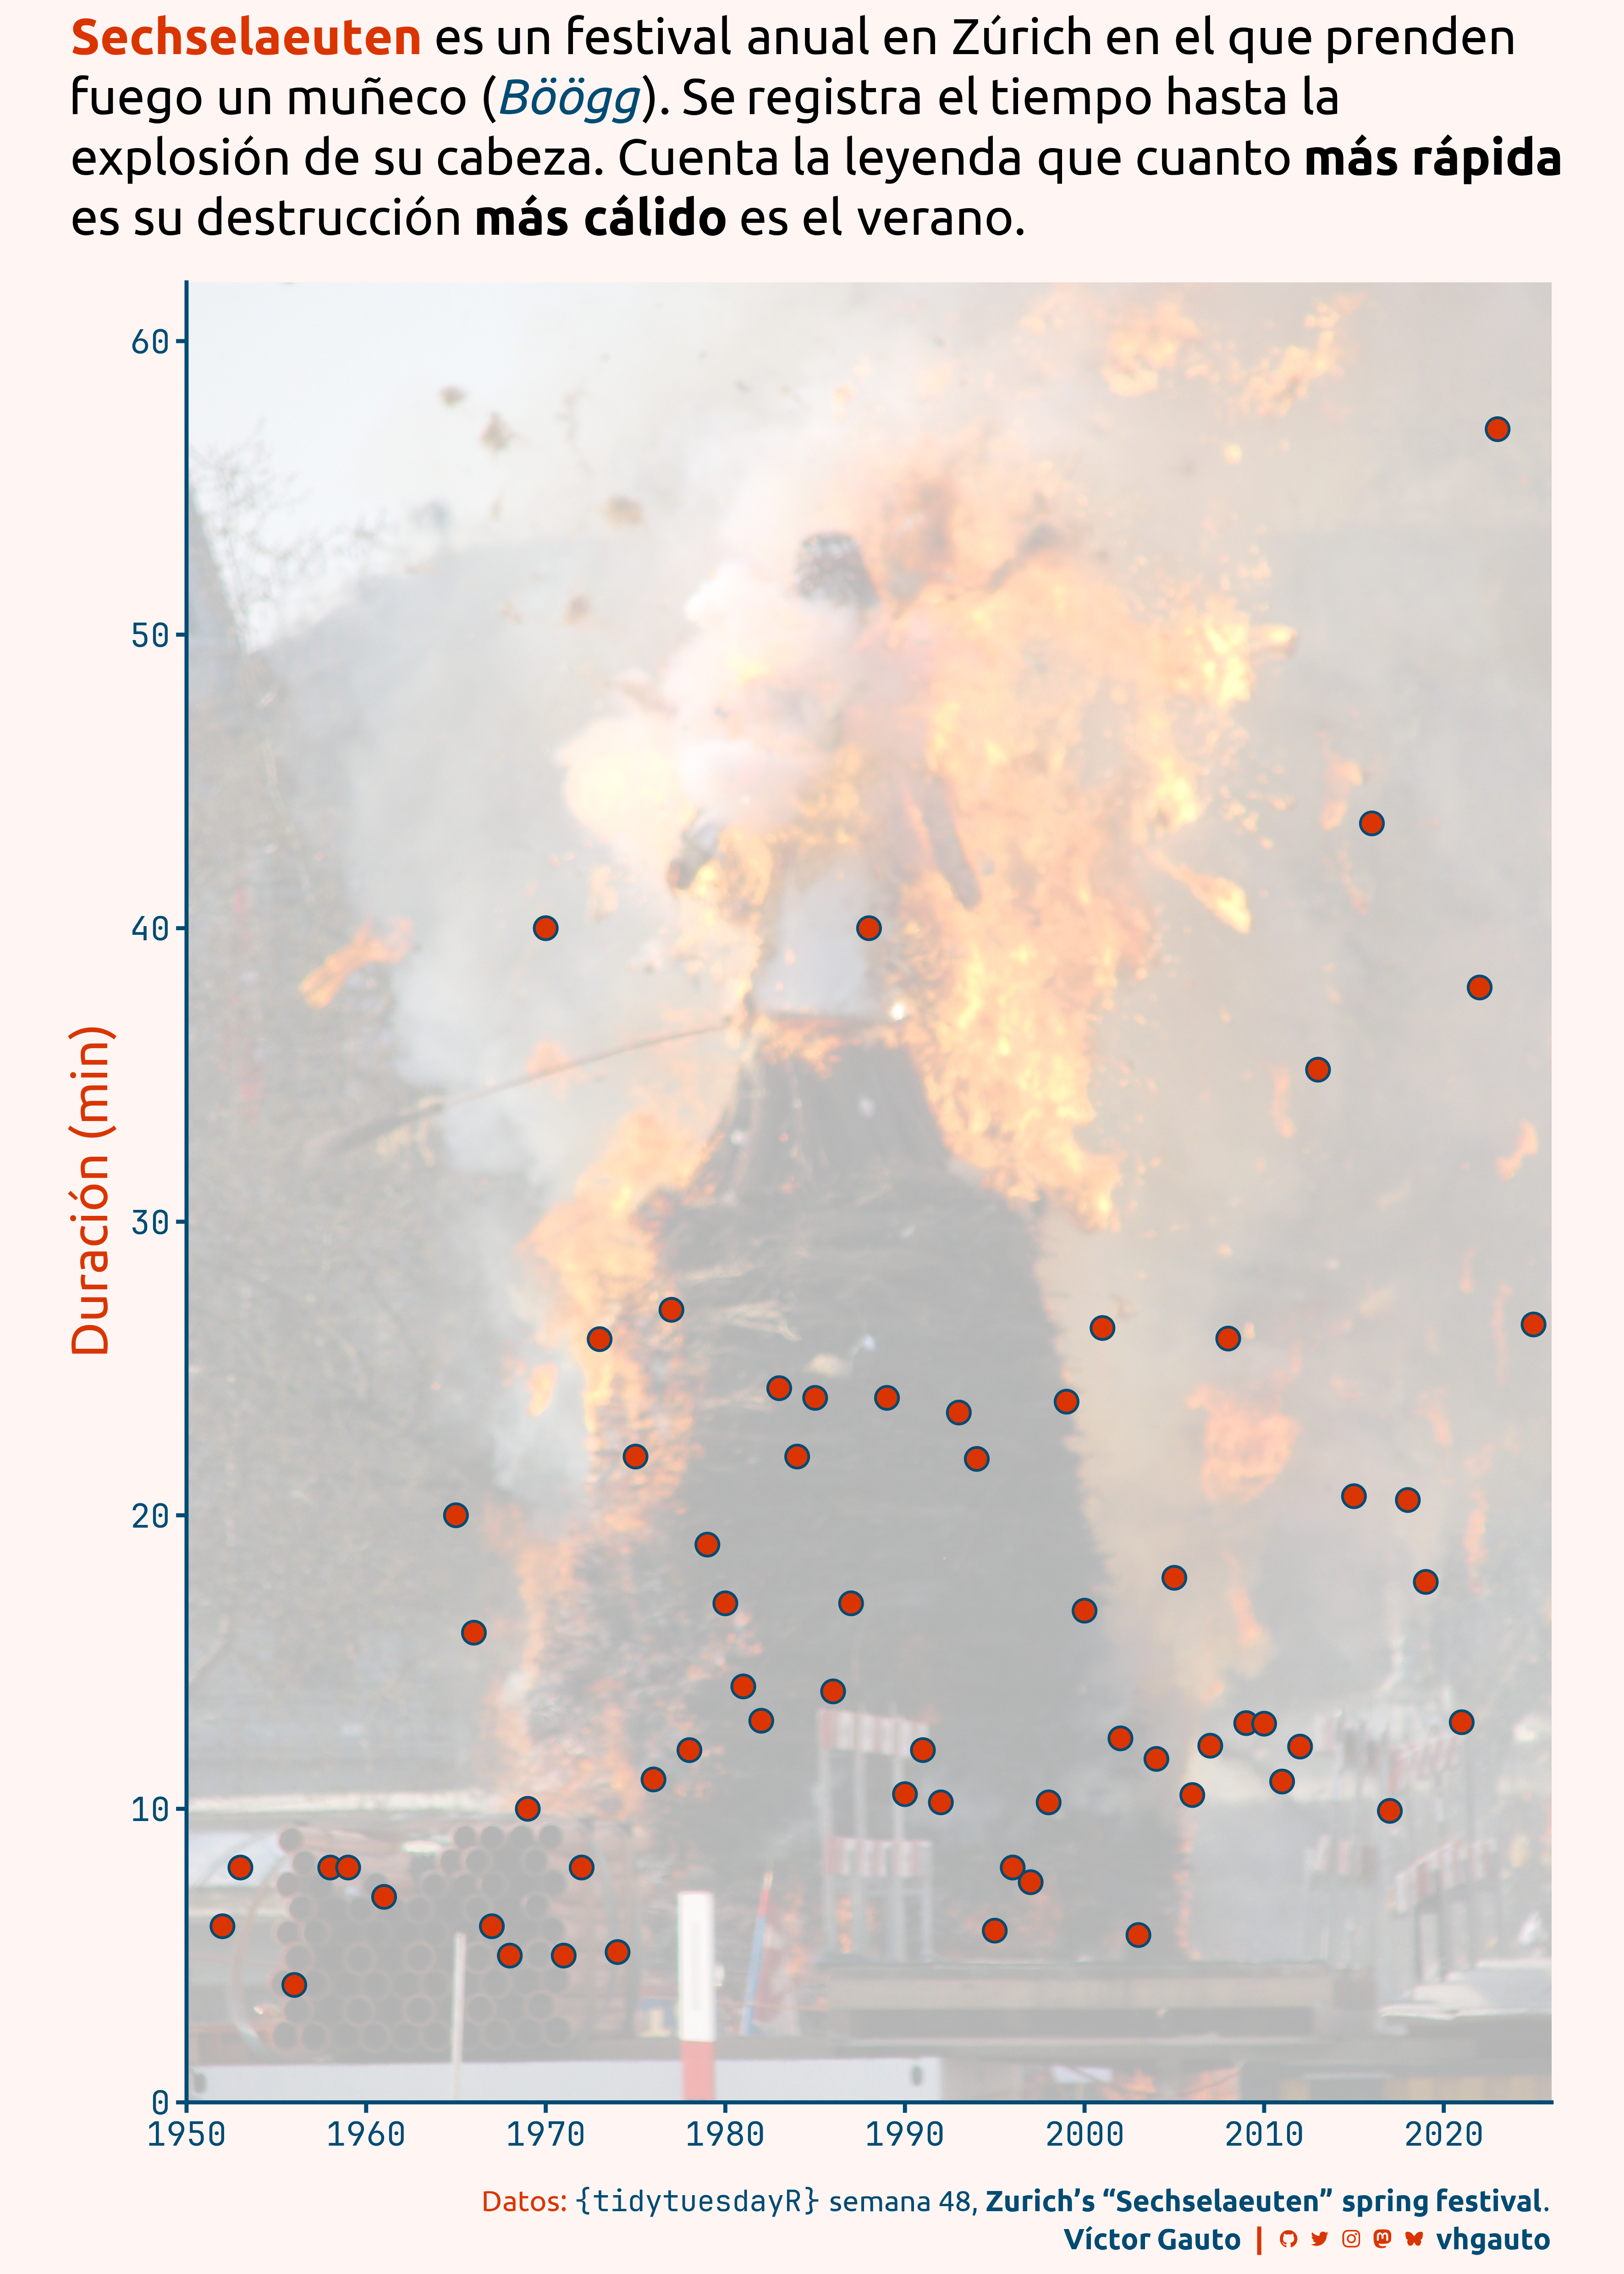
sechselaeuten <- tuesdata$sechselaeutenMe interesa la duración anual sobre una fotografía del incendio del Böögg.
Selecciono los años y las duraciones.
d <- sechselaeuten |>
  select(año = year, dur = duration) |>
  drop_na() |>
filter(año > 1950)Creo u tibble para incorporar la figura de fondo del panel y un rectángulo superpuesto para darle transparencia.
img_tbl <- tibble(
  x = I(.5),
  y = I(.5),
  image = "https://upload.wikimedia.org/wikipedia/commons/3/3c/Sechsel%C3%A4uten_2010_-_B%C3%B6%C3%B6gg_IMG_6468.JPG"
)

rect_tbl <- tibble(
  xmin = I(0),
  xmax = I(1),
  ymin = I(0),
  ymax = I(1)
)
Título y figura.
mi_titulo <- glue(
  "<b style='color: {c1};'>Sechselaeuten</b> es un festival anual en Zúrich
  en el que prenden fuego un muñeco (<i style='color: {c2};'>Böögg</i>). Se
  registra el tiempo hasta la explosión de su cabeza. Cuenta la leyenda que
  cuanto **más rápida** es su destrucción **más cálido** es el verano."
)

g <- ggplot() +
  ggimage::geom_image(
    data = img_tbl,
    aes(x, y, image = image),
    size = .76
  ) +
  geom_rect(
    data = rect_tbl,
    aes(xmin = xmin, ymin = ymin, xmax = xmax, ymax = ymax),
    fill = alpha(c3, .7)
  ) +
  geom_point(
    data = d,
    aes(año, dur),
    shape = 21,
    size = 5,
    fill = c1,
    color = c2,
    stroke = 1
  ) +
  scale_x_continuous(breaks = seq(1950, 2025, 10), limits = c(1950, 2026)) +
  scale_y_continuous(breaks = scales::breaks_width(10), limits = c(0, 62)) +
  coord_cartesian(expand = FALSE) +
  labs(
    x = NULL,
    y = "Duración (min)",
    title = mi_titulo,
    caption = mi_caption
  ) +
  theme_classic(base_family = "ubuntu", base_size = 22) +
  theme(aspect.ratio = 3050 / 2288) +
  theme_sub_plot(
    margin = margin_auto(10),
    background = element_rect(fill = scales::col_lighter(c1, 55), color = NA),
    title.position = "plot",
    title = element_textbox_simple(
      margin = margin(b = 20, r = -10),
      size = rel(1.2)
    ),
    caption = element_markdown(
      color = c1,
      size = rel(.7),
      lineheight = 1.3,
      margin = margin(t = 20)
    )
  ) +
  theme_sub_panel(
    grid = element_line(linewidth = .1),
    grid.minor = element_blank()
  ) +
  theme_sub_axis(
    text = element_text(family = "jet", color = c2),
    title = element_text(size = rel(1.2), color = c1),
    line = element_line(color = c2),
    ticks = element_line(color = c2)
  )
Guardo.
ggsave(
  plot = g,
  filename = "tidytuesday/2025/semana_48.png",
  width = 30,
  height = 42,
  units = "cm"
)