Ocultar código
library(glue)
library(ggtext)
library(showtext)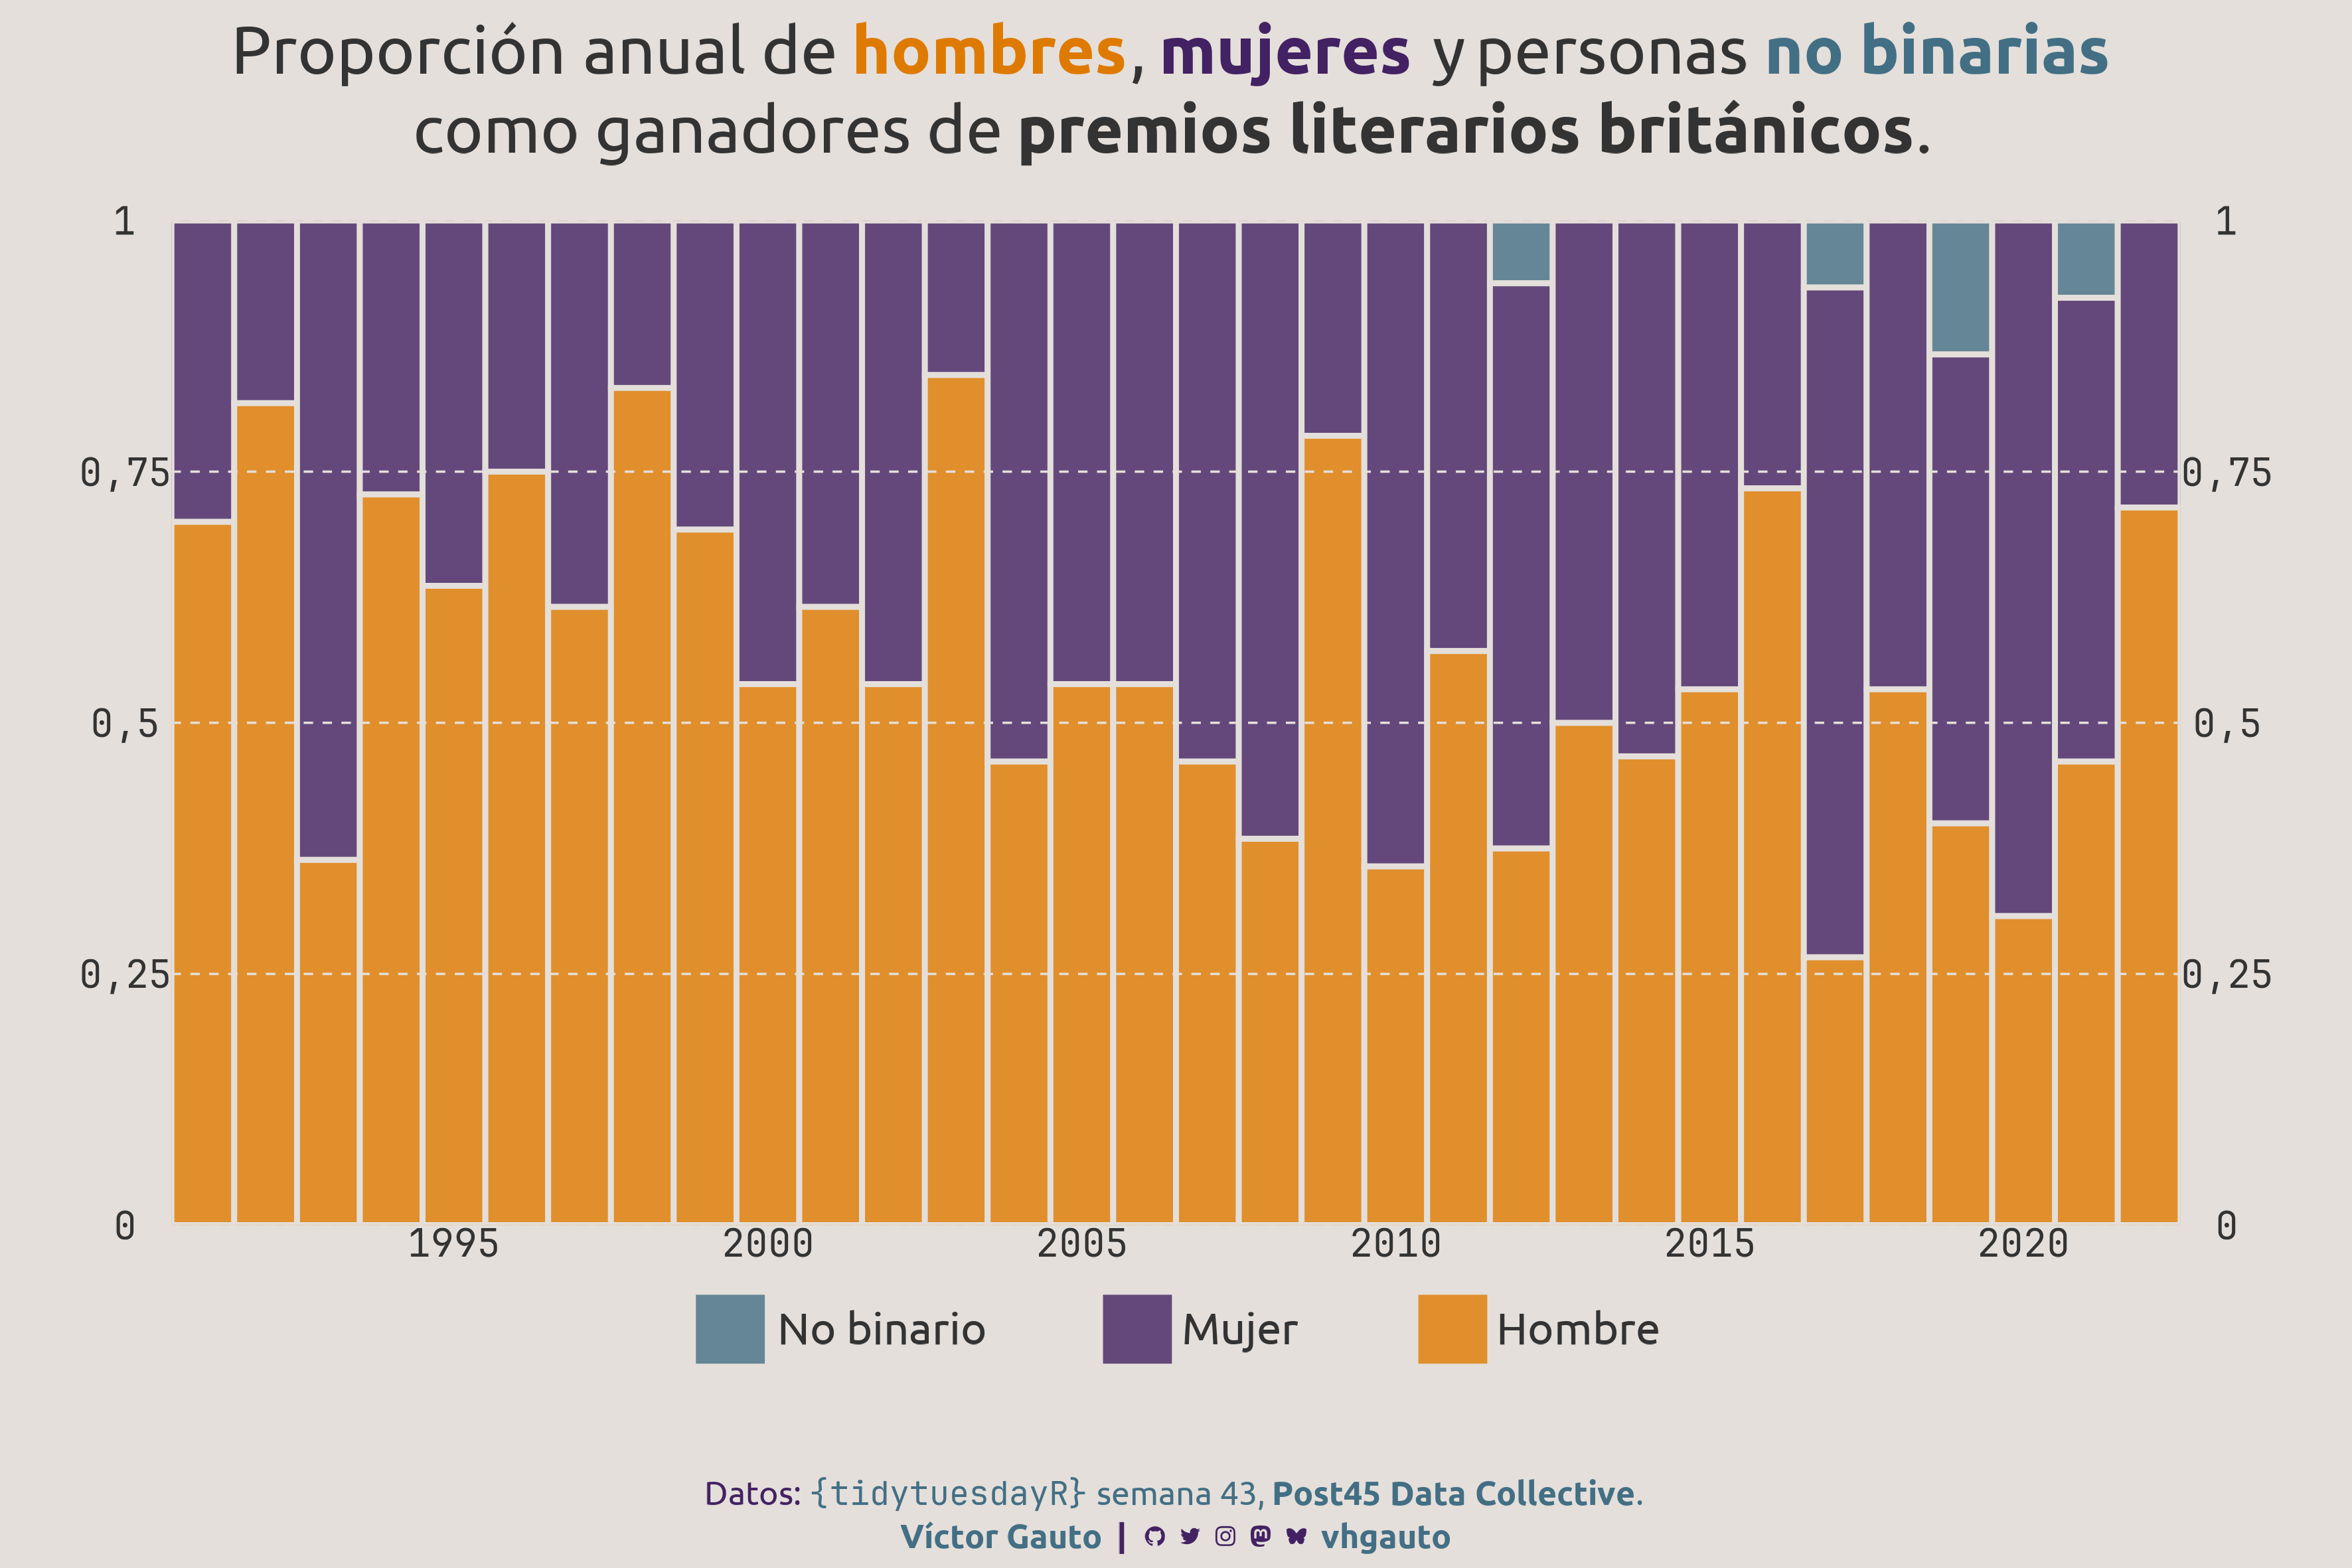
library(tidyverse)Proporción anual de ganadores de premios literarios británicos, en hombres, mujeres y personas no binarias.
library(glue)
library(ggtext)
library(showtext)
library(tidyverse)Colores.
c1 <- "#E4DFDA"
c2 <- "grey20"
col <- PrettyCols::prettycols(palette = "Dark", n = 3)
Fuentes: Ubuntu y JetBrains Mono.
font_add(
  family = "ubuntu",
  regular = "././fuente/Ubuntu-Regular.ttf",
  bold = "././fuente/Ubuntu-Bold.ttf",
  italic = "././fuente/Ubuntu-Italic.ttf"
)

font_add(
  family = "jet",
  regular = "././fuente/JetBrainsMonoNLNerdFontMono-Regular.ttf"
)

showtext_auto()
showtext_opts(dpi = 300)fuente <- glue(
"Datos: <span style='color:{col[1]};'><span style='font-family:jet;'>",
"{{<b>tidytuesdayR</b>}}</span> semana 43, ",
"<b>Post45 Data Collective</b>.</span>"
)
autor <- glue("<span style='color:{col[1]};'>**Víctor Gauto**</span>")
icon_twitter <- glue("<span style='font-family:jet;'></span>")
icon_instagram <- glue("<span style='font-family:jet;'></span>")
icon_github <- glue("<span style='font-family:jet;'></span>")
icon_mastodon <- glue("<span style='font-family:jet;'>󰫑</span>")
icon_bsky <- glue("<span style='font-family:jet;'></span>")
usuario <- glue("<span style='color:{col[1]};'>**vhgauto**</span>")
sep <- glue("**|**")
mi_caption <- glue(
"{fuente}<br>{autor} {sep} {icon_github} {icon_twitter} {icon_instagram} ",
"{icon_mastodon} {icon_bsky} {usuario}"
)tuesdata <- tidytuesdayR::tt_load(2025, 43)
prizes <- tuesdata$prizesMe interesa la proporción de varones, mujeres y no binarios que ganaron premios literarios, año a año.
Vector de traducción de los géneros.
géneros_v <- c(
  man = "Hombre",
  woman = "Mujer",
  `non-binary` = "No binario"
)
Selecciono únicamente los autores ganadores y obtengo la proporción de acuerdo al género.
d <- prizes |>
  filter(person_role == "winner") |>
  select(prize_year, gender) |>
  count(gender, prize_year) |>
  mutate(suma = sum(n), .by = prize_year) |>
  mutate(p = n / suma) |>
  arrange(prize_year, p) |>
  mutate(género = géneros_v[gender]) |>
mutate(género = fct_reorder(género, p, sum))Líneas horizontales y título.
lin_h <- seq(0, 1, .25)

mi_titulo <- glue(
  "Proporción anual de <b style='color: {col[3]}'>hombres</b>, ",
  "<b style='color: {col[2]}'>mujeres</b> y personas ",
  "<b style='color: {col[1]}'>no binarias</b><br>como ganadores de **premios ",
  "literarios británicos**."
)
Figura.
g <- ggplot(d, aes(prize_year, p, fill = género)) +
  geom_col(
    position = position_fill(),
    width = 1,
    color = c1,
    linewidth = 1
  ) +
  geom_hline(yintercept = lin_h, linewidth = .4, color = c1, linetype = 2) +
  scale_x_continuous(breaks = scales::breaks_width(5)) +
  scale_y_continuous(sec.axis = dup_axis(), breaks = lin_h, labels = \(x) {
    case_when(x == 0 ~ "0", x == 1 ~ "1", .default = as.character(x)) |>
      sub("\\.", ",", x = _)
  }) +
  scale_fill_manual(values = alpha(col, .8)) +
  coord_cartesian(expand = FALSE) +
  labs(
    x = NULL,
    y = NULL,
    fill = NULL,
    title = mi_titulo,
    caption = mi_caption
  ) +
  theme_void(base_size = 20, base_family = "ubuntu") +
  theme_sub_axis(
    text = element_text(color = c2, family = "jet", size = rel(.7)),
    ticks = element_blank()
  ) +
  theme_sub_axis_y(text = element_text(hjust = .5)) +
  theme_sub_plot(
    background = element_rect(fill = c1, color = NA),
    margin = margin(r = 10, l = 10, b = 5),
    title = element_markdown(
      hjust = .5,
      color = c2,
      margin = margin(b = 20, t = 10),
      lineheight = 1.2
    ),
    caption = element_markdown(
      size = rel(.6),
      color = col[2],
      hjust = .5,
      lineheight = 1.3,
      margin = margin(t = 40, b = 0)
    )
  ) +
  theme_sub_panel(
    spacing = unit(20, "pt"),
    background = element_blank(),
    grid = element_blank()
  ) +
  theme_sub_legend(
    position = "bottom",
    key = element_blank(),
    key.size = unit(30, "pt"),
    background = element_blank(),
    text = element_text(margin = margin(l = 2), color = c2),
    key.spacing.x = unit(40, "pt"),
    box.spacing = unit(10, "pt")
  ) +
  theme(
    aspect.ratio = .5,
    strip.clip = "off"
  )
Guardo.
ggsave(
  plot = g,
  filename = "tidytuesday/2025/semana_43.png",
  width = 30,
  height = 20,
  units = "cm"
)