# paquetes ----------------------------------------------------------------
library(glue)
library(ggtext)
library(showtext)
library(tidyverse)
# fuente ------------------------------------------------------------------
# colores
c1 <- "#110C3A"
c2 <- "grey70"
c3 <- "#55092A"
c4 <- "grey98"
# fuente: Ubuntu
font_add(
family = "ubuntu",
regular = "fuente/Ubuntu-Regular.ttf",
bold = "fuente/Ubuntu-Bold.ttf",
italic = "fuente/Ubuntu-Italic.ttf")
# monoespacio & íconos
font_add(
family = "jet",
regular = "fuente/JetBrainsMonoNLNerdFontMono-Regular.ttf")
showtext_auto()
showtext_opts(dpi = 300)
# caption
autor <- glue("<span style='color:{c3};'>**Víctor Gauto**</span>")
icon_twitter <- glue("<span style='font-family:jet;'></span>")
icon_instagram <- glue("<span style='font-family:jet;'></span>")
icon_github <- glue("<span style='font-family:jet;'></span>")
icon_mastodon <- glue("<span style='font-family:jet;'>󰫑</span>")
usuario <- glue("<span style='color:{c3};'>**vhgauto**</span>")
sep <- glue("**|**")
fuente <- glue(
"Datos: <span style='color:{c3};'><span style='font-family:jet;'>",
"{{<b>funspotr</b>}}</span>, ",
"{icon_github} vhgauto/tidytuesday.</span>")
mi_caption <- glue(
"{fuente}<br>{autor} {sep} {icon_github} {icon_twitter} {icon_instagram} ",
"{icon_mastodon} {usuario}")
# datos -------------------------------------------------------------------
# me interesa usar {funspotr} para identificar las funciones más frecuentes
# en este proyecto de tidytuesday
# https://brshallo.github.io/funspotr/#spot-functions-on-all-files-in-a-project
# d <- funspotr::list_files_wd() |>
# funspotr::spot_funs_files() |>
# funspotr::unnest_results()
# write_csv(d, "2024/s28/d.csv")
# remuevo las funciones desconocidas para dejar las que tienen paquetes
# identificados
d <- read_csv("2024/s28/d.csv") |>
select(-contains("paths")) |>
filter(pkgs != "(unknown)") |>
count(pkgs, funs, sort = TRUE) |>
slice_head(n = 20)
# paleta de colores por paquete
pal <- MoMAColors::moma.colors(palette_name = "Klein", n = 8)
names(pal) <- unique(d$pkgs)
# incorporo los colores a los paquetes
e <- d |>
mutate(color = pal[pkgs]) |>
mutate(ff = glue("<b style='color:{color}'>{pkgs}</b>::{funs}()")) |>
mutate(ff = fct_reorder(ff, n))
# figura ------------------------------------------------------------------
# agrego el logo de {funspotr}
logo <- "https://brshallo.github.io/funspotr/logo.png"
# nombre de los paquetes con color para incorporar al subtítulo
ff <- e |>
distinct(pkgs, color) |>
mutate(ff = glue("<b style='color:{color}; font-family:jet'>{pkgs}</b>")) |>
pull(ff) |>
str_flatten_comma(last = " y ")
# subtítulo
mi_subtitle <- glue(
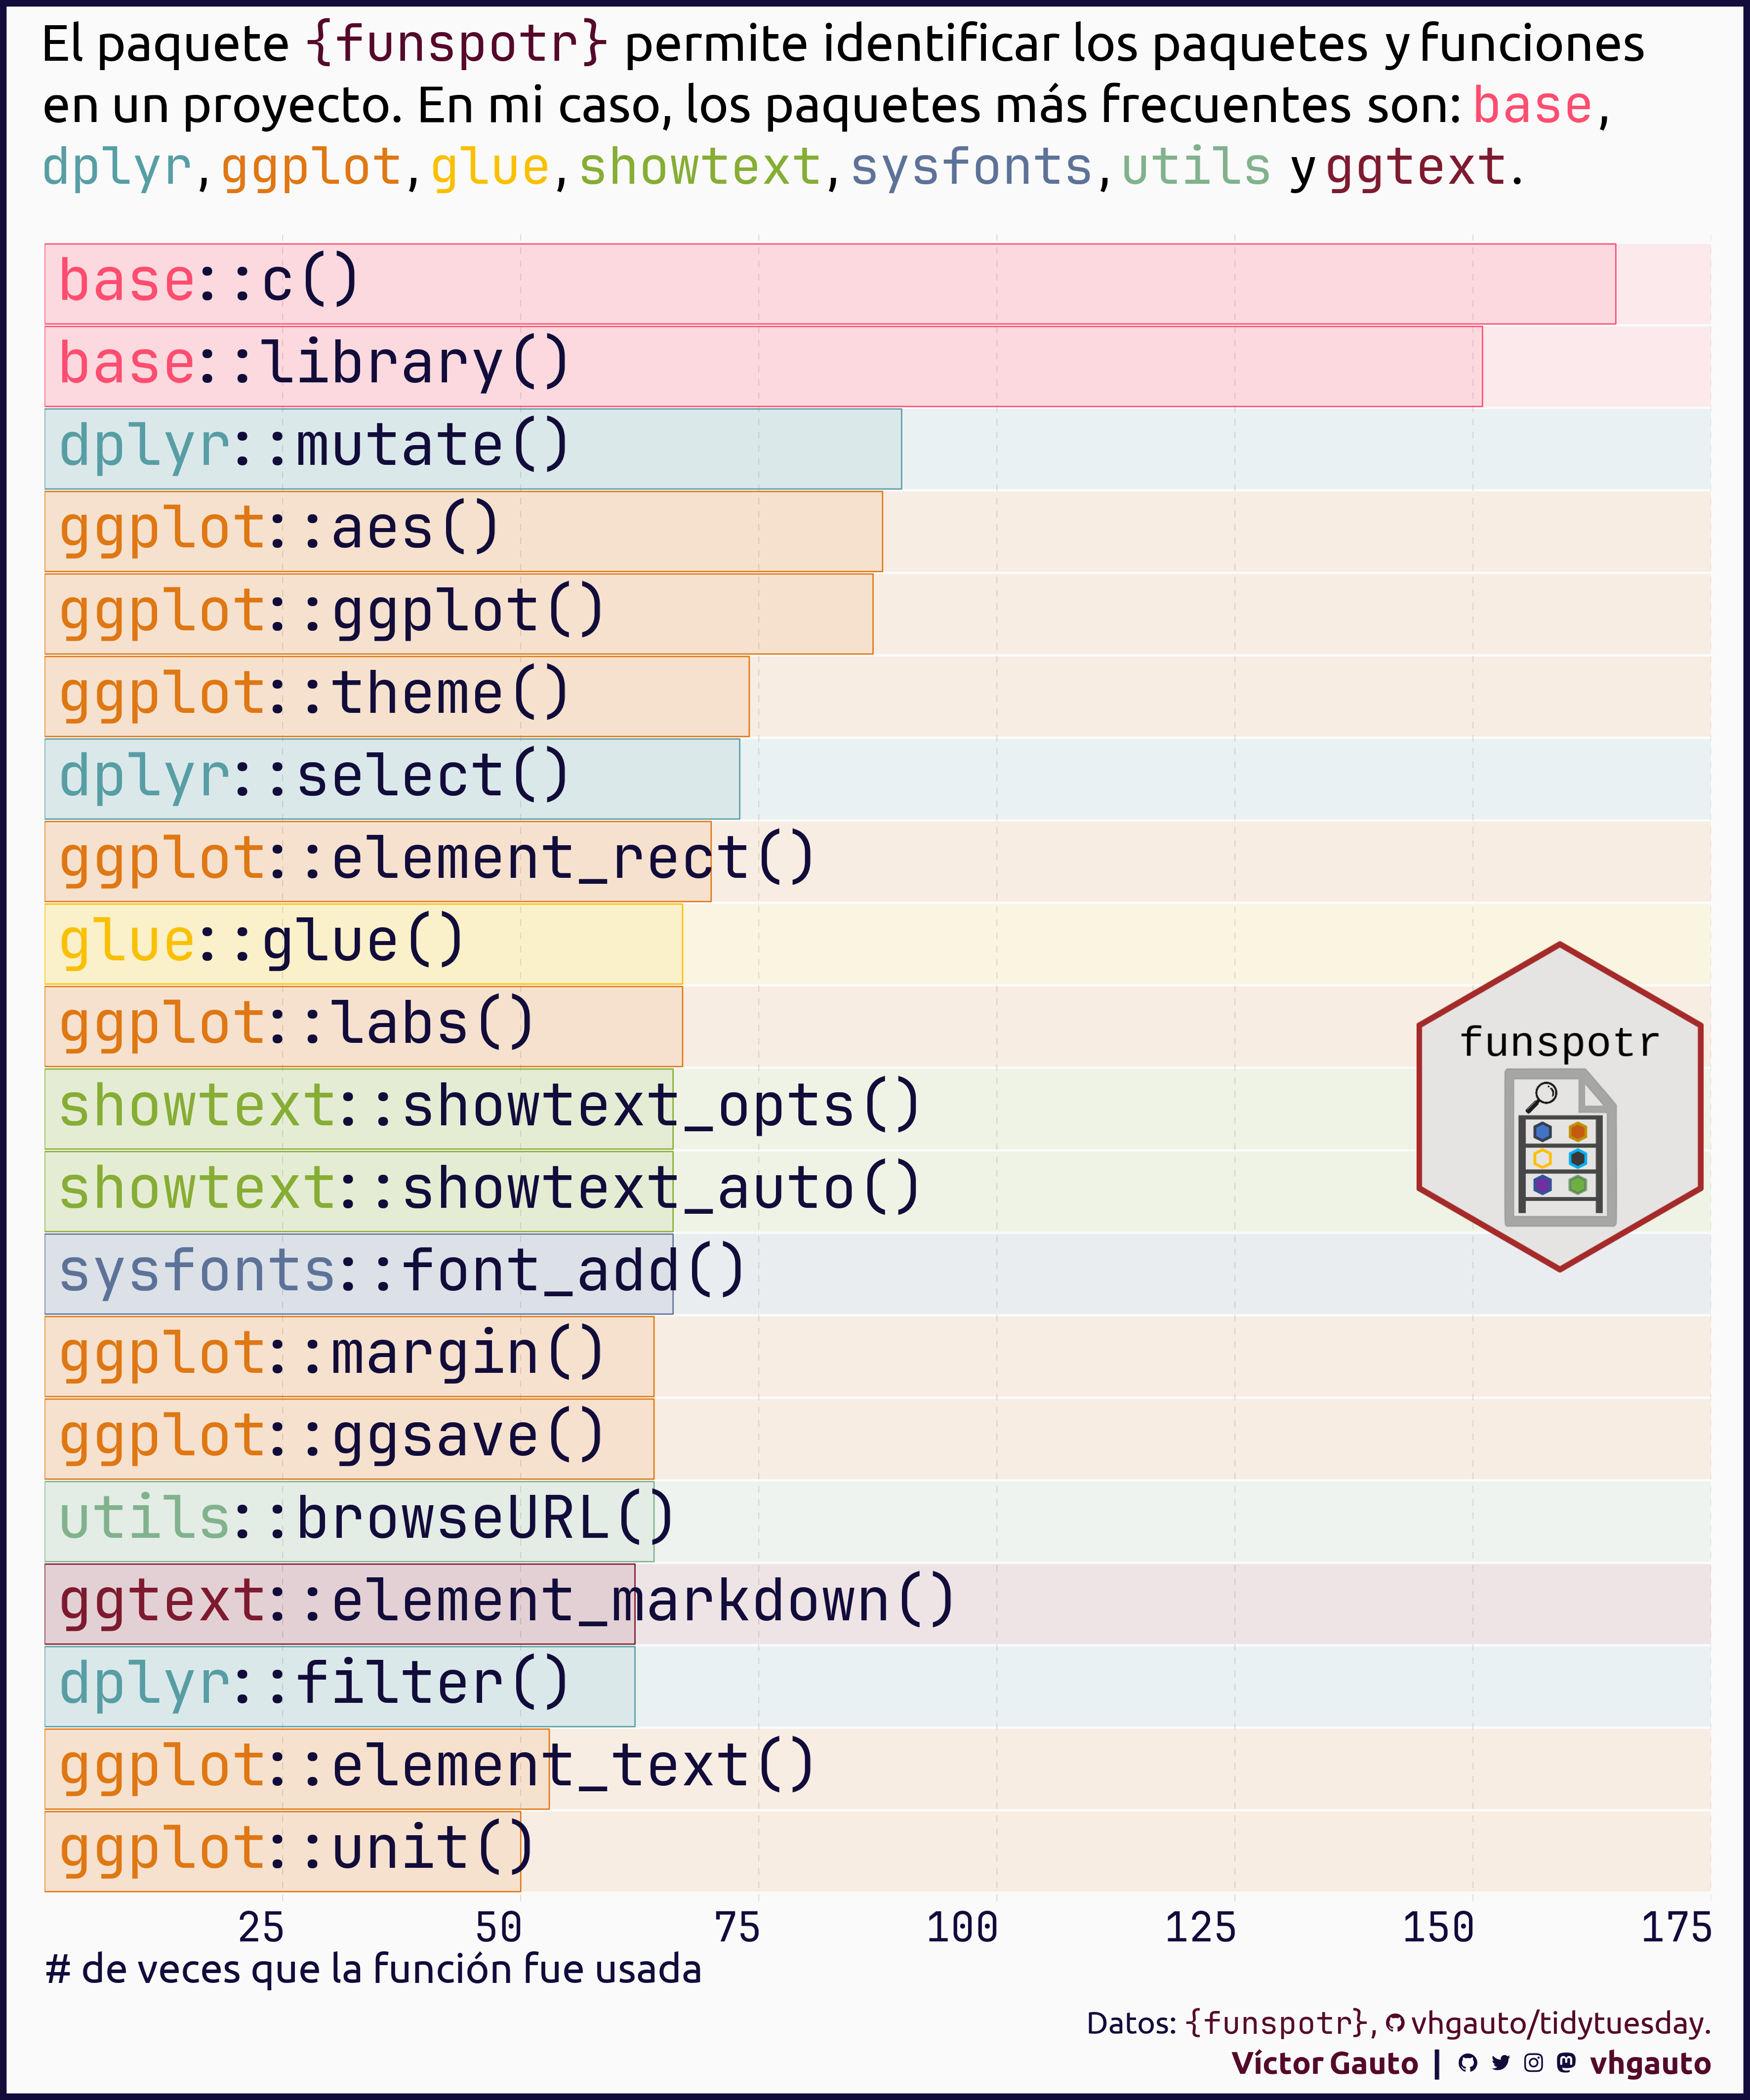
"El paquete <span style='font-family:jet; color:{c3}'>{{funspotr}}</span> ",
"permite identificar los paquetes y funciones en un proyecto. ",
"En mi caso, los paquetes más frecuentes son: {ff}."
)
# figura
g <- ggplot(e, aes(n, ff, label = ff)) +
geom_col(
aes(x = 175, fill = alpha(color, .1)), width = .97, color = NA,
linewidth = 2) +
geom_col(
aes(color = color, fill = alpha(color, .1)), width = .97, linewidth = .3) +
geom_richtext(
aes(x = 1), hjust = 0, size = 10, fill = NA, label.color = NA,
family = "jet", color = c1) +
annotate(
geom = "richtext", label = glue("<img src={logo} width=140></img>"),
x = 175, y = 10, hjust = 1, vjust = .5, fill = NA, label.color = NA
) +
scale_x_continuous(
breaks = seq(25, 175, 25), expand = c(0, 0), limits = c(0, 175)) +
scale_color_identity() +
scale_fill_identity() +
labs(
x = "# de veces que la función fue usada", y = NULL, subtitle = mi_subtitle,
caption = mi_caption) +
theme_minimal() +
theme(
aspect.ratio = 1,
plot.background = element_rect(fill = c4, color = c1, linewidth = 3),
plot.margin = margin(t = 11.3, b = 10, l = 19, r = 19),
plot.subtitle = element_textbox_simple(
family = "ubuntu", size = 25, margin = margin(b = 20)),
plot.caption = element_markdown(
family = "ubuntu", size = 15, color = c1, margin = margin(t = 10),
lineheight = unit(1.3, "line")),
panel.grid = element_blank(),
panel.grid.major.x = element_line(
linewidth = .1, linetype = "FF", color = c2),
axis.text.x = element_text(
family = "jet", size = 20, color = c1, hjust = 1),
axis.text.y = element_blank(),
axis.title.x = element_text(
family = "ubuntu", color = c1, size = 20, hjust = 0)
)
# guardo
ggsave(
plot = g,
filename = "2024/s28/viz.png",
width = 30,
height = 36,
units = "cm")
# abro
browseURL("2024/s28/viz.png")