# paquetes ----------------------------------------------------------------
library(glue)
library(ggtext)
library(showtext)
library(ggthemes)
library(tidyverse)
# fuente ------------------------------------------------------------------
# colores
c1 <- "#1F77B4"
c2 <- "#E377C2"
c3 <- "#9467BD"
c4 <- "grey90"
c5 <- "#F0F0F0"
# fuente: Ubuntu
font_add(
family = "ubuntu",
regular = "fuente/Ubuntu-Regular.ttf",
bold = "fuente/Ubuntu-Bold.ttf",
italic = "fuente/Ubuntu-Italic.ttf"
)
# monoespacio & íconos
font_add(
family = "jet",
regular = "fuente/JetBrainsMonoNLNerdFontMono-Regular.ttf"
)
showtext_auto()
showtext_opts(dpi = 300)
# caption
fuente <- glue(
"Datos: <span style='color:{c3};'><span style='font-family:jet;'>",
"{{<b>tidytuesdayR</b>}}</span> semana {37}, ",
"<b>Opportunity Insights</b>.</span>"
)
autor <- glue("<span style='color:{c3};'>**Víctor Gauto**</span>")
icon_twitter <- glue("<span style='font-family:jet;'></span>")
icon_instagram <- glue("<span style='font-family:jet;'></span>")
icon_github <- glue("<span style='font-family:jet;'></span>")
icon_mastodon <- glue("<span style='font-family:jet;'>󰫑</span>")
usuario <- glue("<span style='color:{c3};'>**vhgauto**</span>")
sep <- glue("**|**")
mi_caption <- glue(
"{fuente}<br>{autor} {sep} {icon_github} {icon_twitter} {icon_instagram} ",
"{icon_mastodon} {usuario}"
)
# datos -------------------------------------------------------------------
tuesdata <- tidytuesdayR::tt_load(2024, 37)
college_admissions <- tuesdata$college_admissions
# me interesa comparar la admisión a universidades top y públicas, según los
# ingresos del hogar
d <- college_admissions |>
select(par_income_lab, par_income_bin, rel_att_cond_app, tier) |>
filter(
tier %in% c("Ivy Plus", "Selective public")
) |>
mutate(par_income_lab = fct_reorder(par_income_lab, par_income_bin)) |>
drop_na()
# figura ------------------------------------------------------------------
# subtítulo y títulos de eje
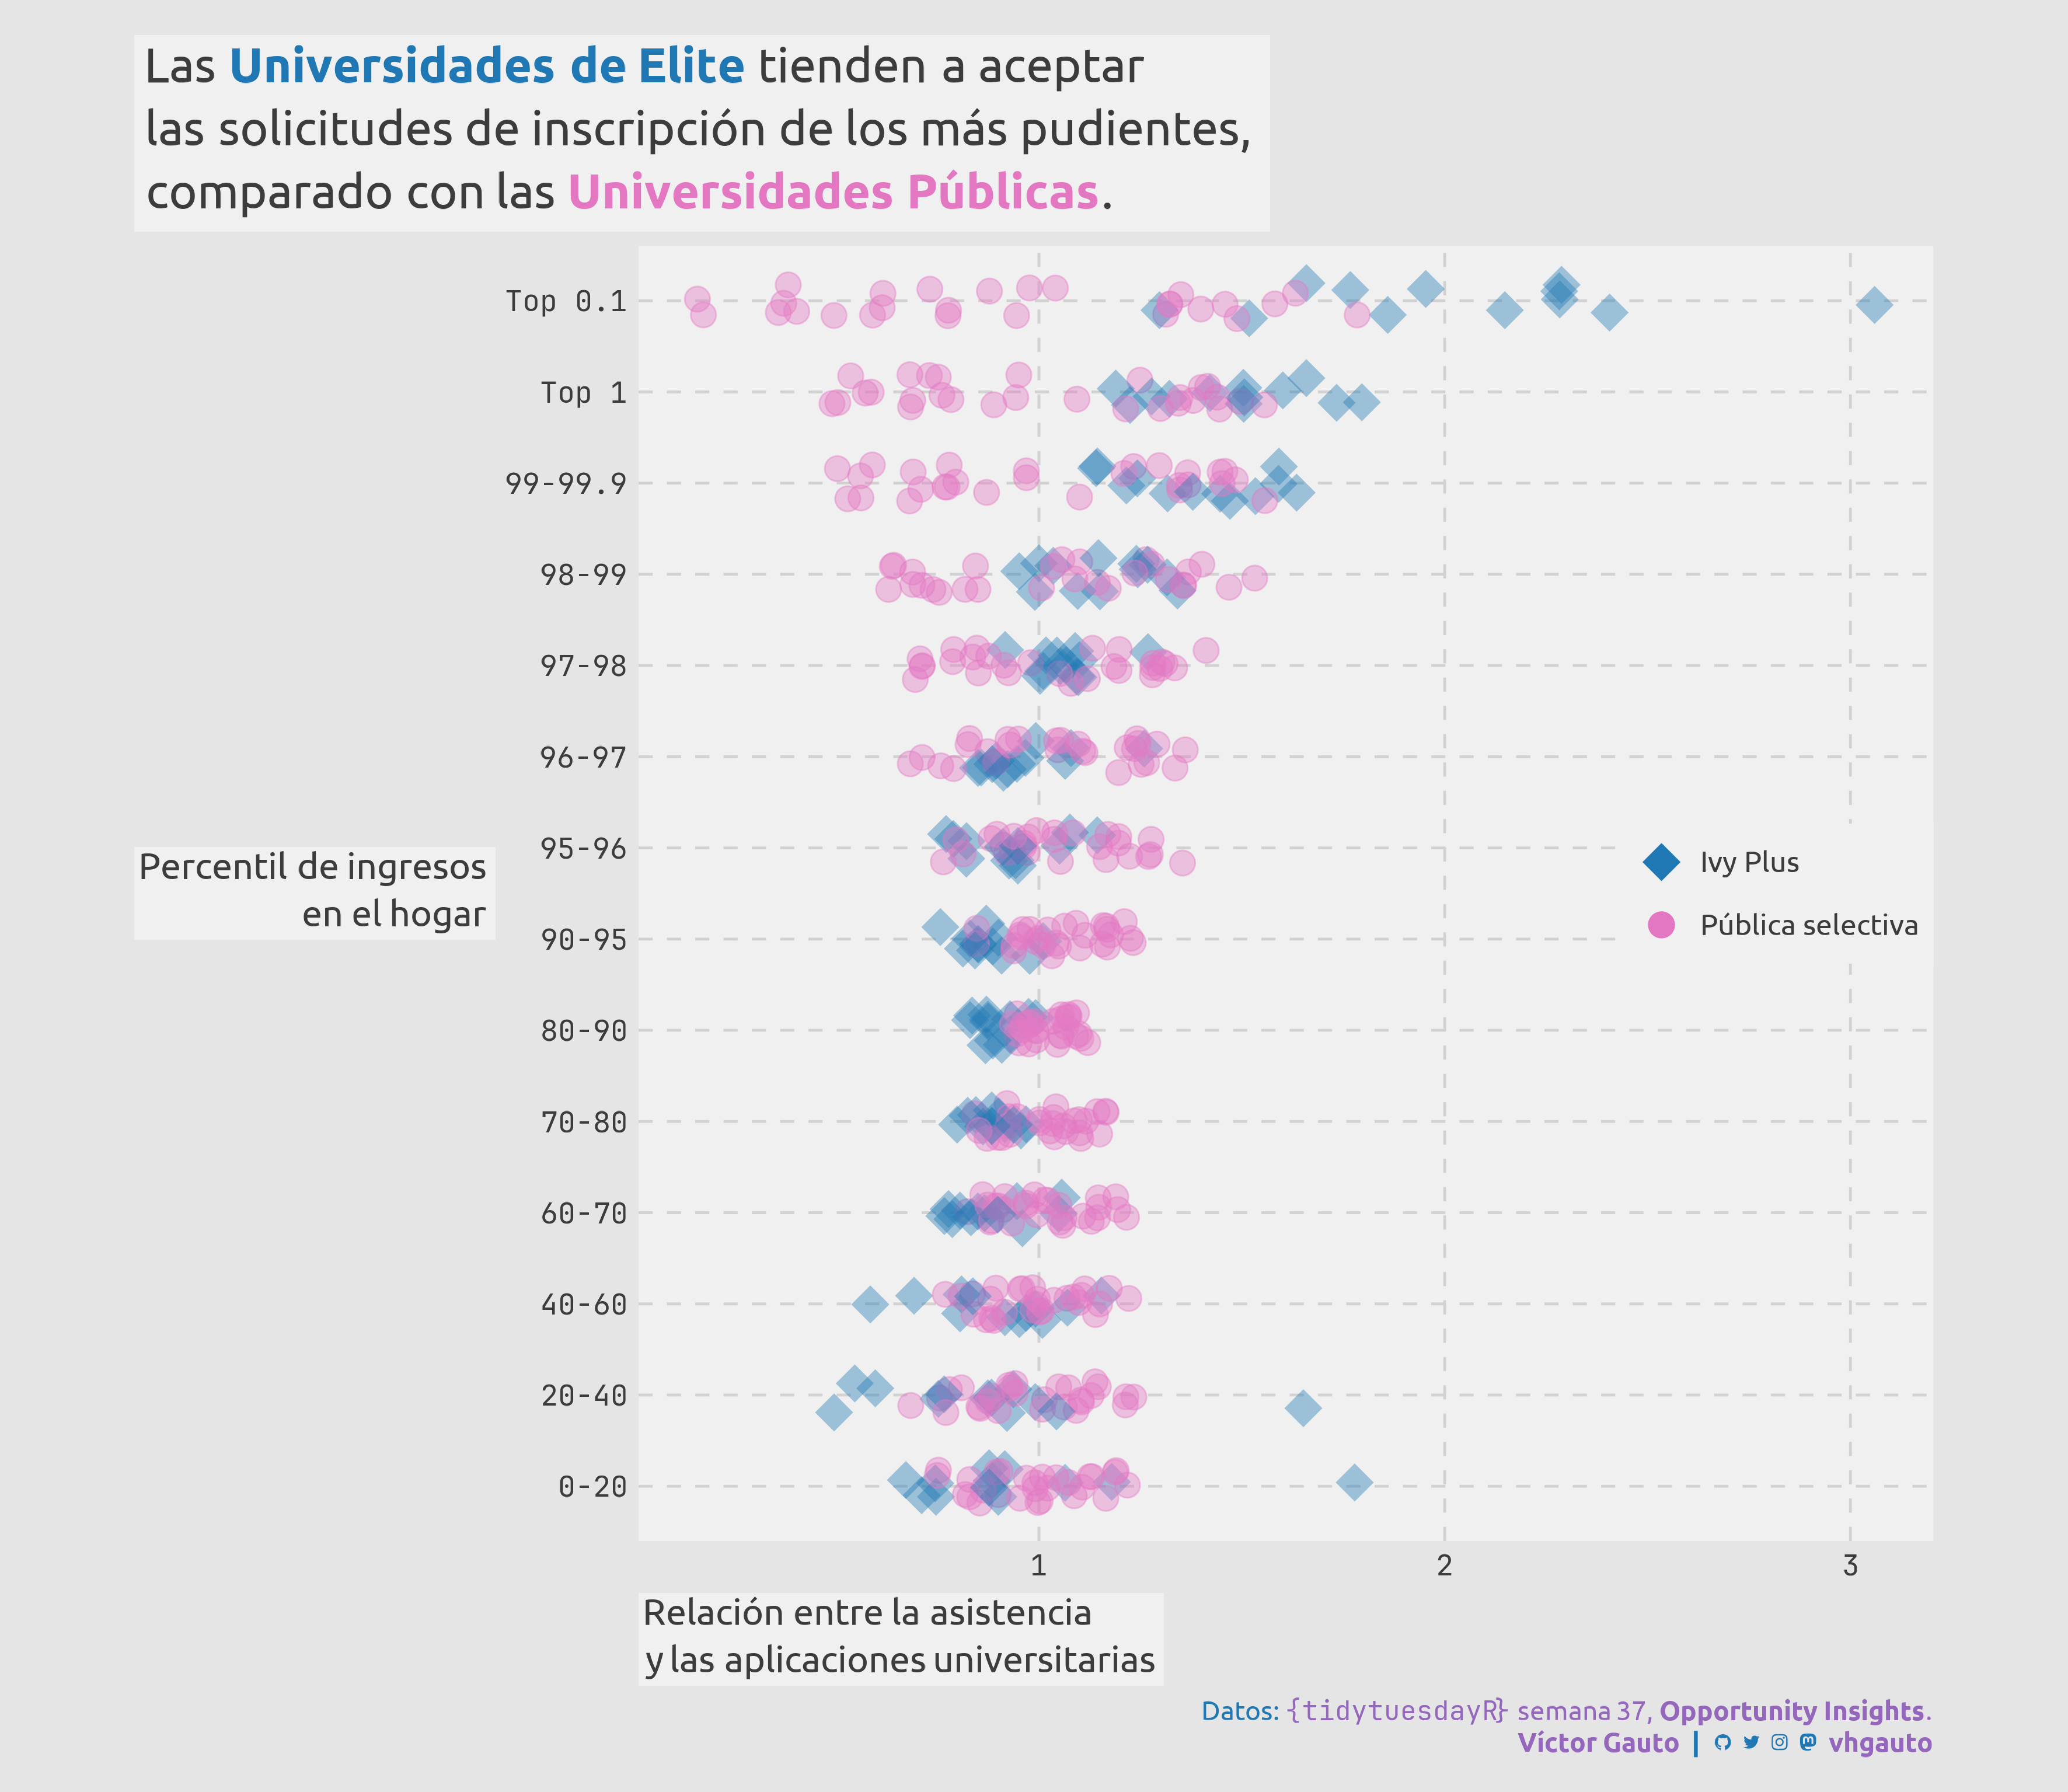
mi_subtítulo <- glue(
"Las <b style='color:{c1};'>Universidades de Elite</b> tienden a aceptar",
"las solicitudes de inscripción de los más pudientes,",
"comparado con las <b style='color:{c2};'>Universidades Públicas</b>.",
.sep = "<br>"
)
eje_x <- glue(
"Relación entre la asistencia",
"y las aplicaciones universitarias",
.sep = "<br>"
)
eje_y <- glue(
"Percentil de ingresos",
"en el hogar",
.sep = "<br>"
)
# figura
g <- ggplot(
d,
aes(rel_att_cond_app, par_income_lab, color = tier, shape = tier)
) +
geom_jitter(alpha = .4, size = 7, height = .2) +
scale_color_manual(
values = c(c1, c2),
breaks = c("Ivy Plus", "Selective public"),
labels = c("Ivy Plus", "Pública selectiva")
) +
scale_shape_manual(
values = c(18, 20),
breaks = c("Ivy Plus", "Selective public"),
labels = c("Ivy Plus", "Pública selectiva")
) +
scale_x_continuous(
minor_breaks = scales::breaks_width(.1)
) +
labs(
x = eje_x, y = eje_y, color = NULL, shape = NULL, subtitle = mi_subtítulo,
caption = mi_caption) +
guides(
color = guide_legend(
override.aes = list(alpha = 1), ncol = 1)
) +
theme_fivethirtyeight() +
theme(
aspect.ratio = 1,
plot.title.position = "plot",
plot.background = element_rect(fill = c4),
plot.subtitle = element_markdown(
family = "ubuntu", size = 20, lineheight = unit(1.3, "line"), fill = c5,
padding = unit(.2, "cm")
),
plot.caption = element_markdown(
family = "ubuntu", size = 11, color = c1, hjust = 1,
lineheight = unit(1.2, "line")
),
panel.grid = element_line(linetype = "55"),
axis.text = element_text(family = "jet", size = 12),
axis.title.y = element_markdown(
family = "ubuntu", size = 15, angle = 0, vjust = .5, hjust = 1,
lineheight = unit(1.3, "line"), fill = c5, padding = unit(.1, "cm")
),
axis.title.x = element_markdown(
family = "ubuntu", size = 15, lineheight = unit(1.3, "line"), hjust = 0,
margin = margin(t = 5), fill = c5, padding = unit(.1, "cm")
),
legend.text = element_text(family = "ubuntu", size = 12),
legend.position = "inside",
legend.background = element_rect(fill = c5),
legend.key = element_blank(),
legend.justification.inside = c(1, .5),
legend.position.inside = c(1, .5)
)
# guardo
ggsave(
plot = g,
filename = "2024/s37/viz.png",
width = 30,
height = 26,
units = "cm")
# abro
browseURL(glue("{getwd()}/2024/s37/viz.png"))