Ocultar código
library(sf)
library(glue)
library(ggtext)
library(showtext)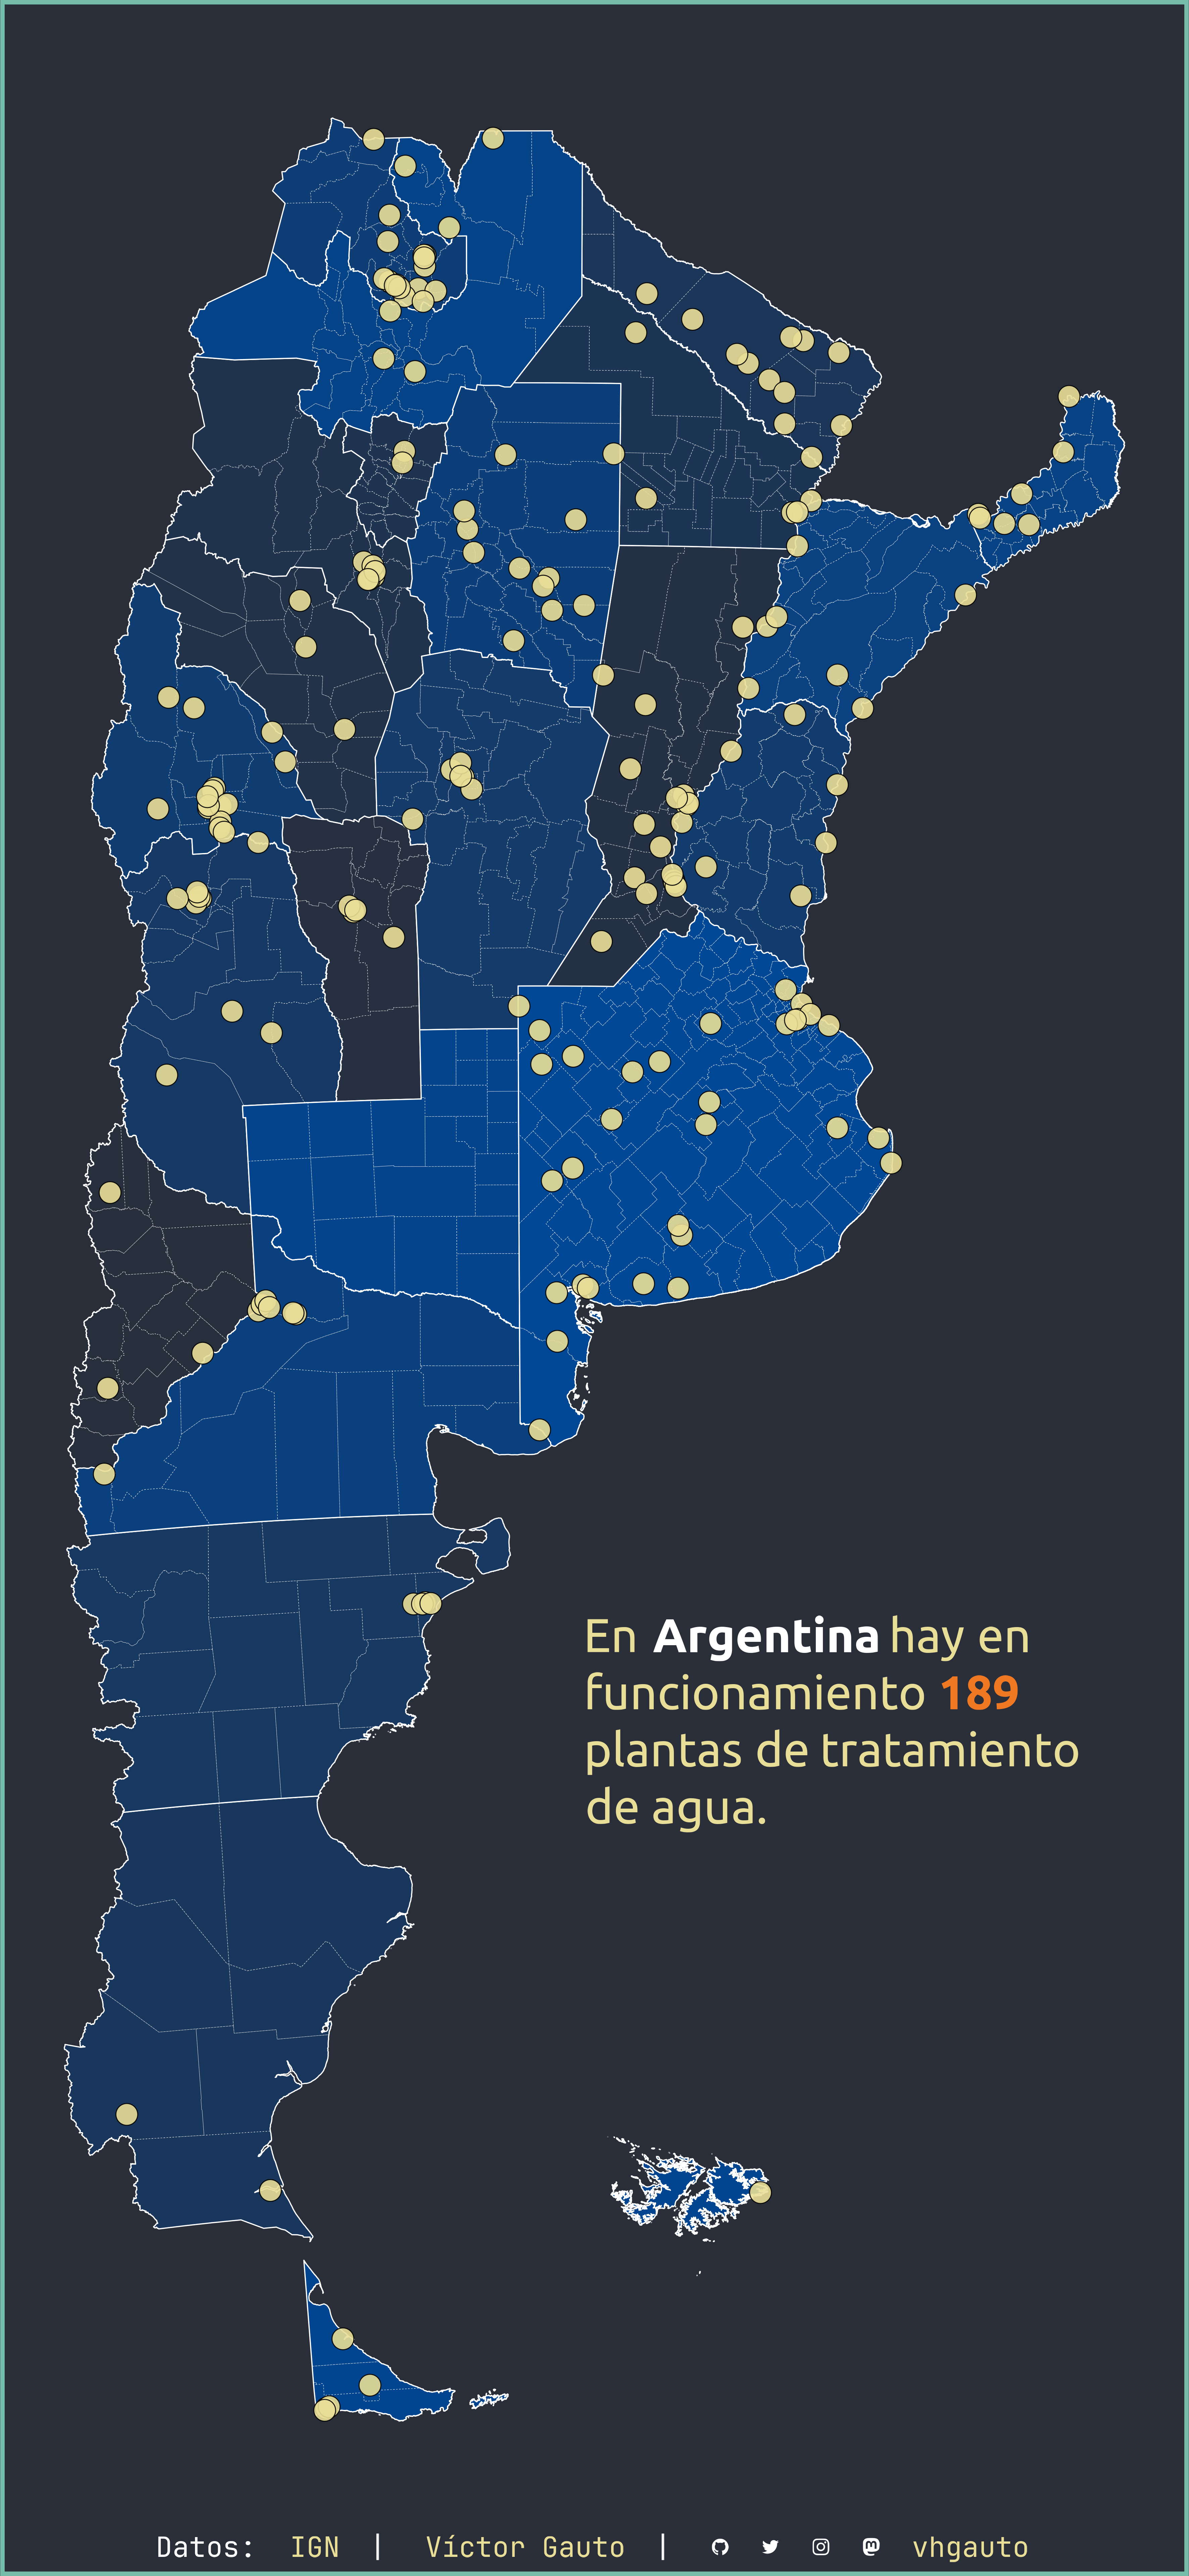
library(tidyverse)Mapa de plantas de tratamiento de agua de Argentina.
library(sf)
library(glue)
library(ggtext)
library(showtext)
library(tidyverse)Paleta de colores.
col <- MoMAColors::moma.colors(palette_name = "Smith")
c1 <- "#FFFFFF"
c2 <- "#000000"
Fuentes: Ubuntu y JetBrains Mono.
font_add(
  family = "ubuntu",
  regular = "././fuente/Ubuntu-Regular.ttf",
  bold = "././fuente/Ubuntu-Bold.ttf",
  italic = "././fuente/Ubuntu-Italic.ttf"
)

font_add(
  family = "jet",
  regular = "././fuente/JetBrainsMonoNLNerdFontMono-Regular.ttf"
)

showtext_auto()
showtext_opts(dpi = 300)fuente <- glue(
"<b>Datos:</b> <span style='color:{col[4]};'>IGN</span>")
autor <- glue("<span style='color:{col[4]};'>Víctor Gauto</span>")
icon_twitter <- glue("<span style='font-family:jet;'></span>")
icon_instagram <- glue("<span style='font-family:jet;'></span>")
icon_github <- glue("<span style='font-family:jet;'></span>")
icon_mastodon <- glue("<span style='font-family:jet;'>󰫑</span>")
icon_bluesky <- glue("<span style='font-family:jet;'></span>")
usuario <- glue("<span style='color:{col[4]};'>vhgauto</span>")
sep <- glue("**|**")
mi_caption <- glue(
"{fuente} {sep} {autor} {sep} <b>{icon_github} {icon_twitter} ",
"{icon_instagram} {icon_mastodon} {icon_bluesky}</b> {usuario}"
)Vectores de las provincias con sus departamentos. Obtengo el vector de plantas potabilizadoras del Instituto Geográfico Nacional, y conservo únicamente los que se encuentran en actividad. Asigno a cada provincia un color de la gama del azul.
deptos <- st_read("argentina/vectores/dptos_continental.gpkg") |>
  st_transform(crs = 5346) |>
  st_geometry()

col_pcias <- colorRampPalette(
  c(col[5], scales::muted(col[5])), alpha = .6)(24)

pcias <- st_read("argentina/vectores/pcias_continental.gpkg") |>
  mutate(fill_pcias = col_pcias)

v <- st_read(
  "argentina/vectores/extras/puntos_de_fabricacion_y_procesamiento_BH220.json") |>
  filter(fun == 6) |>
st_transform(crs = 5346)Subtítulo y posición.
x_sub <- st_bbox(deptos)$xmax
y_sub <- st_bbox(deptos)$ymax

mi_subtitle <- glue(
  "En <b style='color: {c1}'>Argentina</b> hay en",
  "funcionamiento <b style='color:#EF7923'>{nrow(v)}</b>",
  "plantas de tratamiento",
  "de agua.",
  .sep = "<br>"
)
Figura.
g <- ggplot() +
  # provincias
  geom_sf(
    data = pcias, aes(fill = fill_pcias), linewidth = .4, color = c1,
    show.legend = TRUE
  ) +
  # departamentos
  geom_sf(
    data = deptos, fill = NA, color = c1, linewidth = .1, linetype = "55"
  ) +
  # plantas potabilizadoras
  geom_sf(
    data = v, shape = 21, fill = col[4], size = 7, color = c2, alpha = .9
  ) +
  # subtítulo
  annotate(
    geom = "richtext", x = x_sub*.84, y = y_sub*.66, label = mi_subtitle,
    fill = NA, label.color = NA, size = 12, color = col[4], hjust = 0,
    family = "ubuntu"
  ) +
  scale_fill_identity() +
  scale_shape_identity() +
  labs(caption = mi_caption) +
  theme_void() +
  theme(
    plot.margin = margin(r = 8, l = 8, t = 2),
    plot.background = element_rect(
      fill = col[5], color = col[2], linewidth = 3),
    plot.caption = element_markdown(
      family = "jet", color = c1, hjust = .5, size = 20,
      margin = margin(b = 10))
  )
Guardo.
ggsave(
  plot = g,
  filename = "argentina/instalaciones/plantas_potabilizadoras.png",
  width = 30,
  height = 65,
  units = "cm"
)