Ocultar código
library(terra)
library(tidyterra)
library(glue)
library(showtext)
library(ggtext)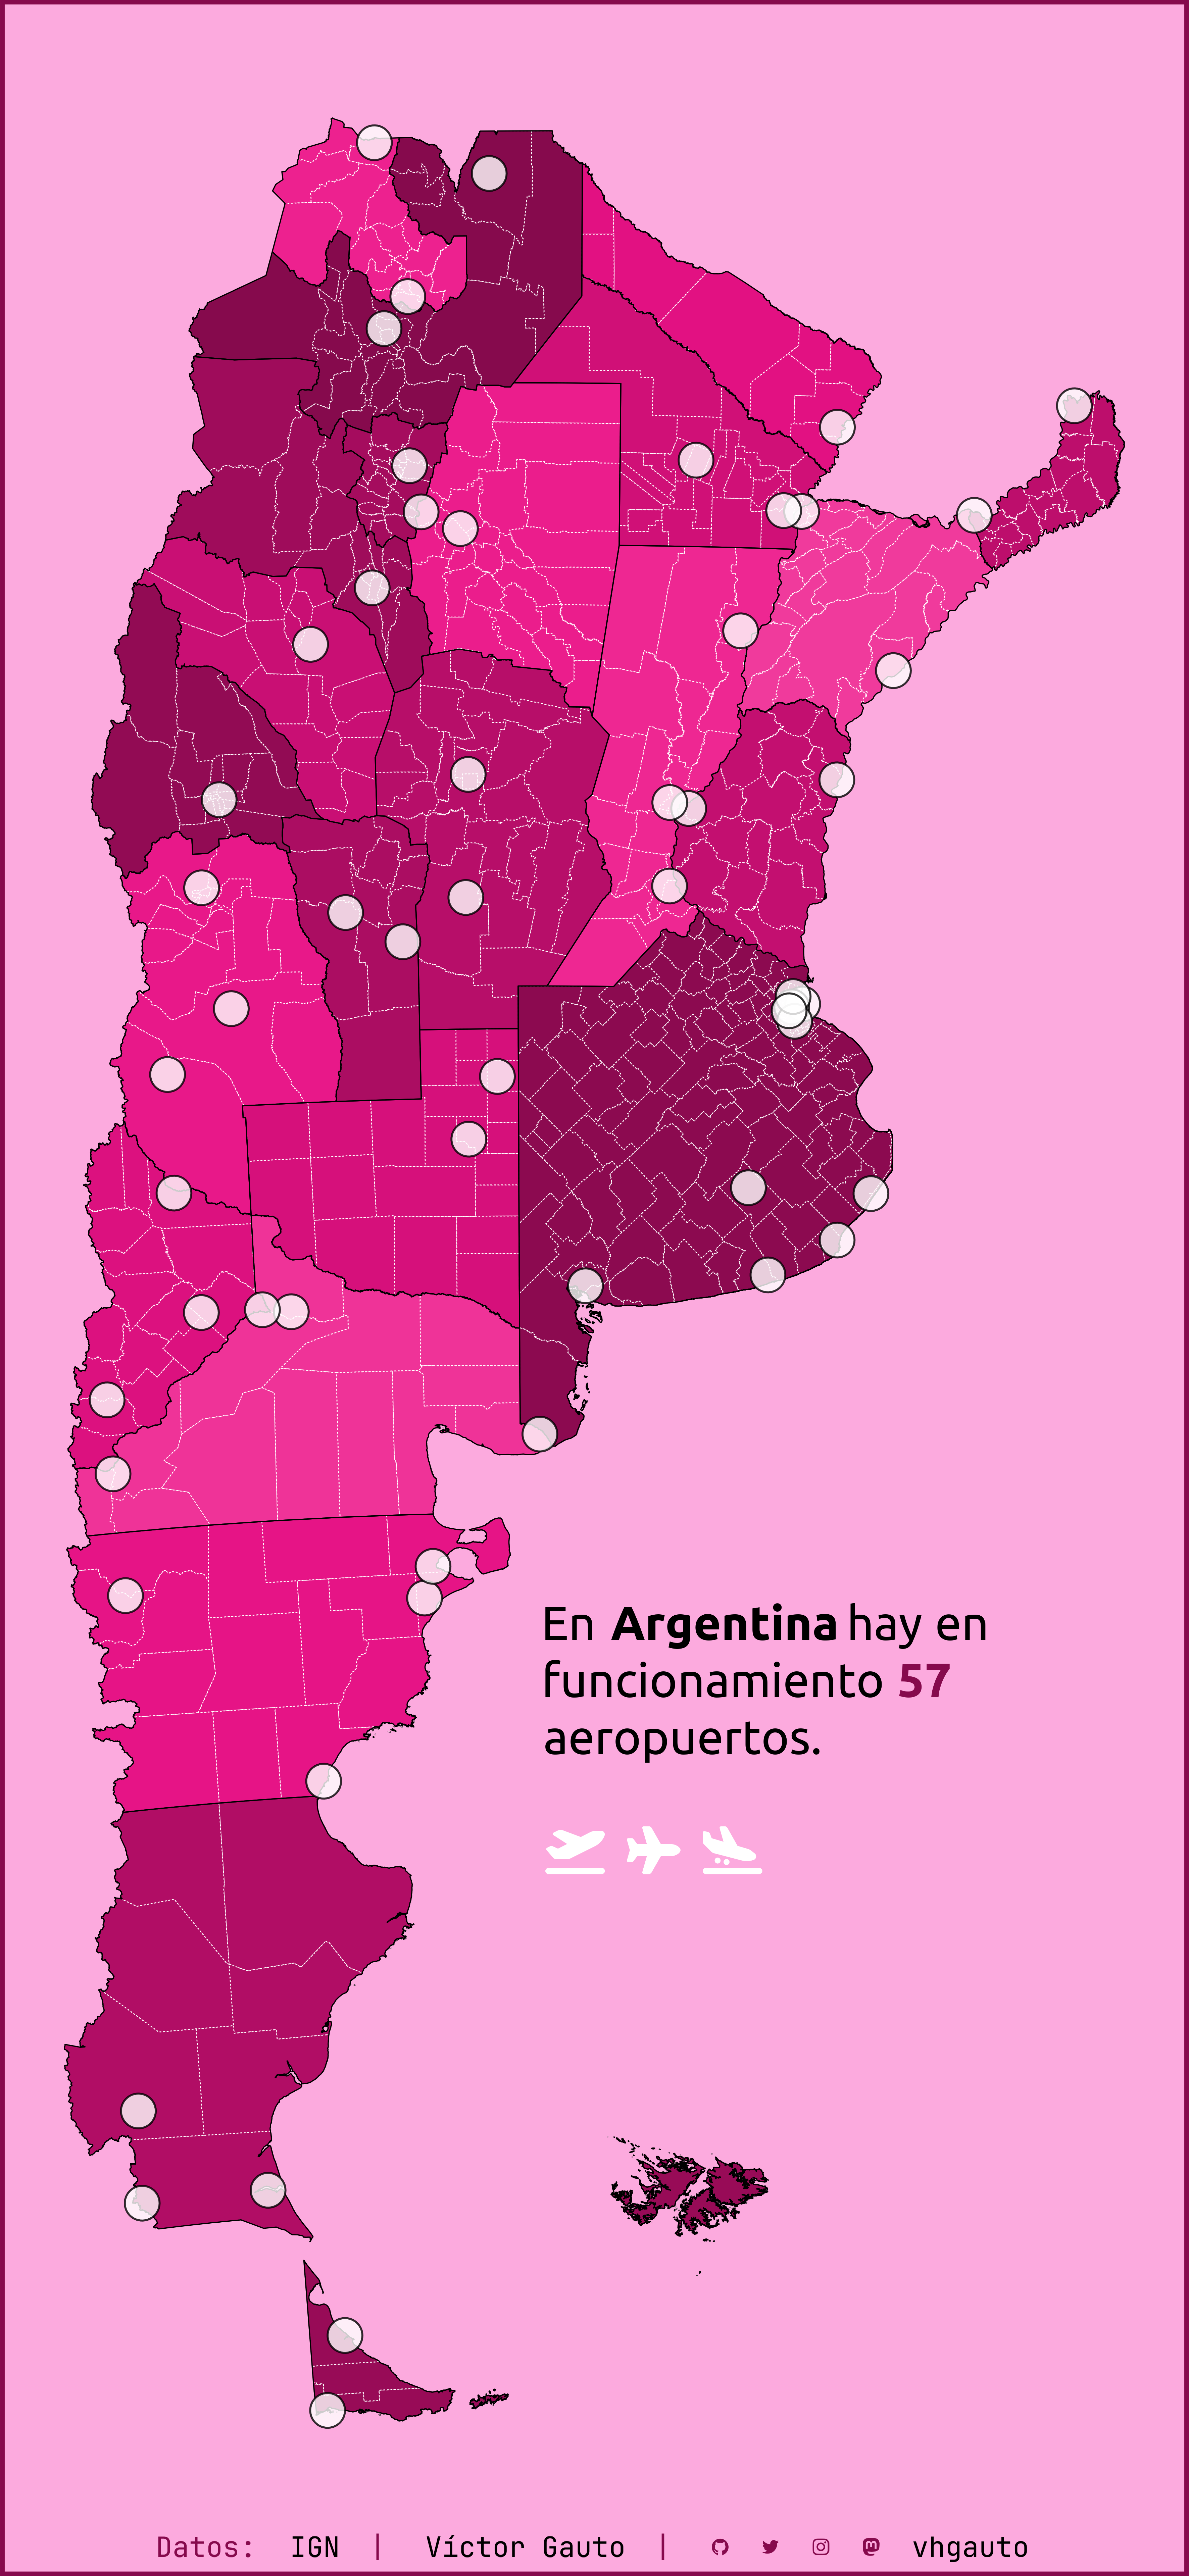
library(tidyverse)Mapa de aeropuertos de Argentina.
library(terra)
library(tidyterra)
library(glue)
library(showtext)
library(ggtext)
library(tidyverse)Colores aleatorios a partir de una gama de rosados.
set.seed(2024)
pp <- PrettyCols::prettycols(palette = "Pinks", n = 24, type = "continuous") |>
  sample()

c1 <- "black"
c2 <- "white"
c3 <- "#FCAADE"
c4 <- "#860A4D"
Fuentes: Ubuntu, JetBrains Mono y fontawesome.
font_add(
  family = "ubuntu",
  regular = "././fuente/Ubuntu-Regular.ttf",
  bold = "././fuente/Ubuntu-Bold.ttf",
  italic = "././fuente/Ubuntu-Italic.ttf"
)

font_add(
  family = "jet",
  regular = "././fuente/JetBrainsMonoNLNerdFontMono-Regular.ttf"
)

font_add(
  family = "fa",
  regular = "././fuente/Font Awesome 6 Free-Solid-900.otf"
)

showtext_auto()
showtext_opts(dpi = 300)fuente <- glue(
"<b>Datos:</b> <span style='color:{c1};'>IGN</span>")
autor <- glue("<span style='color:{c1};'>Víctor Gauto</span>")
icon_twitter <- glue("<span style='font-family:jet;'></span>")
icon_instagram <- glue("<span style='font-family:jet;'></span>")
icon_github <- glue("<span style='font-family:jet;'></span>")
icon_mastodon <- glue("<span style='font-family:jet;'>󰫑</span>")
icon_bluesky <- glue("<span style='font-family:jet;'></span>")
usuario <- glue("<span style='color:{c1};'>vhgauto</span>")
sep <- glue("**|**")
mi_caption <- glue(
"{fuente} {sep} {autor} {sep} <b>{icon_github} {icon_twitter} ",
"{icon_instagram} {icon_mastodon} {icon_bluesky}</b> {usuario}"
)Vectores de las provincias con sus departamentos. Obtengo el vector de aeropuertos del Instituto Geográfico Nacional, y conservo únicamente los que se encuentran en actividad.
pcias <- vect("argentina/vectores/pcias_continental.gpkg") |>
  project("EPSG:5346")

dptos_pcias <- vect("argentina/vectores/dptos_pcias_continental.gpkg")

aer <- vect("argentina/vectores/extras/puntos_de_transporte_aereo_GB005.json") |>
  project("EPSG:5346")

aer <- aer[aer$fun == 6]Íconos de los aviones
icon1 <- glue("<span style='font-family:fa; color:{c2};'></span> ")
icon2 <- glue("<span style='font-family:fa; color:{c2};'></span> ")
icon3 <- glue("<span style='font-family:fa; color:{c2};'></span> ")
icon <- glue("{icon1} {icon2} {icon3}")Subtítulo y posición.
x_sub <- ext(aer)$xmax
y_sub <- ext(aer)$ymax

mi_subtitle <- glue(
  "En <b style='color: {c1}'>Argentina</b> hay en",
  "funcionamiento <b style='color:{c4}'>{nrow(aer)}</b>",
  "aeropuertos.<br>",
  "{icon}",
  .sep = "<br>"
)
Figura.
g <- ggplot() +
  # departamentos
  geom_sf(
    data = dptos_pcias, aes(fill = provincia), color = c2, linewidth = .3,
    linetype = "22"
  ) +
  # provincias
  geom_sf(
    data = pcias, fill = NA, color = c1, linewidth = .4
  ) +
  # aeropuertos
  geom_sf(
    data = aer, fill = c2, color = c1, size = 11, alpha = .8,
    stroke = 1, shape = 21) +
  # subtítulo
  annotate(
    geom = "richtext", x = x_sub*.84, y = y_sub*.66, label = mi_subtitle,
    fill = NA, label.color = NA, size = 12, color = c1, hjust = 0,
    family = "ubuntu"
  ) +
  scale_fill_manual(values = pp) +
  labs(caption = mi_caption) +
  theme_void() +
  theme(
    plot.margin = margin(r = 8, l = 8, t = 2),
    plot.background = element_rect(
      fill = c3, color = c4, linewidth = 3),
    plot.caption = element_markdown(
      family = "jet", color = c4, hjust = .5, size = 20,
      margin = margin(b = 10)),
    legend.position = "none"
  )
Guardo.
ggsave(
  plot = g,
  filename = "argentina/instalaciones/aeropuertos.png",
  width = 30,
  height = 65,
  units = "cm"
)