Ocultar código
library(showtext)
library(ggtext)
library(glue)
library(terra)
library(tidyterra)
library(tidyverse)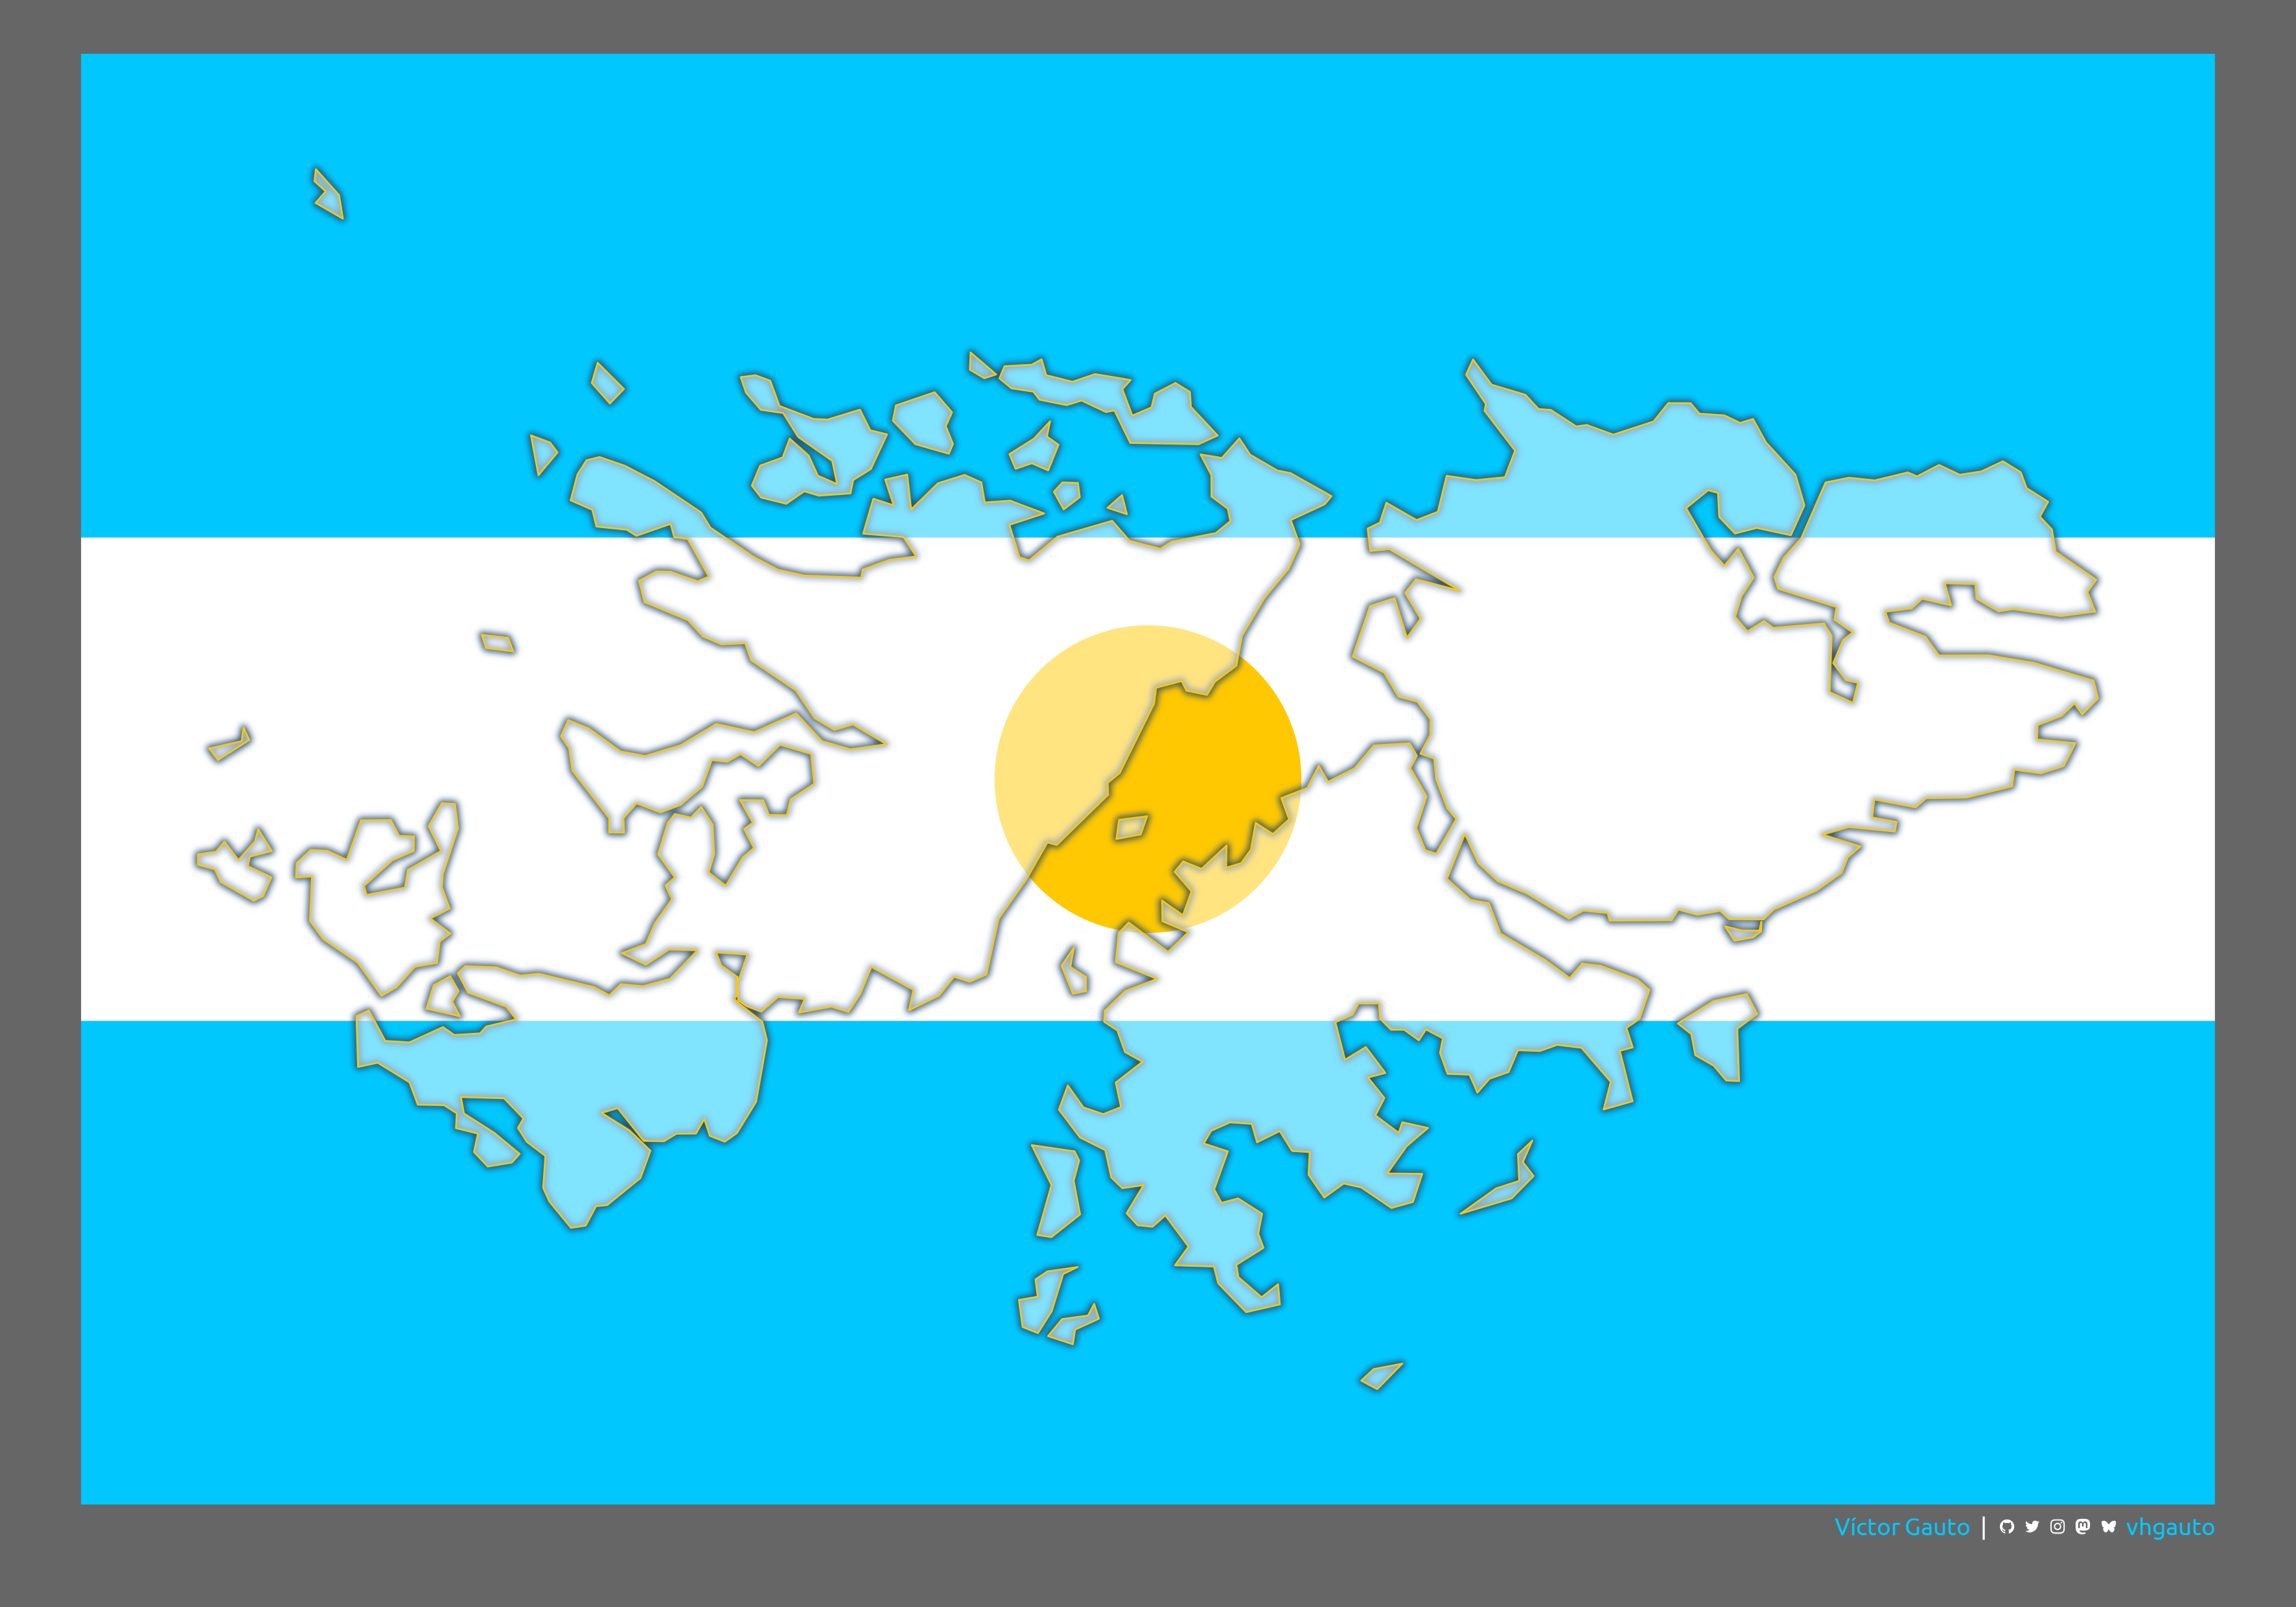
En conmemoración del 2 de abril, Día del Veterano y de los Caídos en la Guerra de Malvinas.
Paquetes.
library(showtext)
library(ggtext)
library(glue)
library(terra)
library(tidyterra)
library(tidyverse)Fuentes, colores y autor.
font_add(
family = "jet",
regular = "./fuente/JetBrainsMonoNLNerdFontMono-Regular.ttf"
)
font_add(
family = "ubuntu",
regular = "./fuente/Ubuntu-Regular.ttf"
)
showtext_auto()
showtext_opts(dpi = 300)
celeste <- "#00c8ff"
sol <- "#ffc800"
blanco <- "#ffffff"
gris <- "grey40"
azul <- "#1e466e"
nombre <- glue("<span style='color:{celeste};'>**Víctor Gauto**</span>")
icon_twitter <- glue("<span style='font-family:jet;'></span>")
icon_instagram <- glue("<span style='font-family:jet;'></span>")
icon_github <- glue("<span style='font-family:jet;'></span>")
icon_mastodon <- glue("<span style='font-family:jet;'>󰫑</span>")
icon_bsky <- glue("<span style='font-family:jet;'></span>")
usuario <- glue("<span style='color:{celeste};'>**vhgauto**</span>")
sep <- glue("**|**")
autor <- glue(
"{nombre} {sep} {icon_github} {icon_twitter} {icon_instagram} ",
"{icon_mastodon} {icon_bsky} {usuario}"
)Obtengo vector de Tierra del Fuego, Antártida e Islas del Atlántico Sur del paquete {geoAr}. Selecciono únicamente las Islas Malvinas.
tdf_v <- geoAr::get_geo(geo = "TIERRA DEL FUEGO") |>
  vect()

im_v <- tdf_v[3, ]
Creo un buffer alrededor de la extensión del vector de las Islas Malvinas y obtengo la distancia vertical.
roi2 <- ext(im_v)
roi <- buffer(vect(roi2, "EPSG:4326"), 15000) |>
  ext()
y <- roi$ymax - roi$ymin
Creo franjas para representar la bandera Argentina a partir de dividir horizontalmente en tercios la extensión del vector.
franjas_v <- tibble(
  xmin = roi$xmin,
  xmax = roi$xmax,
  ymin = c(roi$ymin, roi$ymin + y / 3, roi$ymin + 2 * y / 3),
  ymax = c(roi$ymin + y / 3, roi$ymin + 2 * y / 3, roi$ymax)
) |>
  pmap(\(xmin, xmax, ymin, ymax) c(xmin, xmax, ymin, ymax)) |>
  map(~ vect(ext(.x), crs = "EPSG:4326")) |>
  vect()
Creo el Sol a partir del centroide con un buffer.
sol_v <- centroids(vect(roi, crs = "EPSG:4326")) |>
  buffer(width = 20000, quadsegs = 500)
Figura.
g <- ggplot() +
  geom_spatvector(
    data = franjas_v,
    fill = c(celeste, blanco, celeste),
    color = NA
  ) +
  geom_spatvector(
    data = sol_v,
    fill = sol,
    color = NA
  ) +
  ggfx::with_blur(
    geom_spatvector(
      data = im_v,
      fill = NA,
      color = azul,
      alpha = .8,
      linewidth = 1
    ),
    sigma = 5
  ) +
  geom_spatvector(
    data = im_v,
    fill = blanco,
    color = sol,
    alpha = .5,
    linewidth = .3
  ) +
  coord_sf(expand = FALSE) +
  labs(caption = autor) +
  theme_void(base_family = "ubuntu") +
  theme_sub_plot(
    background = element_rect(fill = gris),
    margin = margin_auto(20),
    caption = element_markdown(margin = margin(b = 5, t = 5), color = blanco)
  )
Guardo.
ggsave(
  plot = g,
  filename = "viz/im.png",
  width = 30,
  height = 21,
  units = "cm"
)