Ocultar código
library(glue)
library(ggtext)
library(showtext)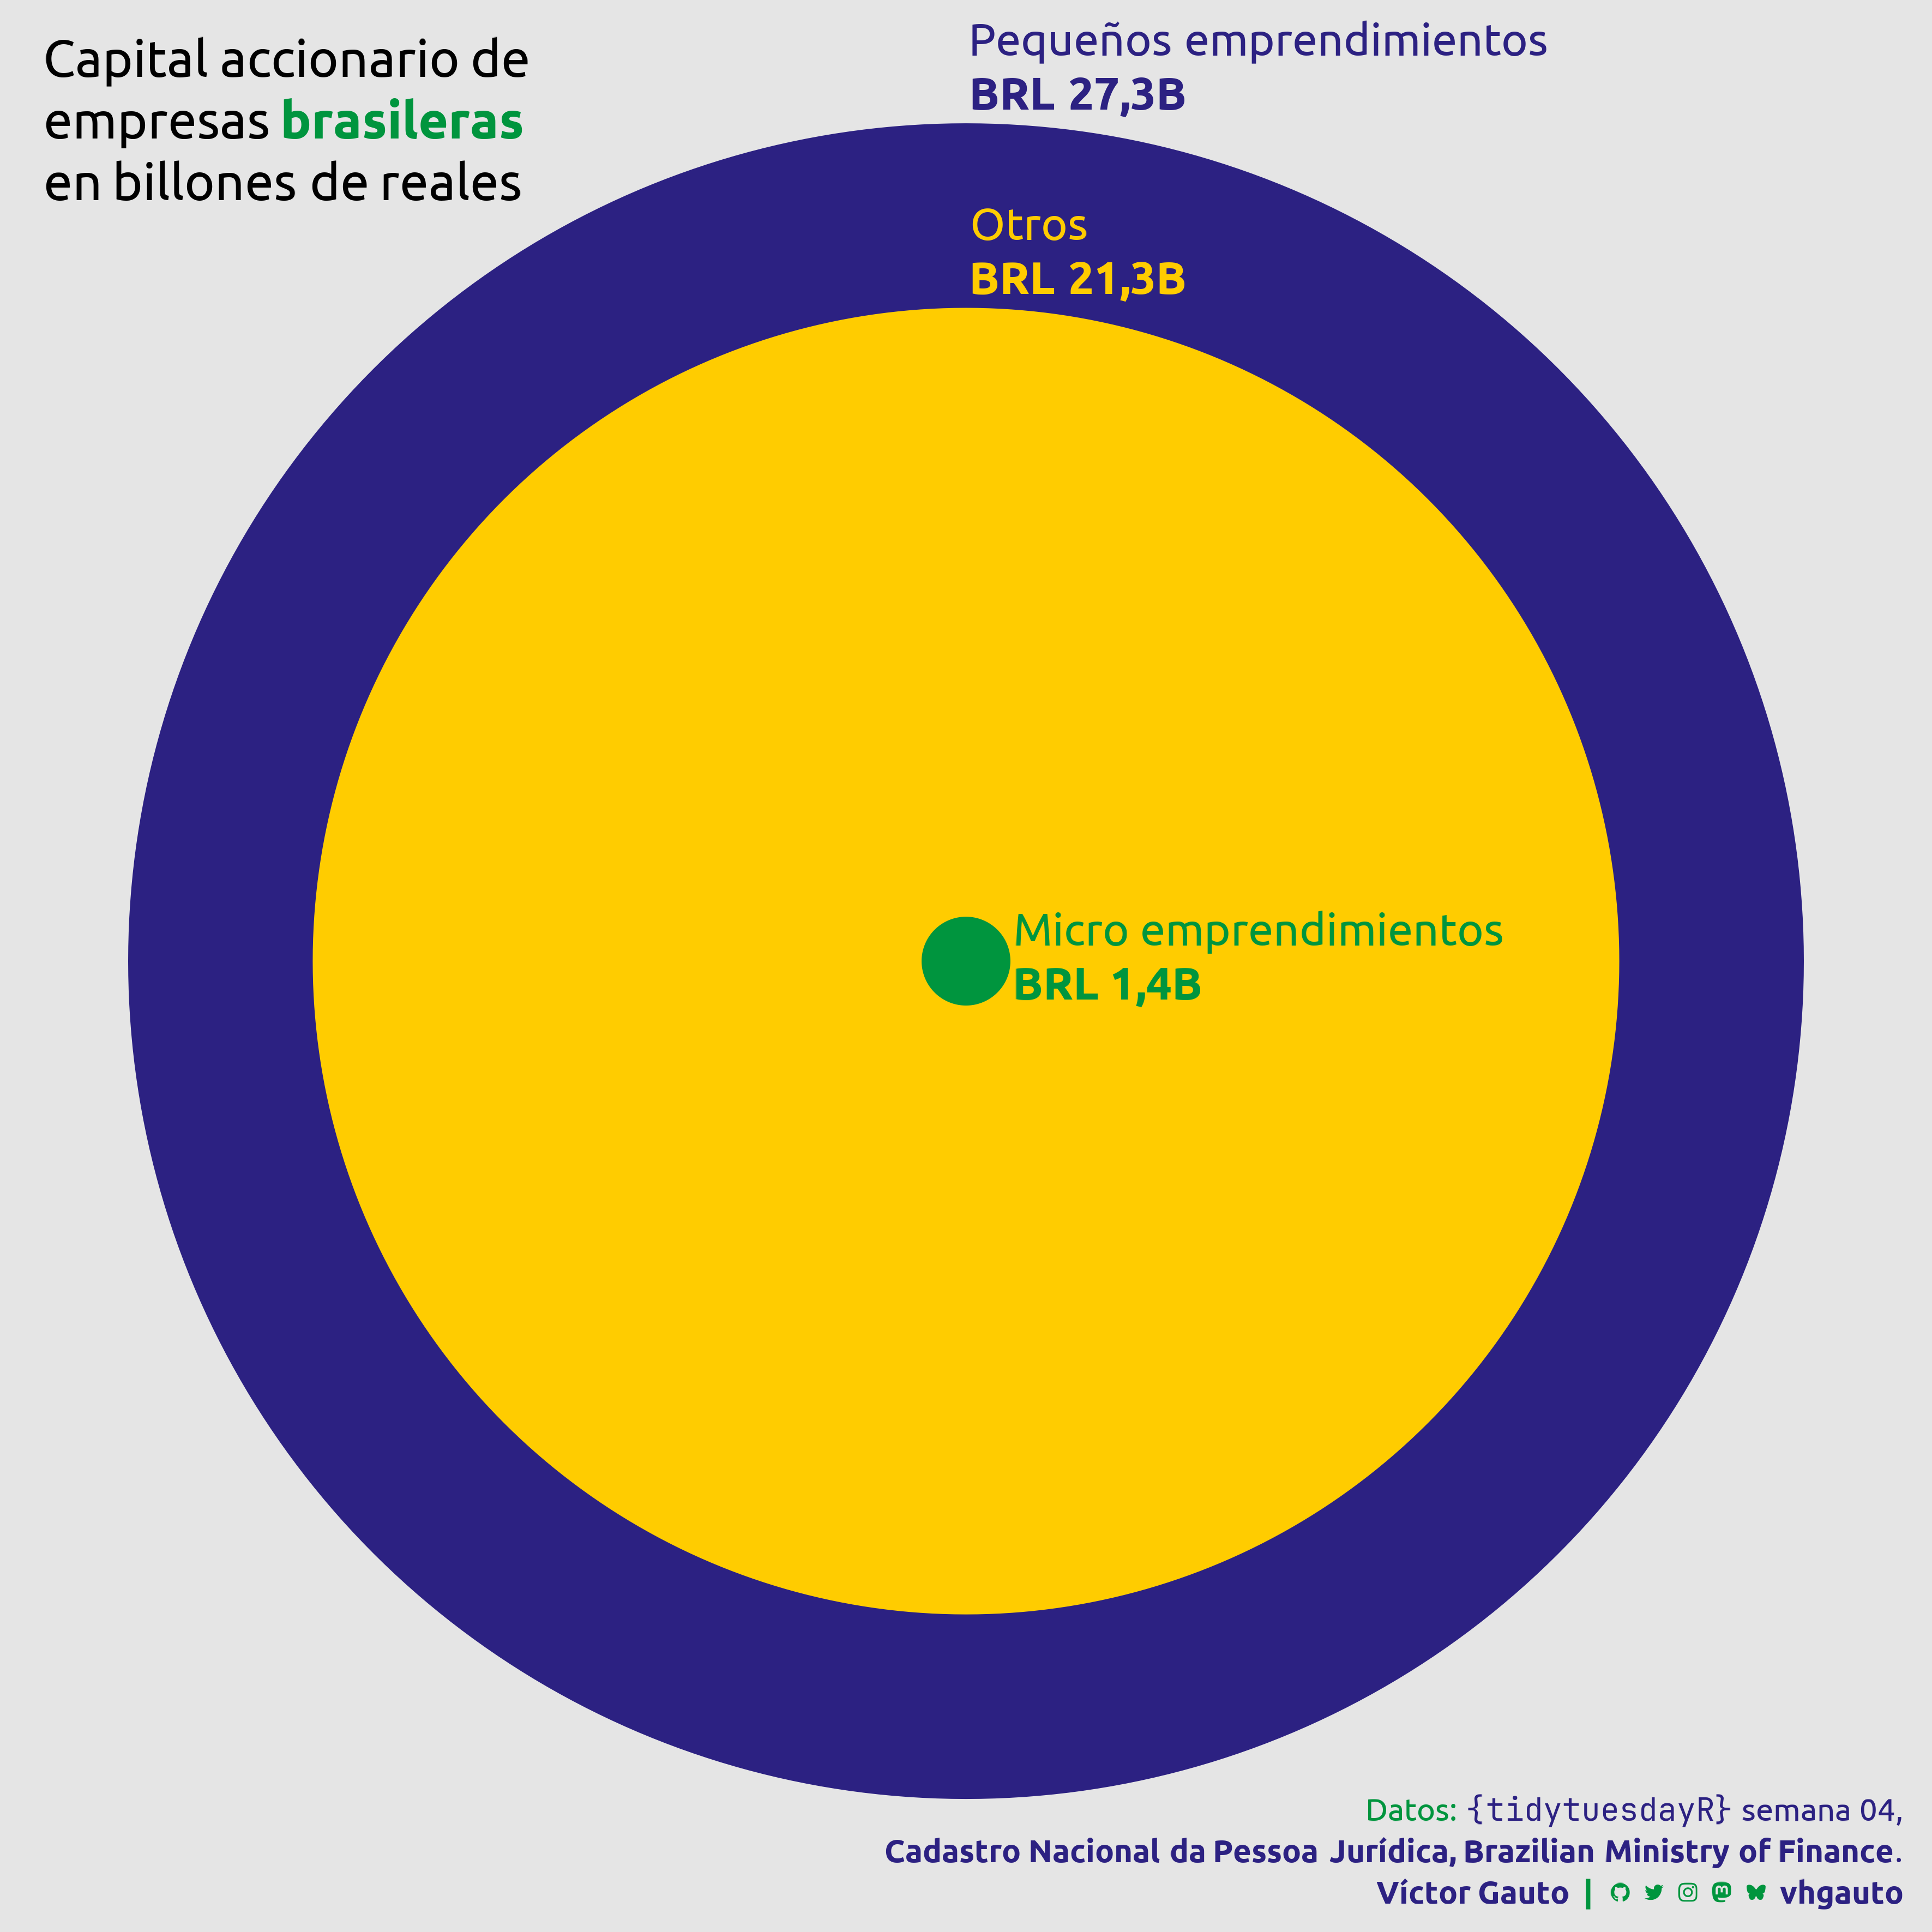
library(tidyverse)Capital accionario de empresas de Brasil, de acuerdo con el tamaño de la compañía.
library(glue)
library(ggtext)
library(showtext)
library(tidyverse)Colores.
c1 <- "#2c2182"
c2 <- "#ffcc00"
c3 <- "#00953e"
c4 <- "grey90"
Fuentes: Ubuntu y JetBrains Mono.
font_add(
  family = "ubuntu",
  regular = "././fuente/Ubuntu-Regular.ttf",
  bold = "././fuente/Ubuntu-Bold.ttf",
  italic = "././fuente/Ubuntu-Italic.ttf"
)

font_add(
  family = "jet",
  regular = "././fuente/JetBrainsMonoNLNerdFontMono-Regular.ttf"
)

showtext_auto()
showtext_opts(dpi = 300)fuente <- glue(
"Datos: <span style='color:{c1};'><span style='font-family:jet;'>",
"{{<b>tidytuesdayR</b>}}</span> semana 04,<br>",
"<b>Cadastro Nacional da Pessoa Jurídica, Brazilian Ministry of Finance</b>.</span>"
)
autor <- glue("<span style='color:{c1};'>**Víctor Gauto**</span>")
icon_twitter <- glue("<span style='font-family:jet;'></span>")
icon_instagram <- glue("<span style='font-family:jet;'></span>")
icon_github <- glue("<span style='font-family:jet;'></span>")
icon_mastodon <- glue("<span style='font-family:jet;'>󰫑</span>")
icon_bsky <- glue("<span style='font-family:jet;'></span>")
usuario <- glue("<span style='color:{c1};'>**vhgauto**</span>")
sep <- glue("**|**")
mi_caption <- glue(
"{fuente}<br>{autor} {sep} {icon_github} {icon_twitter} {icon_instagram} ",
"{icon_mastodon} {icon_bsky} {usuario}"
)tuesdata <- tidytuesdayR::tt_load(2026, 04)
companies <- tuesdata$companiesMe interesa comparar el capital accionario de las empresas por tamaño de empresa, como círculos concentricos de radio proporcional al capital.
Selecciono los tamaños de empresa, traduzco y asocio colores.
comp <- c("small-enterprise", "other", "micro-enterprise")

trad_comp <- c("Pequeños emprendimientos", "Otros", "Micro emprendimientos")
trad_comp <- setNames(trad_comp, comp)

color_comp <- c(c1, c2, c3)
color_comp <- setNames(color_comp, comp)
Sumo los capitales accionarios por tamaño de empresa, convierto a billones y aplico formato de número, agrego colores y traducciones.
d <- reframe(
  companies,
  s = sum(capital_stock),
  .by = company_size
) |>
  mutate(r = s / 1e12) |>
  mutate(
    company_size = fct(
      company_size,
      levels = c(comp)
    )
  ) |>
  mutate(trad = trad_comp[company_size]) |>
  mutate(color = color_comp[company_size]) |>
  mutate(
    stock = scales::label_number(
      scale = 1e-12,
      prefix = "BRL ",
      big.mark = ".",
      decimal.mark = ",",
      suffix = "B"
    )(s)
)Título y figura.
mi_titulo <- glue(
  "Capital accionario de<br>empresas <b style='color:
  {color_comp[3]}'>brasileras</b><br>en billones de reales"
)

g <- ggplot(
  d,
  aes(x0 = 0, y0 = 0, r = r, color = company_size, fill = company_size)
) +
  ggforce::geom_circle(show.legend = FALSE) +
  annotate(
    geom = "richtext",
    x = c(0, d$r[2], 0),
    y = c(d$r[1], 0, d$r[3]),
    label = glue("{d$trad}<br><b style='font-family=jet;'>{d$stock}</b>"),
    color = d$color,
    family = "ubuntu",
    size = 7,
    hjust = 0,
    vjust = c(0, .5, 0),
    fill = NA,
    label.color = NA,
    label.padding = unit(1, "mm"),
    label.margin = unit(0, "mm")
  ) +
  annotate(
    geom = "richtext",
    x = I(-.05),
    y = I(1.05),
    label = mi_titulo,
    hjust = 0,
    vjust = 1,
    size = 8,
    family = "ubuntu",
    fill = NA,
    label.color = NA,
    label.padding = unit(0, "mm"),
    label.margin = unit(0, "mm")
  ) +
  scale_fill_manual(values = color_comp) +
  scale_color_manual(values = color_comp) +
  coord_equal(expand = FALSE, clip = FALSE) +
  labs(caption = mi_caption) +
  theme_void(base_family = "ubuntu") +
  theme_sub_plot(
    margin = margin(t = 55),
    background = element_rect(fill = c4),
    caption = element_markdown(
      color = c3,
      size = 14,
      margin = margin(b = 10, r = -45),
      lineheight = 1.3
    )
  )
Guardo.
ggsave(
  plot = g,
  filename = "tidytuesday/2026/semana_04.png",
  width = 30,
  height = 30,
  units = "cm"
)